Buying Selling Volume StrategyFirst I would like to give the original credit and thanks to @ceyhun for his amazing volume script.
The way I decided to convert it into a strategy is divided into multiple types.
First, I decided in order to smooth out the values and make it more accurate to adapt the values to multiple timeframes.
After that I took the initial values from the buyers and sellers , and made a rest operation between them to have a flat difference between the power of both sides.
WIth that later on I decided to to apply a volatility filter,in this case bollinger bands, in order to find out potential leading trends.
At the same time in order to filter even more, I decided to make use as well for weekly VWAP values of the asset used.
Lastly I added a dynamic risk management into it , based on the ATR Daily values of the asset values.
As for the rules used, for example for long, I am looking that the price of the asset is above the weekly VWAP, after that I am checking that the MTF volume rest operation is both bullish and above the upper side of the bollinger.
For short we would want the asset to be below the weekly VWAP, and the volume to be bearish and above the upper side of bollinger.
The exit is either based on daily ATR values multipliers, or if we have a reverse condition.
If you have any questions, please let me know !
Recherche dans les scripts pour "volume"

Extended Price Volume Trend Strategy : EducationalThe Extended Price Volume Trend (EPVT) is a technical indicator that is used to identify potential trend changes and measure the strength of a trend. In this strategy, we combine the EPVT with other indicators to create a trading system that aims to capture trend reversals and momentum shifts.
The EPVT indicator is calculated by taking the cumulative volume and multiplying it by the percentage change in price. We then find the highest and lowest values of this indicator over a certain period of time to determine the baseline. The difference between the EPVT and the baseline is then plotted on a chart to create the EPVT line.
To use this indicator for trading, we look for crossovers of the EPVT line with zero. When the EPVT crosses above zero, it indicates that buying pressure is increasing, and we may consider taking a long position. Conversely, when the EPVT crosses below zero, it indicates that selling pressure is increasing, and we may consider taking a short position.
To further refine our trading signals, we use three take-profit levels, which we set as a percentage of the current EPVT value. We also use a simple moving average to provide additional confirmation of trend changes.
In summary, the EPVT trading strategy is a technical analysis-based approach to trading that aims to identify potential trend reversals and momentum shifts. By combining the EPVT indicator with other technical tools, we can create a comprehensive trading system that provides clear entry and exit signals for both long and short positions. Please note that this strategy is for educational purposes only and should not be taken as financial advice.

Capital Coders - Volume/Volatility StrategyThis strategy utilizes a combination of Volume and volatility to identify highly volatile candles, in periods of high and low volume trading. This allows the strategy to adjust to the market conditions. The Average True Range will highlight High Volatility breakouts, while the 24Hr Volume will determine weather the Trend will continue, or reverse.
Risk Management is an important part of any trading strategy. With this Strategy, you can leave your Risk calculator at home. Simply enter the maximum Risk per trade (% of your account) and let the Strategy determine your lot/position size.
Dynamically exit the market based on a single or multiple take profit levels. With simple configuration, this makes it easier than ever to dynamically exit the market.
Strategy includes the following features
Built in Risk Management
Variable Take Profit Levels
Built in Strategy Alerts
Signal Customization
HULL SUIT ,VORTEX,VOLUME OSC this strategy includes 3 free tradingview indicators
the 1st indicator is hull suit and the 2nd indicator is vortex and the final one is volume oscillator
for a long signal to be valid
the price must be above green hull suit line
, with new bullish cross on vortex , the blue line has to crossover the red line this would be anew signal to entr long position if volume oscillator above zero line , our stoploss must be under the recent lower low
and the risk to reward ratio will be 1.5
for a short signal to be valid , the price must be below red hull suit line
, with new cross on vortex , the red line has to crossover the blue line this would be anew signal to entr short position if volume oscillator above zero line ,
and lets see what happened to our trade

QQE MOD , RSI , VOLUME so this strategy includes 3 indicators
the 1st one is Q Q E mode on default sittings
the 2nd one is R S I with the following settings
R S I length from 14 to 40
and M A length from 14 to 150
the 3rd one is volume flow indicator with the following settings
max vol cutoff from 2.5 to 0.5
and signal length from 5 to 20
in long condition
for a long signal to be valid
we need to have a new blue histogram appeared on our q q e mode and the R S I purple line is above yellow moving average and finally the green line of the volume indicator is
above the orange line and both have to be above zero level
and once we have all these conditions fulfilled we can go ahead and take a long position
our stoploss must be under the recent lower low
and the risk to reward ratio will be 1.5
and lets see what happened to our trade
as we can see it hit the target
for a short signal to be valid
we need to have a new red histogram appeared on our q q e mode and the R S I purple line is below yellow moving average and finally the green line of the volume indicator is
below the orang line and both have to be below zero level
and once we have all these conditions fulfilled we can go ahead and take a short position .
our stoploss must be above the recent higher high
and the risk to reward ratio will be 1.5

Bollinger band & Volume based strategy V2this script is upgraded version of previous one the major change is deleted script which find a highest price after entry the last of strategy is same.
If current volume is above daily average volume, and three bollinger band`s Standard Deviation, 1 and 1.5 and 2 if the current lowest price is bigger then 1 stdev and current closed is bigger then 1.5 stdev and the last,highest price is above 2.0 stdev, it defined current market is bullish and had momentum.
and the Short will entered when ma60 and ma120 is undercrossed it work as prevent current price is way lower then entry price.
**this script is working in 15min Only in BTC market or USDT**
** basic equity setting is 500$, set your own**
**if you will use this in real-trade,plz comment the result to me**
Ps: i wanna know why my script is only working well in 15 min tick, anyone who has similar phenomenon or if you had a answer about it, please comment me.

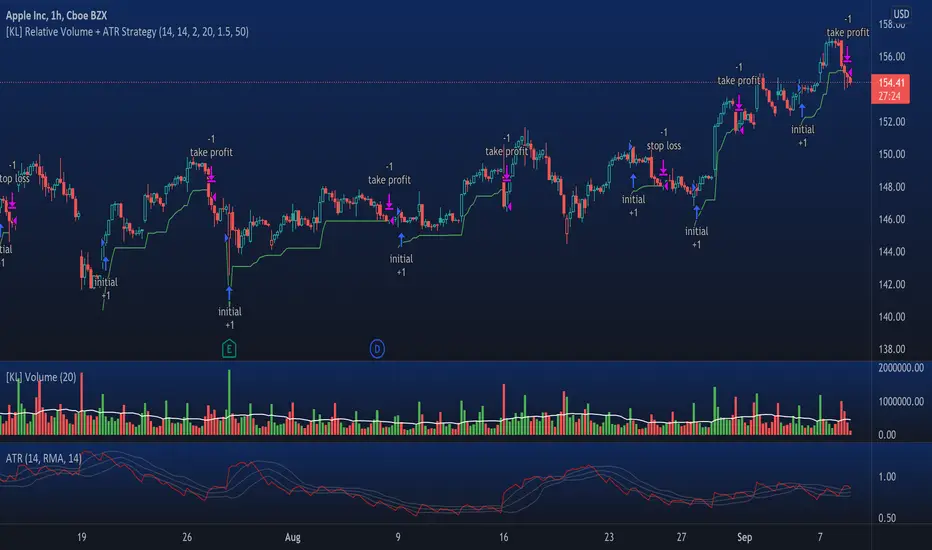
[KL] Relative Volume + ATR StrategyThis strategy will enter into long position when (a) current volume is above the average volume, and when (b) volatility of prices (based on ATR) is relatively low.
Backtested on hourly timeframes, win rates range between 35% to 50% on stocks with positive drifts (i.e. tendency to move upwards). Default setups are as follows:
- Average volume is computed using simple moving average (sma) of 14 periods. By default, 1.4x ratio seems to work well on most large cap stocks. If it's too high, then amount of potential points for entry will decrease. But if it's too low, then this indicator becomes meaningless.
- ATR (for determining volatility), look back period is 14 (following conventions). I have noticed that the profits could change drastically when changed to different values for each individually security. Feel free to experiment around with this parameter.
Other information: This strategy is based off of one of my previous scripts; a script called "Relatively Volume Strategy". The objective of this new script is to simplify the process of determining periods of low volatility. In this new script, we assume prices are consolidating when current ATR is within its moving average value by +/- one standard deviation.
[KL] Relative Volume StrategyThis strategy will Long when:
Confirmation #1: when volume is relatively high
Confirmation #2: during periods of price consolidation (See )
It exits when either (a) stop loss limit is reached, or when (b) price actions suggest trend is bearish.
Measuring price volatility to assume consolidation:
For each candlestick, we quantify price volatility by referring to the value of standard deviations (2x) of closing prices over a look-back period of 20 candles. This is exactly what the Bollinger Band (“BOLL”) indicates by default.
Knowing the value of standard deviation (2x) of prices (aka the width of lower/upper BOLL bands), we then compare it with ATR (x2) over a user-defined length (can be configured in settings). Volatility is considered to be low, relatively, when the standard deviation (x2) of prices is less than ATR (2x).

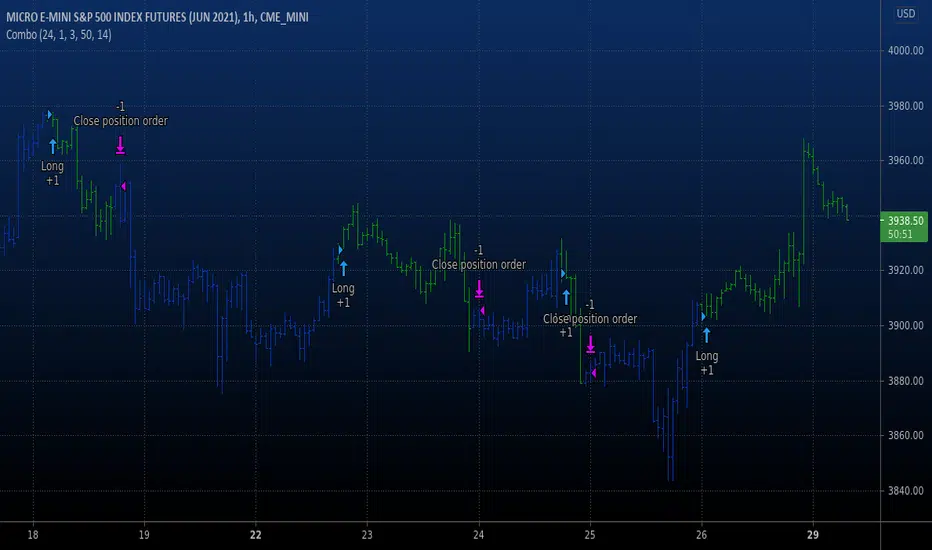
Combo Backtest 123 Reversal & Positive Volume Index This is combo strategies for get a cumulative signal.
First strategy
This System was created from the Book "How I Tripled My Money In The
Futures Market" by Ulf Jensen, Page 183. This is reverse type of strategies.
The strategy buys at market, if close price is higher than the previous close
during 2 days and the meaning of 9-days Stochastic Slow Oscillator is lower than 50.
The strategy sells at market, if close price is lower than the previous close price
during 2 days and the meaning of 9-days Stochastic Fast Oscillator is higher than 50.
Second strategy
The theory behind the indexes is as follows: On days of increasing volume,
you can expect prices to increase, and on days of decreasing volume, you can
expect prices to decrease. This goes with the idea of the market being in-gear
and out-of-gear. Both PVI and NVI work in similar fashions: Both are a running
cumulative of values, which means you either keep adding or subtracting price
rate of change each day to the previous day`s sum. In the case of PVI, if today`s
volume is less than yesterday`s, don`t add anything; if today`s volume is greater,
then add today`s price rate of change. For NVI, add today`s price rate of change
only if today`s volume is less than yesterday`s.
WARNING:
- For purpose educate only
- This script to change bars colors.

4X EMA and volume strategyThis is a strategy made from multiple types of EMA and volume(EOM).
This is a long only strategy.
EMA 1 = 13
EMA 2 = 21
EMA 3 = 50
EMA 4 = 180
In this case we have 2 options for entry:
1.We check that are candles are in ascending order and EOM is above 0 - > long, descending and eom<0 -> exit long
2.We check if we have a crossover between the first ema with the second and the third. Cross up -> long, crossdown -> exit long
If you have any questions let me know!

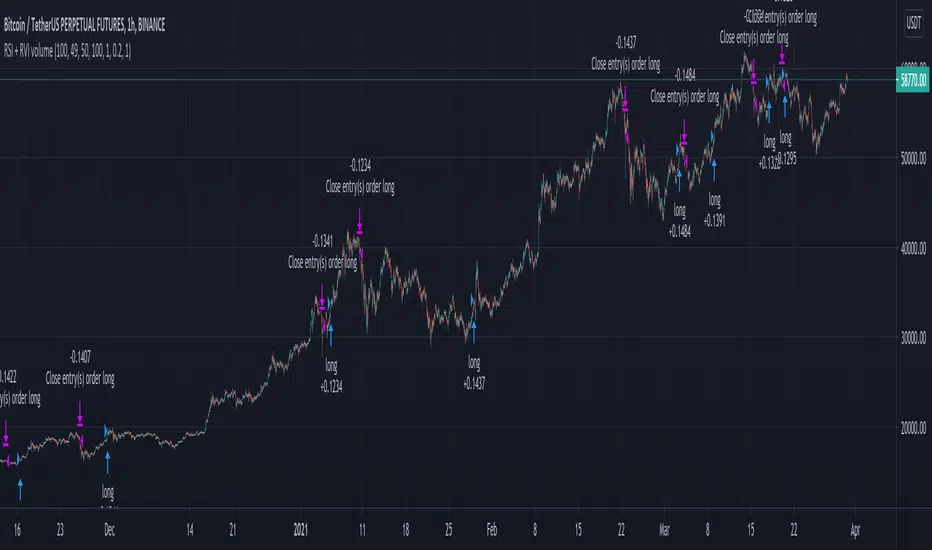
RSI and RVI on volume crypto BTC This strategy combine special version of RSI and RVI , where in this case , I am using the volume , for measuring the speed and change of volume to the price both up and down size together with the volatility spikes.
In this case instead of looking at the volume or volatility, I am combining them into one oscillator.
For best usage, I believe a big length of candles like 100 can get better results, and use it in this way as a lagging indicator.
Since most of the tests I made for futures, I applied a risk management in % of the price movement. For stop loss we have 20% while for TP, 100%. However in both cases, we will exit sooner, and thats going to be when condition from the oscillator says so.
For this we have a middle level, 50, which will act as both overbought and oversold areas.
At the same time I apply the posibility of using leverage into size calculations for more precise tests and try to get min-max out of it.
If you have any questions, please let me know !
Combo Backtest 123 Negative Volume Index This is combo strategies for get a cumulative signal.
First strategy
This System was created from the Book "How I Tripled My Money In The
Futures Market" by Ulf Jensen, Page 183. This is reverse type of strategies.
The strategy buys at market, if close price is higher than the previous close
during 2 days and the meaning of 9-days Stochastic Slow Oscillator is lower than 50.
The strategy sells at market, if close price is lower than the previous close price
during 2 days and the meaning of 9-days Stochastic Fast Oscillator is higher than 50.
Second strategy
The theory behind the indexes is as follows: On days of increasing
volume, you can expect prices to increase, and on days of decreasing
volume, you can expect prices to decrease. This goes with the idea of
the market being in-gear and out-of-gear. Both PVI and NVI work in similar
fashions: Both are a running cumulative of values, which means you either
keep adding or subtracting price rate of change each day to the previous day`s
sum. In the case of PVI, if today`s volume is less than yesterday`s, don`t add
anything; if today`s volume is greater, then add today`s price rate of change.
For NVI, add today`s price rate of change only if today`s volume is less than
yesterday`s.
WARNING:
- For purpose educate only
- This script to change bars colors.
Combo Backtest 123 Reversal & Klinger Volume Oscillator This is combo strategies for get a cumulative signal.
First strategy
This System was created from the Book "How I Tripled My Money In The
Futures Market" by Ulf Jensen, Page 183. This is reverse type of strategies.
The strategy buys at market, if close price is higher than the previous close
during 2 days and the meaning of 9-days Stochastic Slow Oscillator is lower than 50.
The strategy sells at market, if close price is lower than the previous close price
during 2 days and the meaning of 9-days Stochastic Fast Oscillator is higher than 50.
Second strategy
The Klinger Oscillator (KO) was developed by Stephen J. Klinger. Learning
from prior research on volume by such well-known technicians as Joseph Granville,
Larry Williams, and Marc Chaikin, Mr. Klinger set out to develop a volume-based
indicator to help in both short- and long-term analysis.
The KO was developed with two seemingly opposite goals in mind: to be sensitive
enough to signal short-term tops and bottoms, yet accurate enough to reflect the
long-term flow of money into and out of a security.
The KO is based on the following tenets:
Price range (i.e. High - Low) is a measure of movement and volume is the force behind
the movement. The sum of High + Low + Close defines a trend. Accumulation occurs when
today's sum is greater than the previous day's. Conversely, distribution occurs when
today's sum is less than the previous day's. When the sums are equal, the existing trend
is maintained.
Volume produces continuous intra-day changes in price reflecting buying and selling pressure.
The KO quantifies the difference between the number of shares being accumulated and distributed
each day as "volume force". A strong, rising volume force should accompany an uptrend and then
gradually contract over time during the latter stages of the uptrend and the early stages of
the following downtrend. This should be followed by a rising volume force reflecting some
accumulation before a bottom develops.
WARNING:
- For purpose educate only
- This script to change bars colors.

Combo Backtest 123 Reversal & Volume SMA This is combo strategies for get a cumulative signal.
First strategy
This System was created from the Book "How I Tripled My Money In The
Futures Market" by Ulf Jensen, Page 183. This is reverse type of strategies.
The strategy buys at market, if close price is higher than the previous close
during 2 days and the meaning of 9-days Stochastic Slow Oscillator is lower than 50.
The strategy sells at market, if close price is lower than the previous close price
during 2 days and the meaning of 9-days Stochastic Fast Oscillator is higher than 50.
Second strategy
Volume and SMA
WARNING:
- For purpose educate only
- This script to change bars colors.

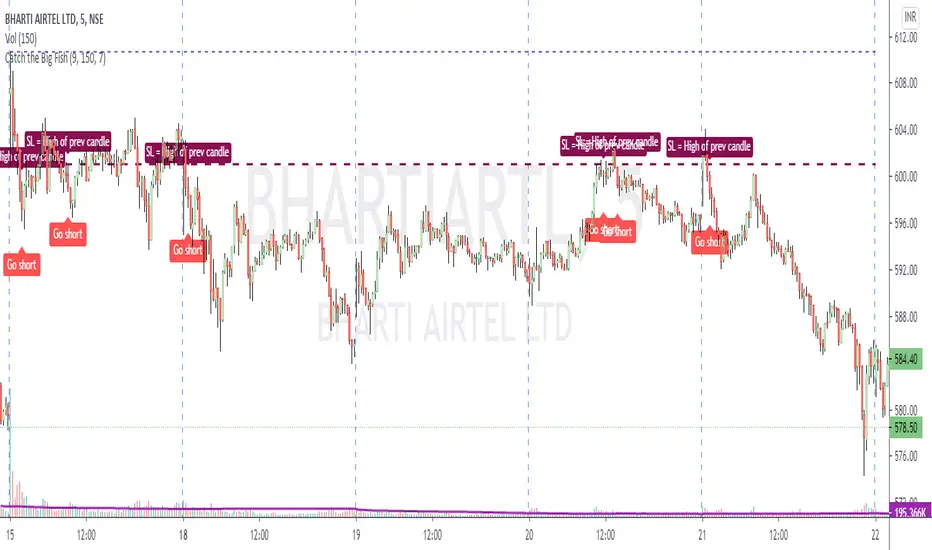
Catch the Big FishVolume based script to catch a big move. Works best on 5 min timeframe.
The default sma duration for volume is set to 150 = number of candles in 5 mins timeframe for 2 days.
Heavy volume is defined as = more than 9 times of sma.
Both parameters are configurable.
Trading strategy: Long buy at high / Short sell at low of the candle where the script gives the signal.
Important note regarding SL - for Long / Short positions respectively, the SL should be placed at low / high of previous candle, and NOT of the same candle.
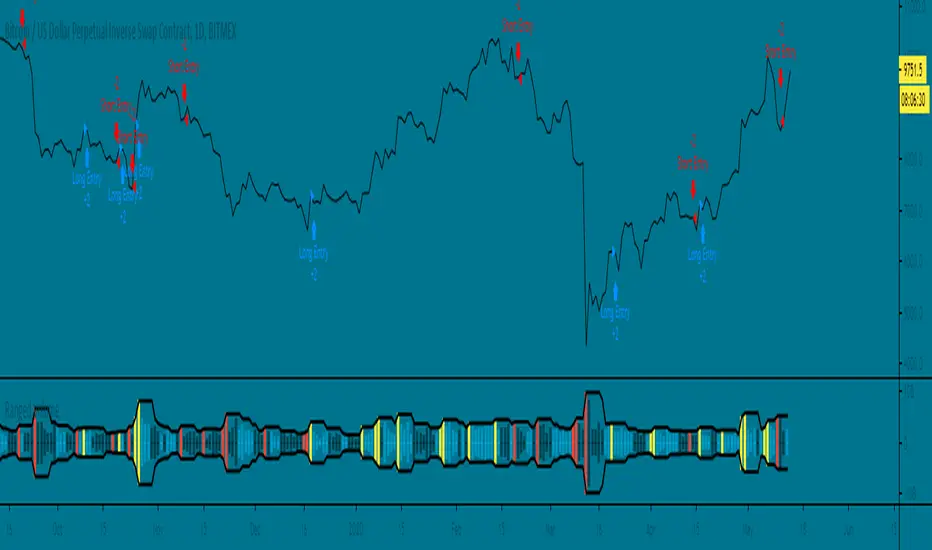
Ranged Volume Strategy - evoThis is the strategy version for the ranged volume indicator I published a few days ago.
Long : First yellow break-out after red
Short : First red break-out after yellow
Because this is volume, you want to be using this on an exchange with high volume for the best results. Default settings are not optimized but work great on bitcoins daily chart.
A short explanation of the indicator below:
Simple Momentum Strategy Based on SMA, EMA and VolumeA simple, non short selling (long positions only, i.e. buy low and sell high) strategy. Strategy makes use of simple SMA, EMA and Volume indicators to attempt to enter the market at the most optimum time (i.e. when momentum and price are moving upwards). Optimum time is defined mainly by picking best timing for price moves higher based on upwards momentum.
This script is targeted / meant for an average/typical trader or investor. This is why a non short selling approach was selected for optimisation for this strategy because "typpical", "average" traders and investors usually use basic (i.e. minimum fees / free membership) exchanges that would not usually offer short selling functionality (at least without additional fees). The assumption used here is that only advanced and sophisticated traders and investors would pay for advanced trading platforms that enable short selling, have a risk appetite for short selling and thus use short selling as a strategy.
The results of the strategy are:
In an overall roughly bearish market (backward testing from beginning to end of 2018) i.e. the market immediately following the highs of around 20k USD per BTC, this strategy made a loss of £3231 USD on trades of a maximum of 1 BTC per long position.
But in an overall bullish market, it makes a profit of about $6800 USD from beginning of 2019 onwards by trading a maximum of 1 BTC per long position.
NOTE: All trading involves high risk. Most strategies use past performance and behaviour as indicators of future performance and that is not necessarily indicative of future results. Hypothetical or simulated performance results have certain inherent limitations too. One limitation is that unlike an actual performance record, simulated results do not represent actual trading and since the trades have not actually been executed, the results of those trades themselves do not have any influence on actual market results, which in real life they would have had (no matter how minor). Additionally, simulated results may have under or over-compensated for the impact, if any, of certain market factors, such as lack of liquidity. Simulated trading programs in general are also, by their nature, designed with the benefit of hindsight. No representation is being made that any account will or is likely to achieve profits or losses similar to those shown.

Hancock - Filtered Volume OBV OSC [Strategy]Trading strategy based on Donchain channel price breakouts confirmed by an optionally configurable volume filtered OBV oscillator.
Colored diamonds on charts represent signals where top side is buy side and bot side is sell side - green indicates open and red indicates close.
Pretty simple but nicely demonstrates the volume filtered OBV oscillator found here .
Happy trading
Hancock

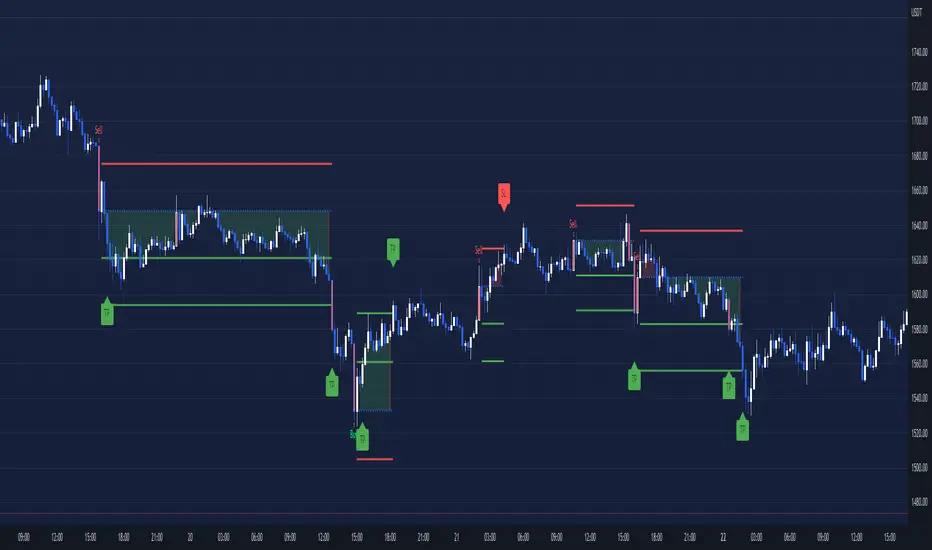
[Tirano] Volume Paradox DemoHi. this is Tirano
Introduction to Volume Paradox
1. The lines where the support or resistance acts once are expressed by lines. Once hit and bounced, there is a retest through bounce, and it is likely to bounce again.
- Therefore, if you enter from the section represented by the line when the recurrence occurs, the probability of linking with the profit is high.
2. Express the overall flow in the form of clouds and channels.
- If the cloud is going down slowly, it is better to go into the short when touching the cloud, rather than going into long in the buy signal.
- You can trade without overtaking the whole flow (trend).
- It is advantageous for one way situation that goes in one direction.
If you have any other questions, please leave a comment.

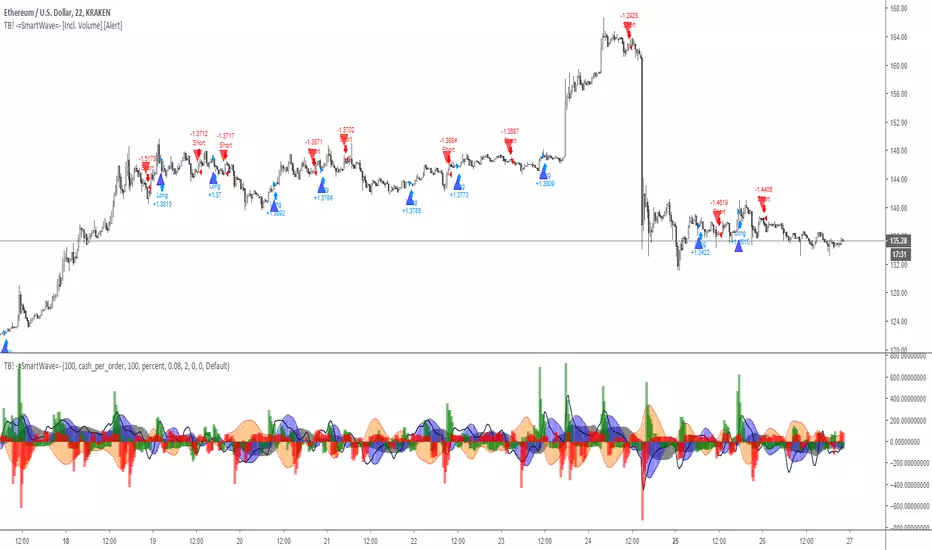
TB! -=SmartWave=- [Incl. Volume]My Precious SmartWave Formula Ready for Action.
What does it do?
It monitors buys vs sells, since the market moves because people buy n sell,i kinda thought it would be important.
It also monitors price action in relation to that volume to determine if a lot of volume is gobbled up by (over-) leveraged positions.
It provides a good insight when to take some action.
NB.
The drawback and the losses it makes can be reduced a lot with a 2.5% stoploss and fib based TP's, i just did not care to have the script deal with those,
VMA - Volume Moving AverageA Short Term trading indicator that measure the overall direction of volume compared to price. Kills in Heikin Ashi, but wanted to show it kills in candlesticks too :)

Stochastic VolumeA conceptual idea to include volume in a regular Stochastics.
VWMAs instead of SMAs and h/l/c given more weight when volume spikes. In the future I am interested in giving volume a bigger role in final calculation in other ways.
This does not perform well when not curve fitted.

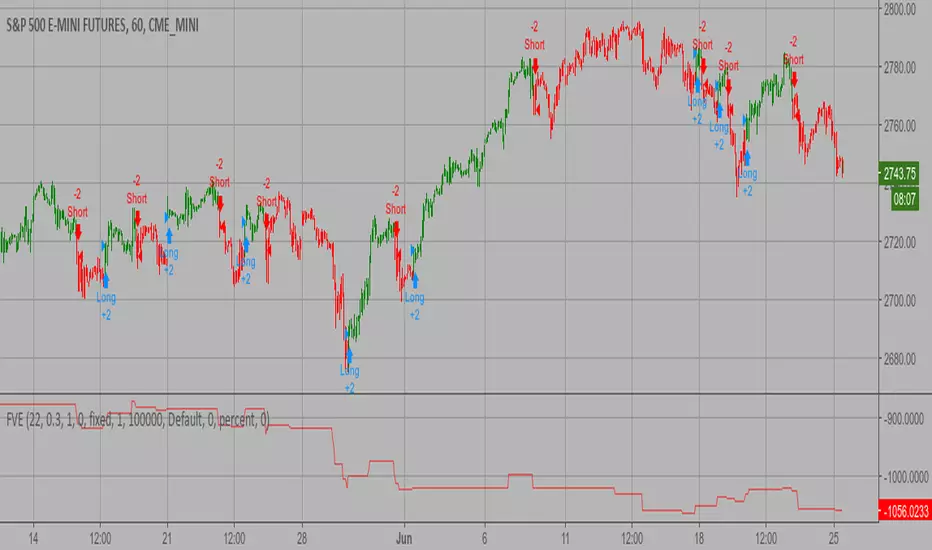
Finite Volume Elements (FVE) Backtest The FVE is a pure volume indicator. Unlike most of the other indicators
(except OBV), price change doesn?t come into the equation for the FVE (price
is not multiplied by volume), but is only used to determine whether money is
flowing in or out of the stock. This is contrary to the current trend in the
design of modern money flow indicators. The author decided against a price-volume
indicator for the following reasons:
- A pure volume indicator has more power to contradict.
- The number of buyers or sellers (which is assessed by volume) will be the same,
regardless of the price fluctuation.
- Price-volume indicators tend to spike excessively at breakouts or breakdowns.
You can change long to short in the Input Settings
WARNING:
- For purpose educate only
- This script to change bars colors.