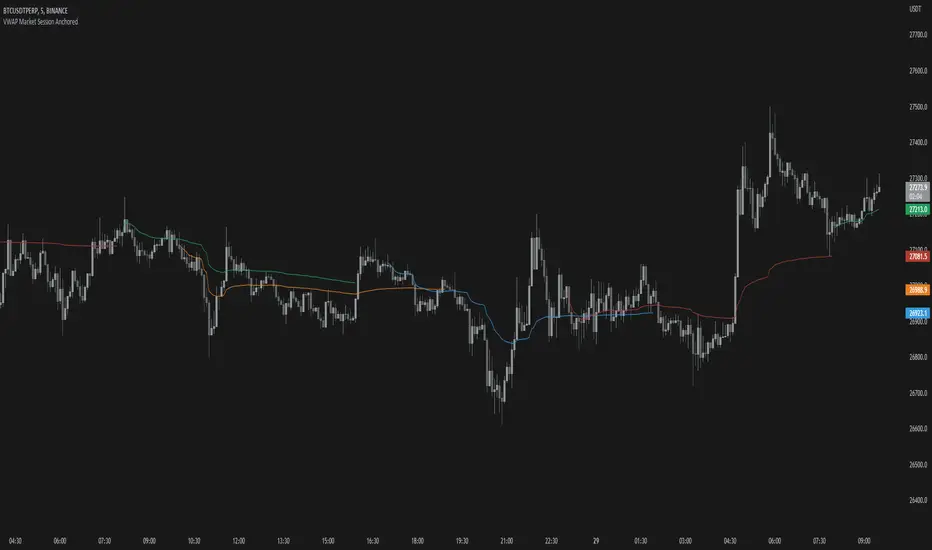
VWAP Market Session AnchoredVWAP Market Session Anchored differs from the traditional VWAP or VWAP Auto Anchored indicator in that the Volume Weighted Average Price calculation is automatically anchored to four major market session starts: Sydney, London, Tokyo, New York.
Settings
Source: the source for the VWAP calculation.
Offset: changing this number will move the VWAP either Forwards or Backwards, relative to the current market. Zero is the default.
Band: enabling this will show Standard Deviation bands.
Band Multiplier: the value the Standard Deviation bands will be multiplied by before being plotted on the chart.
Sessions : enabling the sessions will plot the respective anchored VWAP on chart.
Custom: enabling this will show a custom user-defined session.
Custom UTC : the custom session is defined by a starting UTC hour followed by the ending UTC hour.
Usage
Similar to the traditional VWAP, VWAP Market Session Anchored is a technical analysis tool used to measure the average price weighted by volume. VWAP Market Session Anchored can be used to identify the trend during a specific market session.
Limitations
When setting a custom session, be mindful that calculations are based off of the Coordinated Universal Time (UTC) time, you must convert your local time zone to UTC in order to have an accurate representation of your custom session.
It is not recommended to use this indicator on timeframes above 1 hour as market sessions only last a few hours.
Recherche dans les scripts pour "vwap"
VWAP - Volume-Weighted Average PriceVolume-Weighted Average Price (VWAP) is calculating day, week, month or year average price where transaction prices are weighted with the volume value.
This way script is estimating the average price based on both volume and price.
Features:
Drawing VWAP for days, weeks, months or years
Drawing initial periods (% with or without weekends)
Drawing last close value
3 standard deviation slots
Labels with values
Script Settings:
| Volume-Weighted Average Price visualization |
Type - Chart type selection:
D(ay) - Daily Volume Weighted Average Price
W(eek) - Weekly Volume Weighted Average Price
M(onth) - Monthly Volume Weighted Average Price
Y(ear) - Annual Volume Weighted Average Price
Draw VWAP - VWAP visiblity checkbox, color and line width used for VWAP visualization, checkbox for label with value.
Previous close - Drawing last VWAP close value. Color and line width used for drawing. checkbox for label with value.
Establishing period - Drawing initial area (described as % of the chart type period). Color picker for warning box background. VWAP is restarted with each period start. In the initial period VWAP value and it's deviations are not accurate and some traiding technics recommend to skip initial periods.
Include weekends - Checkbox if establishing period calculations should include weekends. Stock exchanges are not working during weekends (should be not checked) and crypto markets are working 7 days a week (should be checked).
| Standard deviation |
Slot1 - Standard deviation multiplier (0 is hiding), color and line width.
Slot2 - Standard deviation multiplier (0 is hiding), color and line width.
Slot3 - Standard deviation multiplier (o is hiding), color and line width.
Troubleshooting:
In case of any problems, please contact the author of the script. To improve speed of solving problem first check if script is drawn, and if there is a "!" character after script params. If you can see "!" character, move cursor over it for detail. Send message with error details, ticker and interval to us. The more precise will be your description the faster we will be able to help you.

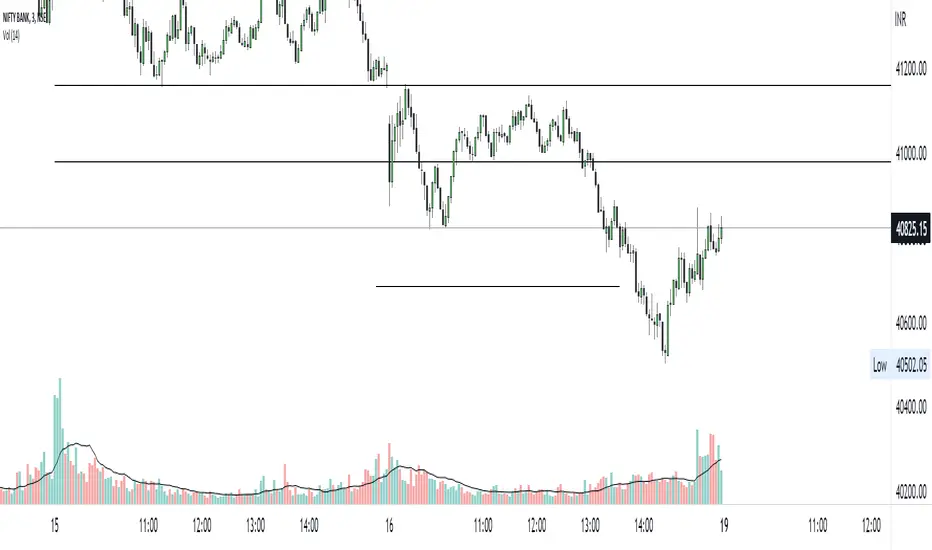
BankNifty VWAP VWAP - Volume-Weighted Average price ( VWAP )
The script draws Daily VWAP for BANKNIFTY SPOT , based on Futures Volume or underlying Index Stocks based on user input
BANKNIFTY INDICES IS THE WEIGHTAGE OF 12 STOCKS AS DECIDED BY EXCHANGE.
BANKNIFTY VWAP CALCULATES THE COMBINED VWAP OF THESE 12 STOCKS AND GENERATES VWAP FOR BANKNIFTY
It works with NIFTY as well. Please change the Symbol and Futures Volume symbol to "NSE:NIFTY" and "NSE:NIFTY1!"
NIFTY INDICES IS THE WEIGHTAGE OF 50 STOCKS AS DECIDED BY EXCHANGE.
NIFTY VWAP CALCULATES THE COMBINED VWAP OF THESE 50 STOCKS AND GENERATES VWAP FOR NIFTY
This script is intended for educational purposes only.
03/07/2022 WEIGHT AGE OF INDEX STOCKS (%)
HDFC Bank Ltd. - 27.63
ICICI Bank Ltd. - 22.98
Kotak Mahindra Bank Ltd. - 11.40
State Bank of India - 11.73
Axis Bank Ltd. - 11.6
IndusInd Bank Ltd. - 5.03
AU Small Finance Bank - Ltd. 2.54
Bandhan Bank Ltd. - 1.98
Bank of Baroda - 1.76
Federal Bank Ltd.- 1.76
PNB - 0.84
IDFC First Bank - 0.95

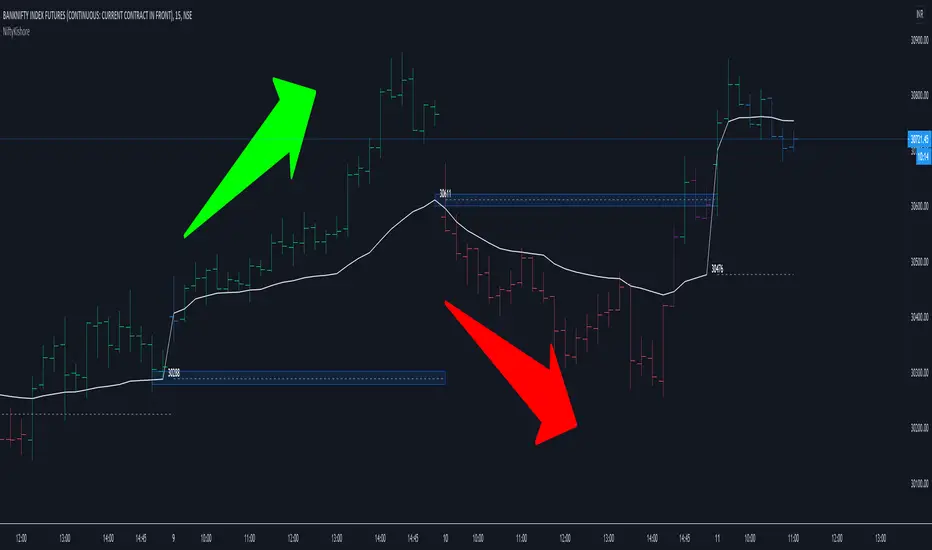
Vwap Pvwap Intraday Trend - NiftyKishoreHello Traders !!
This is a simple trend identification script which is based on the current vwap (Cvwap) and previous vwap (Pvwap).
Pvwap in the sense; previous day vwap closing value.
Bullish: price is closing above the current day vwap and previous day vwap(pvwap).
Bearish : Price is closing below the current day vwap and previous day vwap (pvwap).
Made a change to the barcolors as well :)
Bullish
Green Bar: close is above Pvwap and Cvwap.
Blue bar: close is above Pvwap but below Cwap.
Bearish
Red bar: close is below Pvwap and Cvwap.
Purple bar: close is below Pvwap but above Cvwap.
Simple but effective
Cheers !!
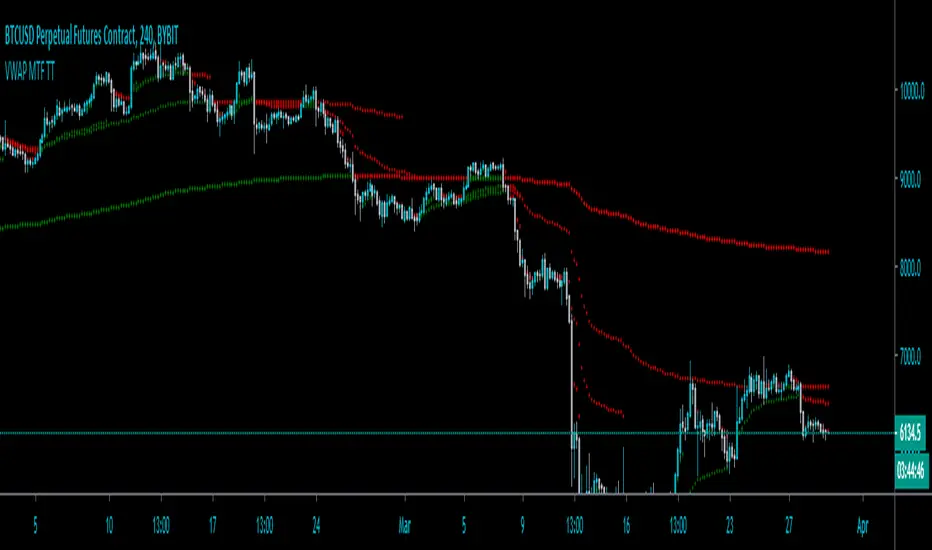
VWAP MTF TT by Chill00rThis is an "Volume-weighted Average Price" Indicator for Multi Timeframe.
VWAP color is trend-based
Different settings are available (some are off by default):
"Show Daily VWAP"
"Show Weekly VWAP"
"Show Monthly VWAP"
"Show Quarterly VWAP"
"Show Yearly VWAP"
"Show previous VWAP close"
Hit the Like Button
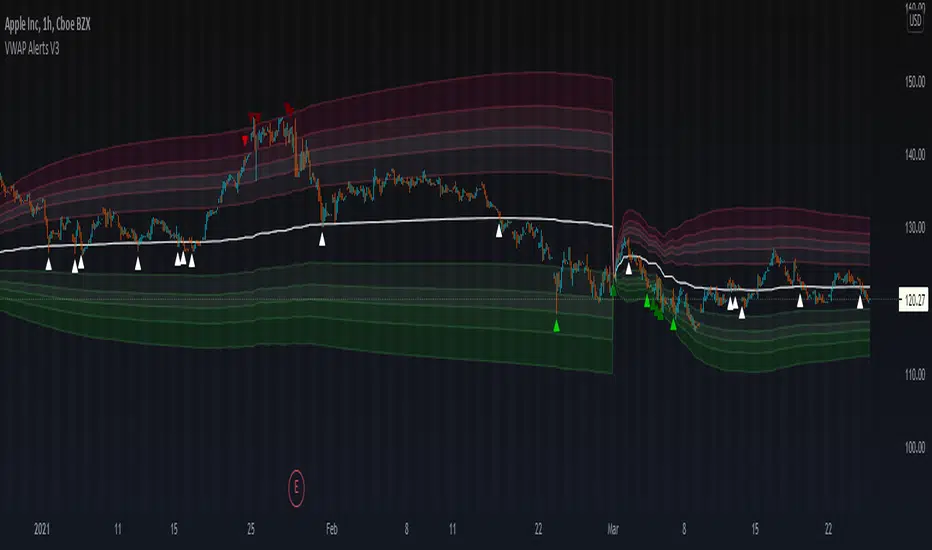
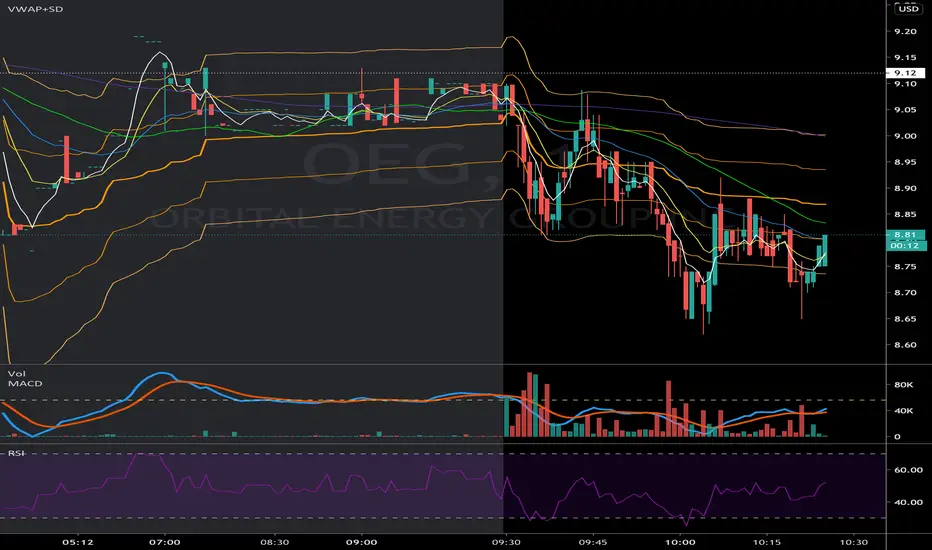
VWAP Alerts V3VWAP Alerts signal over bought/over sold conditions, relative to volume weighted average price, while deviation bands plot an extremely accurate point of mean reversion.
VWAP Alerts V3 includes multiple timeframe selection, along with multiplier input for deviation band setting
Alerts can be set for each individual band, for extreme oversold/overbought conditions, use "Vwap Low Deviation 4" and "Vwap High Deviation 4".
Alerts can also be set for VWAP bounces, by simply setting "VWAP Alert"
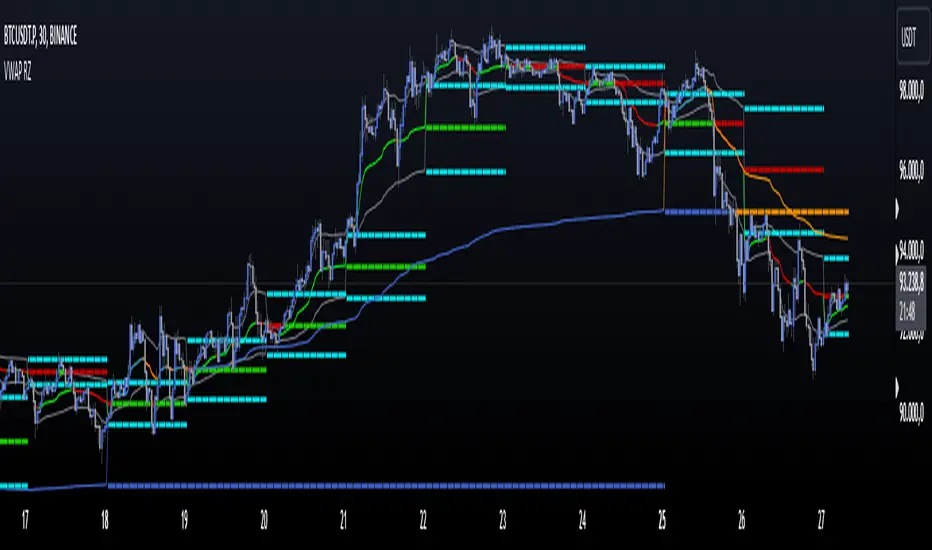
VWAP Reset Zones
With this indicator, the VWAP is displayed based on two adjustable sources. Close and Open are recommended by default.
The zone between the Open and Close VWAP is carried over to the next day as the zone at the end of the period.
The zones can be considered as support and resistance zones.
The chart illustrates the idea behind it.
In addition, the anchor function has been added so that anchor points can be set for session, week and month.
Depending on the set anchor and the selected time unit of the chart, an adjustment of the indicator to the time unit can be made.
Recommended time unit of the indicator: Session = 15 min / Weekly = 1H / Month = 4H
In addition, the zones between VWAP close and vwap open have been colored.
Bullish when the close is above the open price and bearish when the close is below the open price.
The principle is simple. If the average closing price is below the average opening price, a downtrend is to be assumed and vice versa an uptrend.
Vwap Stop lossThe VWAP Stop Loss indicator is a technical analysis tool that helps traders determine where to set their stop loss levels based on the Volume-Weighted Average Price ( VWAP ).
This indicator calculates the VWAP based on a specified length and multiplies it by a factor, which helps determine the distance for the stop loss levels.
When using this indicator, the red line represents the short stop loss level and the teal line represents the long stop loss level.
The lines will adjust automatically with the changing price action to ensure they always remain at the appropriate distance from the VWAP .
This indicator can be used on any time frame and for any market, making it a versatile tool for traders.
It can help you manage your risk by providing an objective method for setting stop loss levels, which can help increase the chances of successful trades.
Additionally, this indicator can also be used in combination with other technical indicators to help make more informed trading decisions.

Vwap based Supply and Demand Heatmap_V1This is a Multi-time frame "Thermographic Vwap based heatmap" showing Highest volume Vwap supply and demand zones.
User has 3 inputs for time frames to choose from or layer. It comes preset with "Short" and "Mid" time frame enabled and user can choose to add an additional layer if they would like for longer time frame analysis. If ALL time frames are enabled, fewer levels will show overall due to the 500 map limit, But zones will become brighter, larger, and more "precise" as they overlap and seek out the highest volume concentration amongst all levels.
What is the map showing you?
The heat map goes through each user selected time frame and searches for the highest volume candle and plots a zone based of that candles Vwap and high. These zones act as dynamic support and resistance. Each zone will "Degrade" and disappear over time and show positive when price has broken, cleared and held above it. The shift in color however is not immediate in change, rather transitional, so as not to "Repaint" causing false sense of clearing a zone. All negative zones (Price below) are colored red. User can choose to change any of the maps color's if they would like.
Time frame MUST be larger than your current charts resolution.-
Example- If on a 3min chart, user would choose any time frame LARGER than 3 min to display a map from.
Time frames the zones work best on are 1,3,5,15 min, paired with maps such as "Daily, Weekly, 240min(4hr), 60min" etc for intraday scalping or trend style trading. If on a larger time frame, 60mi, 4hr, Daily, user would choose larger maps like Daily, Weekly, monthly only. User can choose to display all, or just one time frame's zone at a time if they would like. If on a smaller intraday chart, You can start with "Daily" map first, increase opacity if the map is to dark. Then add additional time frames up or down in time if you'd like so long as maps time frame is larger than the charts.
If on a 1, 3, or 5min chart, you can also try the 30,60, or 240min maps for finer granularity and "Scalping" support and resistance.
If you choose a set of time frames, and do not see maps interacting with current price, then cycle out to a higher chart time frame and maps that are one or two time frames higher than current chart resolution.
These maps are showing you where supply and demand are situated since they are looking for the "Highest Volume" candles in each time frame you choose-
The range cast from the highest volume launch candle have proven to be strong support or resistance. Think of "Trapped trader's" if viewing over head supply level's, these traders will sell into a push higher until cleared. Vice versa, if viewing a demand level below, think of a "Base", especially on higher time frames. An area of high volume participation, where buyer's have shown support, and launched a run from. When price cycles back to these zone's, one would expect support from them.
Each zone has a high or low, you will often see price discovery "Test" the high and low of each zone. Probing as they say in Auction market theory to see if there are still buyers, or seller's present. I will often wait for the probe of the high or low of a zone, then look to participate once they have wicked the area and cleared the inventory there and start to move to the opposing side of the zone I am looking to participate in. Think of "Value low, and Value high" in market or volume profile. Market maker's aim to test the participants "Max pain", and absorb stops in each direction. With that said the maps are not meant to be "Lines in the sand" or concrete level's, they are simply hot or cold zones where you could expect participation to happen, the "Hotter" or "Brighter" a zone is the higher the volume concentration is there at that price area. So act accordingly and use this as an addition to your analysis, not the ONLY thing you take into consideration.
With that said, Trading is RISKY, The creator of this code is NOT a licensed professional, and this tool, nor description is meant to be trading or financial advice! The user whom downloads this tool assumes ALL responsibility and liability associated with the financial risk that comes with the use of this analysis tool and trading in general. The creator of the code advises all users to do their due diligence and contact a licensed broker dealer before making ANY financial decision's based off of analysis done with this tool.
Any question's, Comments or concerns feel free to message via Tradingview platform.
Enjoy-
JMF

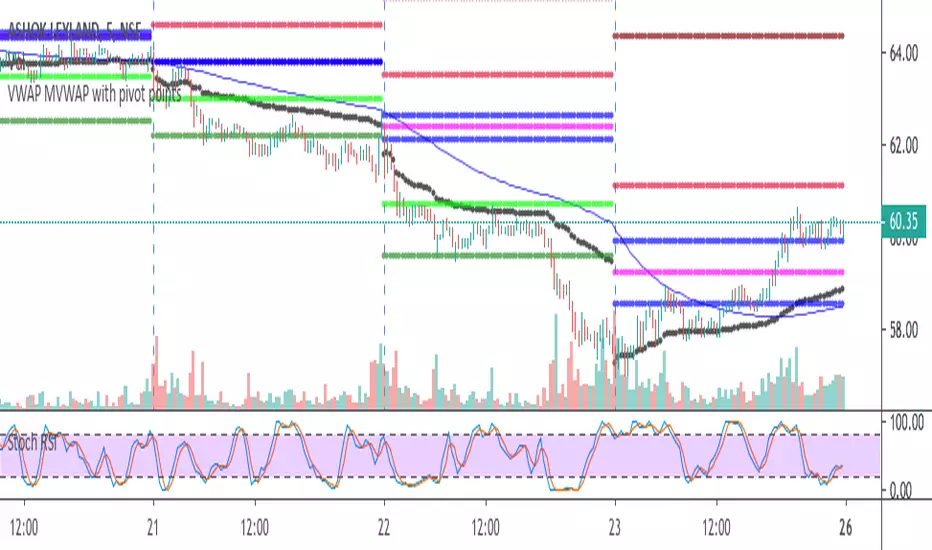
VWAP/MVWAP/SMA CROSSOVERTo use this indicator is simple.
When the VWAP (Thick Yellow) AND the two SMA (Orange and thin Yellow) cross above the MVWAP (Purple) then you will be in a uptrend that could possibly continue upwards. The opposite is true if you are looking a short opportunity, wait for the three other lines to cross under the MVWAP and you should be in a downtrend that could possibly continue downwards
Of course as with all indicators not every signal will be 100% accurate there is no way to predict human emotions when it comes to trading but based on the VWAP strategy used in other markets this is the closest I could get.
Note: Don't relay completely on this indicator to think for you. Use other forms of TA to confirm all positions before entering. And if the candles start trending the opposite direction after a lets say a mini pump/dump then the signal was false.
Finally this was made according to the 15 minute chart. I did not plan on remaking it for any other timeframes as I have left the code open for you to tweak and the setting are free to adjust aswell.
Q/A
Q: Does it repaint?
A: No, this is based on moving averages as far as I know they don't repaint.
Q: How did you come up with this indicator?
A: Went on youtube looking for trading strategies other and the usual EMA crosses and found a VWAP & EMA strat. I added the MVWAP and played with the numbers until I found something that I liked.
Q: How long have you been trading/learning pinescript?
A: Been trading less than a two months and pinescript about a month and a half.

VWAP AlertsVWAP Alerts for intraday VWAP bounces and VWAP deviation mean reversions. I am currently finalizing the alert section make it more streamlined.
Thanks to @TheYangGuizi for an amazing script

VWAP CandlesTried making candles of Vwap instead of normal price to see if something interesting would happen. Something interesting did happen as you can see.
Looks best in 4h because of reasons unknown. In lower timeframes it looks kinda stupid (moves the same as nrmal vwap). Day or above it looks the same as normal candles.
Gaps seem to work as s/r? or at least I've seen price react to those levels.
I've also seen a vwap reversal candles show (like dojis, pin bar), while price candles look normal. Could potentially give you a reversal warning?
You can also plot indicators like bollinger bands etc on the vwap candles. Just press the little plus.

VWAP PressureKey Features and Utility:
Intrabar Focus: Unlike standard VWAP, which provides a cumulative average throughout the day, the Intrabar VWAP focuses on volume-weighted price calculations within shorter time frames. This allows traders to see how price and volume interact moment-to-moment, offering a granular view of market sentiment.
Market Pressure Analysis: The indicator examines the difference between a smoothed weighted average price of the close and intrabar price movements. This analysis helps in identifying the market pressure at high volume areas. When the market exhibits high volume at low prices within a bar, it suggests accumulation, whereas high volume at high prices indicates distribution.
Momentum and Pressure Shift Signals: By applying a modified MACD calculation to the smoothed difference, the indicator provides signals on shifts in market pressure. Positive values indicate upward price momentum (buying pressure), while negative values suggest downward momentum (selling pressure).

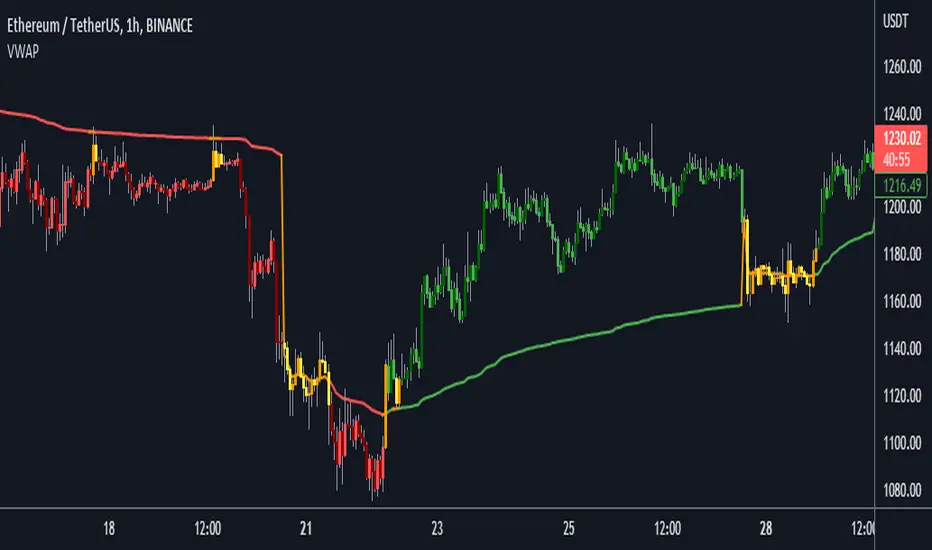
VWAP [Gu5]VWAP is primarily used by technical analysts to identify market trends.
This design is more intuitive
green: Bullish Trend
red: Bearish Trend
orange: Range
---
El VWAP lo utilizan principalmente los analistas técnicos para identificar las tendencias del mercado.
Este diseño es mas intuitivo
verde: Alsista
rojo: Bajista
naranja: Rango
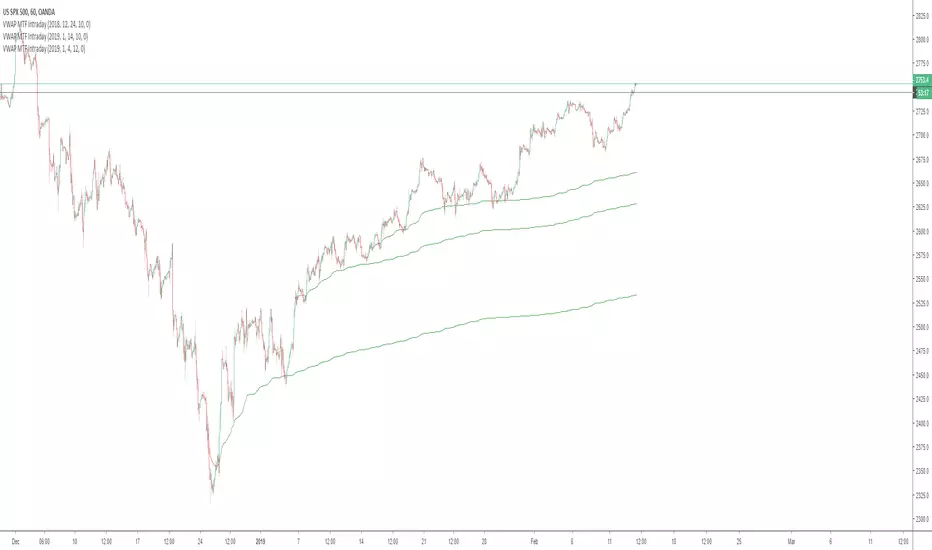
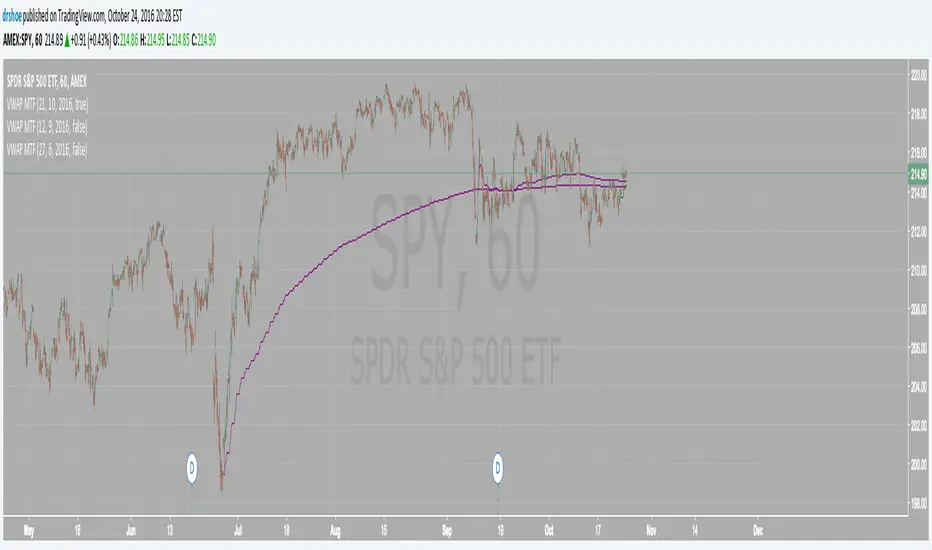
VWAP MTF Custom Dates (Multi Timeframe VWAP with Custom Dates)This is extremely useful tool for analyzing the market. Brian Shannon from alphatrends.net uses this very frequently and I've programmed it for tradingview.
you can calculate the VWAP from any dates on the chart and it works with any intraday timeframe. Simply select on the settings icon and select your day month and year parameters!
Please follow for more future updates
Happy trading!
Daniel
VWAP Reversion (Sequential Stats + Profit/Loss Points)First time posting. This is my attempt to evaluate the effectiveness of VWAP reversion. I decided to make this an indicator with its own integrated stats.
If you set the session length to lets say 100, but choose a 1 minute timeframe, it will only load as many sessions as the chart will allow for that timeframe. increasing the timeframe will allow you to go back further with more sessions.
I plan to implement more and more as I refine it. I just wanted to get my working copy out into the universe. I'd like to add some method of "scaling in". Perhaps if the price goes further and further away from the original entry, say for each additional std. deviation band further, it could add another entry signal.
My trading journey is just beginning, I've never coded before, and this was made entirely through the fusion of my attempt to communicate the ideas in my head for ChatGPT to turn into code!

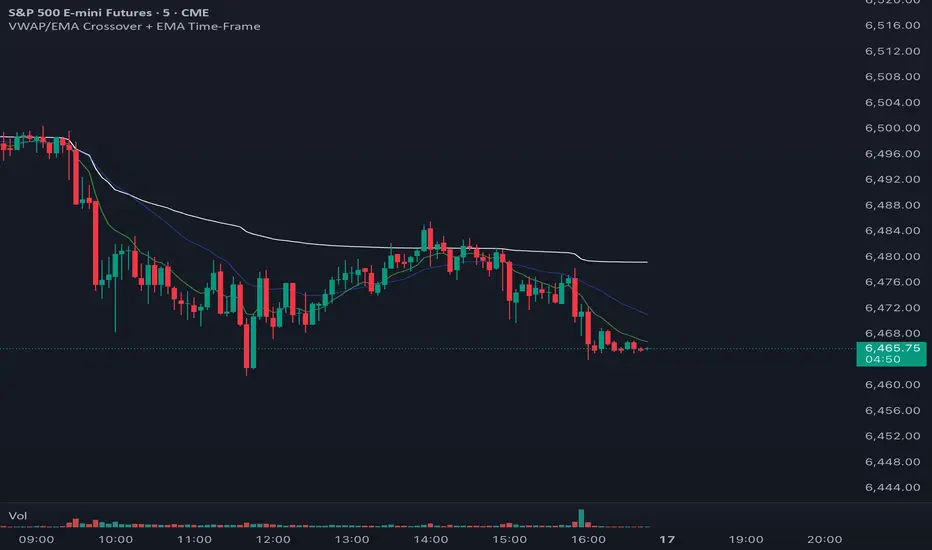
VWAP with 2 EMAs + EMA TimeFrameAs you can see the chart displays the VWAP on white and the 9 EMA on the 5 min tf on green, the blue line represents the same 9 EMA on the 15 min tf that way you can see right away without navigating between timeframes if the price is retesting, breaking, rejecting a higher timeframe, you can change the EMA values for the chart and also the timeframe for the desired extra EMA, very useful for day traders and scalpers who need to think faster. Less stressful less annoying.
Hope it works for you.
[HM] VWAP Envelope dinamic intraday v1- VWAP, volume weighted average price;
- Plus Envelope bands:
1) Dinamic, adjusted by volatility:
- - - daily ATR or
- - - daily Standard Deviation
2) or simple fixed % increments bands, defined by user.
# Intraday timeframe only.
# If volume data is absent, the indicator will not work at all.
Hope this could help the community.

VWAP/ MVWAPPlots VWAP and MVWAP for intraday trading. Useful to avoid whipsaws
Market structure is important to take any trades
Avoid taking trades close to support and resistance
VWAP + SMA + EMA3-in-one indicator, for swing and intra-day trading, which includes
Simple Moving Average (SMA)
Exponential Moving Average (EMA)
Volume-Weighted Average Price (VWAP)