JBravo Swing with GoGo JuiceThis follows Johnny Bravo Dominate Stocks strategy. When a full price bar closes above SMA 9, this indicates a buy. When the price bar closes below EMA20, this indicates a sell. If the MAs are all sloping up and aligned in order 9,20,180, then this indicates a Strong Buy. If the MAs are all sloping down and aligned in order 180,20,9, then this indicates a Strong Sell.
In addition, when VWAP crosses above the EMA20, "GoGo Long" is indicated on the chart. When VWAP crosses below the EMA20, "GoGo Short" is indicated on the chart. JBravo refers to this as the GoGo juice.
Recherche dans les scripts pour "vwap"

888 BOT #backtest█ 888 BOT #backtest (open source)
This is an Expert Advisor 'EA' or Automated trading script for ‘longs’ and ‘shorts’, which uses only a Take Profit or, in the worst case, a Stop Loss to close the trade.
It's a much improved version of the previous ‘Repanocha’. It doesn`t use 'Trailing Stop' or 'security()' functions (although using a security function doesn`t mean that the script repaints) and all signals are confirmed, therefore the script doesn`t repaint in alert mode and is accurate in backtest mode.
Apart from the previous indicators, some more and other functions have been added for Stop-Loss, re-entry and leverage.
It uses 8 indicators, (many of you already know what they are, but in case there is someone new), these are the following:
1. Jurik Moving Average
It's a moving average created by Mark Jurik for professionals which eliminates the 'lag' or delay of the signal. It's better than other moving averages like EMA , DEMA , AMA or T3.
There are two ways to decrease noise using JMA . Increasing the 'LENGTH' parameter will cause JMA to move more slowly and therefore reduce noise at the expense of adding 'lag'
The 'JMA LENGTH', 'PHASE' and 'POWER' parameters offer a way to select the optimal balance between 'lag' and over boost.
Green: Bullish , Red: Bearish .
2. Range filter
Created by Donovan Wall, its function is to filter or eliminate noise and to better determine the price trend in the short term.
First, a uniform average price range 'SAMPLING PERIOD' is calculated for the filter base and multiplied by a specific quantity 'RANGE MULTIPLIER'.
The filter is then calculated by adjusting price movements that do not exceed the specified range.
Finally, the target ranges are plotted to show the prices that will trigger the filter movement.
Green: Bullish , Red: Bearish .
3. Average Directional Index ( ADX Classic) and ( ADX Masanakamura)
It's an indicator designed by Welles Wilder to measure the strength and direction of the market trend. The price movement is strong when the ADX has a positive slope and is above a certain minimum level 'ADX THRESHOLD' and for a given period 'ADX LENGTH'.
The green color of the bars indicates that the trend is bullish and that the ADX is above the level established by the threshold.
The red color of the bars indicates that the trend is down and that the ADX is above the threshold level.
The orange color of the bars indicates that the price is not strong and will surely lateralize.
You can choose between the classic option and the one created by a certain 'Masanakamura'. The main difference between the two is that in the first it uses RMA () and in the second SMA () in its calculation.
4. Parabolic SAR
This indicator, also created by Welles Wilder, places points that help define a trend. The Parabolic SAR can follow the price above or below, the peculiarity that it offers is that when the price touches the indicator, it jumps to the other side of the price (if the Parabolic SAR was below the price it jumps up and vice versa) to a distance predetermined by the indicator. At this time the indicator continues to follow the price, reducing the distance with each candle until it is finally touched again by the price and the process starts again. This procedure explains the name of the indicator: the Parabolic SAR follows the price generating a characteristic parabolic shape, when the price touches it, stops and turns ( SAR is the acronym for 'stop and reverse'), giving rise to a new cycle. When the points are below the price, the trend is up, while the points above the price indicate a downward trend.
5. RSI with Volume
This indicator was created by LazyBear from the popular RSI .
The RSI is an oscillator-type indicator used in technical analysis and also created by Welles Wilder that shows the strength of the price by comparing individual movements up or down in successive closing prices.
LazyBear added a volume parameter that makes it more accurate to the market movement.
A good way to use RSI is by considering the 50 'RSI CENTER LINE' centerline. When the oscillator is above, the trend is bullish and when it is below, the trend is bearish .
6. Moving Average Convergence Divergence ( MACD ) and ( MAC-Z )
It was created by Gerald Appel. Subsequently, the histogram was added to anticipate the crossing of MA. Broadly speaking, we can say that the MACD is an oscillator consisting of two moving averages that rotate around the zero line. The MACD line is the difference between a short moving average 'MACD FAST MA LENGTH' and a long moving average 'MACD SLOW MA LENGTH'. It's an indicator that allows us to have a reference on the trend of the asset on which it is operating, thus generating market entry and exit signals.
We can talk about a bull market when the MACD histogram is above the zero line, along with the signal line, while we are talking about a bear market when the MACD histogram is below the zero line.
There is the option of using the MAC-Z indicator created by LazyBear, which according to its author is more effective, by using the parameter VWAP ( volume weighted average price ) 'Z-VWAP LENGTH' together with a standard deviation 'STDEV LENGTH' in its calculation.
7. Volume Condition
Volume indicates the number of participants in this war between bulls and bears, the more volume the more likely the price will move in favor of the trend. A low trading volume indicates a lower number of participants and interest in the instrument in question. Low volumes may reveal weakness behind a price movement.
With this condition, those signals whose volume is less than the volume SMA for a period 'SMA VOLUME LENGTH' multiplied by a factor 'VOLUME FACTOR' are filtered. In addition, it determines the leverage used, the more volume , the more participants, the more probability that the price will move in our favor, that is, we can use more leverage. The leverage in this script is determined by how many times the volume is above the SMA line.
The maximum leverage is 8.
8. Bollinger Bands
This indicator was created by John Bollinger and consists of three bands that are drawn superimposed on the price evolution graph.
The central band is a moving average, normally a simple moving average calculated with 20 periods is used. ('BB LENGTH' Number of periods of the moving average)
The upper band is calculated by adding the value of the simple moving average X times the standard deviation of the moving average. ('BB MULTIPLIER' Number of times the standard deviation of the moving average)
The lower band is calculated by subtracting the simple moving average X times the standard deviation of the moving average.
the band between the upper and lower bands contains, statistically, almost 90% of the possible price variations, which means that any movement of the price outside the bands has special relevance.
In practical terms, Bollinger bands behave as if they were an elastic band so that, if the price touches them, it has a high probability of bouncing.
Sometimes, after the entry order is filled, the price is returned to the opposite side. If price touch the Bollinger band in the same previous conditions, another order is filled in the same direction of the position to improve the average entry price, (% MINIMUM BETTER PRICE ': Minimum price for the re-entry to be executed and that is better than the price of the previous position in a given %) in this way we give the trade a chance that the Take Profit is executed before. The downside is that the position is doubled in size. 'ACTIVATE DIVIDE TP': Divide the size of the TP in half. More probability of the trade closing but less profit.
█ STOP LOSS and RISK MANAGEMENT.
A good risk management is what can make your equity go up or be liquidated.
The % risk is the percentage of our capital that we are willing to lose by operation. This is recommended to be between 1-5%.
% Risk: (% Stop Loss x % Equity per trade x Leverage) / 100
First the strategy is calculated with Stop Loss, then the risk per operation is determined and from there, the amount per operation is calculated and not vice versa.
In this script you can use a normal Stop Loss or one according to the ATR. Also activate the option to trigger it earlier if the risk percentage is reached. '% RISK ALLOWED'
'STOP LOSS CONFIRMED': The Stop Loss is only activated if the closing of the previous bar is in the loss limit condition. It's useful to prevent the SL from triggering when they do a ‘pump’ to sweep Stops and then return the price to the previous state.
█ BACKTEST
The objective of the Backtest is to evaluate the effectiveness of our strategy. A good Backtest is determined by some parameters such as:
- RECOVERY FACTOR: It consists of dividing the 'net profit' by the 'drawdown’. An excellent trading system has a recovery factor of 10 or more; that is, it generates 10 times more net profit than drawdown.
- PROFIT FACTOR: The ‘Profit Factor’ is another popular measure of system performance. It's as simple as dividing what win trades earn by what loser trades lose. If the strategy is profitable then by definition the 'Profit Factor' is going to be greater than 1. Strategies that are not profitable produce profit factors less than one. A good system has a profit factor of 2 or more. The good thing about the ‘Profit Factor’ is that it tells us what we are going to earn for each dollar we lose. A profit factor of 2.5 tells us that for every dollar we lose operating we will earn 2.5.
- SHARPE: (Return system - Return without risk) / Deviation of returns.
When the variations of gains and losses are very high, the deviation is very high and that leads to a very poor ‘Sharpe’ ratio. If the operations are very close to the average (little deviation) the result is a fairly high 'Sharpe' ratio. If a strategy has a 'Sharpe' ratio greater than 1 it is a good strategy. If it has a 'Sharpe' ratio greater than 2, it is excellent. If it has a ‘Sharpe’ ratio less than 1 then we don't know if it is good or bad, we have to look at other parameters.
- MATHEMATICAL EXPECTATION: (% winning trades X average profit) + (% losing trades X average loss).
To earn money with a Trading system, it is not necessary to win all the operations, what is really important is the final result of the operation. A Trading system has to have positive mathematical expectation as is the case with this script: ME = (0.87 x 30.74$) - (0.13 x 56.16$) = (26.74 - 7.30) = 19.44$ > 0
The game of roulette, for example, has negative mathematical expectation for the player, it can have positive winning streaks, but in the long term, if you continue playing you will end up losing, and casinos know this very well.
PARAMETERS
'BACKTEST DAYS': Number of days back of historical data for the calculation of the Backtest.
'ENTRY TYPE': For '% EQUITY' if you have $ 10,000 of capital and select 7.5%, for example, your entry would be $ 750 without leverage. If you select CONTRACTS for the 'BTCUSDT' pair, for example, it would be the amount in 'Bitcoins' and if you select 'CASH' it would be the amount in $ dollars.
'QUANTITY (LEVERAGE 1X)': The amount for an entry with X1 leverage according to the previous section.
'MAXIMUM LEVERAGE': It's the maximum allowed multiplier of the quantity entered in the previous section according to the volume condition.
The settings are for Bitcoin at Binance Futures (BTC: USDTPERP) in 15 minutes.
For other pairs and other timeframes, the settings have to be adjusted again. And within a month, the settings will be different because we all know the market and the trend are changing.

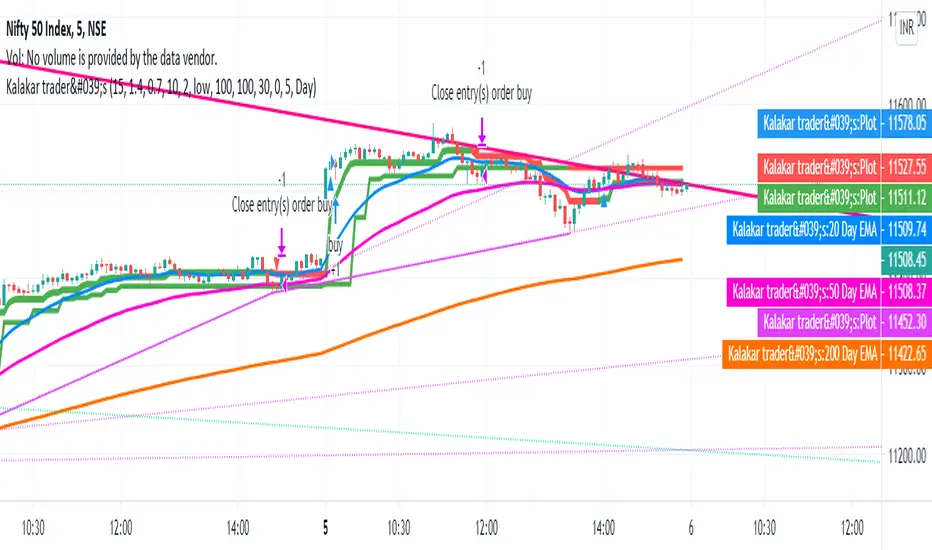
auto trend lines with buy sell signalKalakar trader's Tools is the tool where Buy and sell signals generates automatically according to the candles behavior.
It automatically made trend line
It as build in moving average also
It uses WD Gann Levels to calculate entry point with the help of VWAP .
Pivot points determines the recent support and resistance levels.
Trading rule for this indicator
This indicator is designed for Indian equity stocks
Best performance is expected on 10 minutes chart basic user can use 5 minutes chart for stock value less than 500 rupees, else 15 minutes chart
Plotted line shows the market sentiment, green for buy, red for sell and black for neutral market.
Order thumb rule
For buy signals there is a up triangle in green color
For sell signal there is a down triangle in red color
1. avoid any trade signal before 9:35 AM Indian time
2. signal and related stop loss candle must be formed in the same day
3. if order placed in 5 minutes chart then don't go for a target of 15 minutes chart
4. if order placed in 15 minutes time frame and target is too far then check the target in 5 minutes time frame
5. if signal candle touches the target then avoid the signal.
6. Money management is most important for this indicator.
7. Take trade only if it satisfy risk reward ratio.
8. It has long target but need patience.
Signal
using vwap calculates gann square of 9 levels and if any smart money activity on that level then checks the confirmation of the trend by higherhigh or lowerlow formation
Buy Entry : entry price should be on the high of the candle before signal for buy and sl on bottom of flagged candle just before signal
SellEntry : entry price should be on the low of the candle before signal for sell and sl on top of flagged candle just before signal
Please add some extra value to the Stop Loss for safe trading
Warning : Don't place any order without stop loss, This tool is made for educational and learning purpose only, take any trade at your own risk.
Gladiator USDJPY1 ) This strategy is based on VWAP.
2 ) This strategy is based on BB+.
3 ) This strategy is based on a range.
4 ) This strategy has only longs. Shorts are separate.
It buys according to a flat position 10000 JPY per order.
Maximum positions are 1000 000 JPY which is 10x leverage with an initial balance of 100 000 JPY.
Take profit scales with a recent price range during an uptrend.
During a downtrend, there is a static take profit.
Commisions are 0.02JPY per contract.
Slippage is 5 pips.

Market Surfers Signalshello guys its siple and easy indicator provide buy and sale signals but there are some rules to be followed are as below;
Plot below indicators;
1. EMA 50 Days
2. Vwap
Once there is indication of buy and price is above EMA 50 &VWAP can long from the next candle open SL will be the signal candle bottom or last swing low in 5 mint candle wise versa for SHORT /Sale.
I am improving it more and will improve further.
Enjoy.
From : Market Surfers (ASIF HUSSAIN)

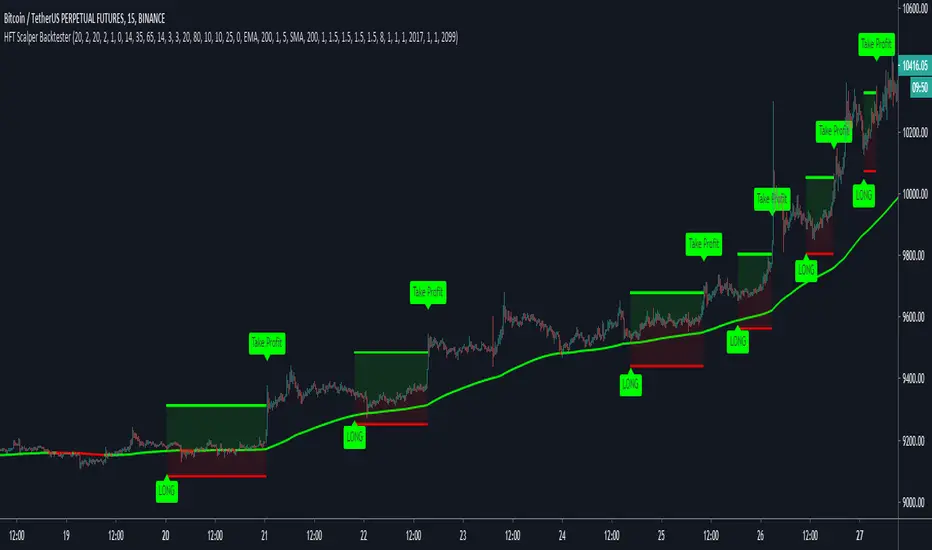
HFT Fibonacci Bands BacktesterDefault Settings are meant to be used in XBT/USD chart on 15 min time frame. If you want to use for another asset on another time frame YOU MUST CHANGE THE SETTINGS
This is a Fibonacci bands based trading strategy developed by HFT Research. It is a highly customizable strategy and provides endless opportunities to find profitable trades in the market.
Use Fib BB
This is the main decision maker of the strategy. Tuning the settings of this portion of the strategy will change the outcome the most. We have provided default settings. However, they are only good for 15min chart on Bitcoin . Please adjust accordingly.
Fib BB Length: This setting adjusts the middle line of your Fibonacci Bands. It is the moving average that you take it as base for your Fibonacci bands. Default value is currently 20.
Fib Level to Use for Entry: Here, you adjust which one of the Fibonacci Ratio levels you would like to use for your entry. You can only choose one of the following options.
Fibonacci Ratio 1
This is your Fib ratio level 1 and you can put any number here you would like
Fibonacci Ratio 2
This is your Fib ratio level 2 and you can put any number here you would like
Fibonacci Ratio 3
This is your Fib ratio level 3 and you can put any number here you would like
Please keep in mind that Ratio 1 should be higher than Ratio 2 and Ratio 2 should be higher than Ratio 3.
Use RSI
You can also turn on and off the RSI as well. Alternatively, there is an option to use RSI on a different time frame than you are currently on. For example, if you are looking at the 5min chart to use Bollinger bands but you would like to look at the RSI value on the 15min chart. You can do so by selecting the custom RSI timeframe as well as adjusting the Oversold and Overbought value.
Use CCI
Commodity Channel Index is an indicator developed by Donald Lambert. It is a momentum-based oscillator used to help determine when an investment vehicle is reaching conditions of being overbought or oversold. It also used to asses price trend direction and strength. Default settings are usually the safest and the best fit.
Use VWAP
VWAP stands for volume weighted average price . It is an extremely useful indicator when trading intra-day. It does reset every trading session which is at 00:00 UTC . Instead of looking at x number of candles and providing an average price, it will take into consideration volume that’s traded at a certain price and weigh it accordingly.
Use ADX
ADX stands for average directional index . It is an indicator that measures volatility in the market. Unfortunately, the worst market condition for this strategy is sideways market. ADX becomes a useful tool since it can detect trend. If the volatility is low and there is no real price movement, ADX will pick that up and will not let you get in trades during a sideways market. It will allow you to enter trades only when the market is trending.
Use MA Filters
Lookback: It is an option to look back x number of candles to validate the price crossing. If the market is choppy and the price keeps crossing up and down the moving average you have chosen, it will generate a lot of “noisy” signals. This option allows you to confirm the cross by selecting how many candles the price needs to stay above or below the moving average. Setting it 0 will turn it off.
MA Filter Type: There is a selection of moving averages that is available on TradingView currently. You can choose from 14 different moving average types to detect the trend as accurate as possible.
Filter Length: You can select the length of your moving average. Most commonly used length being 50,100 and 200.
Filter Type: This is our propriety smoothing method in order to make the moving averages lag less and influence the way they are calculated slightly. Type 1 being the normal calculation and type 2 being the secret sauce
Reverse MA Filter: This option allows you to use the moving average in reverse. For example, the strategy will go long when the price is above the moving average. However, if you use the reserve MA Filter, you will go short when the price is above the moving average. This method works best in sideways market where price usually retraces back to the moving average. So, in an anticipation of price reverting back to the moving average, it is a useful piece of option to use during sideway markets.
The backtester assumes the following;
- 1000$ capital
- 0.06% commission based on binance
- 1% risk meaning 100% equity on cross leverage
- Backtest results are starting from 2020
If you want to get access to this indicator please DM me or visit our website.

HFT Scalper BacktesterThis strategy is a scalper strategy developed by HFT Research. Scalper is highly customizable and provides endless opportunities to find profitable setups in the market.
Use Bollinger Bands
This piece of the settings will turn and off Bollinger band’s input in the decision making. BB Length will determine the Moving average you are using to take the standard deviation off of which is named as BB Multiplier. Default settings will use 20 moving average and take standard deviation of 2 to create lower and upper bands. Increasing the Multiplier will give you fewer but safer entries.
Use Bollinger Bands %
This setting will allow the user to determine at what Bollinger band width %, he wants to take start looking to take trades. It is known that when prices are stable and moving sideways, Bollinger bands contract and it becomes more reactive to small moves in the market. Using this setting, you can ignore the signals that would be generated while Bollinger bands are contracted. This setting will allow the user to weed out the noise in the market and really allow them to make the most out of Bollinger bands .
Use RSI
You can also turn on and off the RSI as well. Alternatively, there is an option to use RSI on a different time frame than you are currently on. For example, if you are looking at the 5min chart to use Bollinger bands but you would like to look at the RSI value on the 15min chart. You can do so by selecting the custom RSI timeframe as well as adjusting the Oversold and Overbought value.
Use STOCH
For those who want extra protection on their entry can throw STOCH into their decision making. STOCH acts like RSI but it is more prone to small moves. It will help the users to get a better entry if used correctly. Stoch may not be in the buy zone when RSI is at say 35, however, if price dips a little more and STOCH might be in the buy zone when RSI is at say 20. This way it will help you have better entries than just using RSI . In a way, you can use STOCH to scalp RSI .
Use VWAP
VWAP stands for volume weighted average price . It is an extremely useful indicator when trading intra-day. It does reset every trading session which is at 00:00 UTC . Instead of looking at x number of candles and providing an average price, it will take into consideration volume that’s traded at a certain price and weigh it accordingly.
Use ADX
ADX stands for average directional index . It is an indicator that measures volatility in the market. Unfortunately, the worst market condition for this strategy is sideways market. ADX becomes a useful tool since it can detect trend. If the volatility is low and there is no real price movement, ADX will pick that up and will not let you get in trades during a sideways market. It will allow you to enter trades only when the market is trending.
Use MA Filters
Lookback: It is an option to look back x number of candles to validate the price crossing. If the market is choppy and the price keeps crossing up and down the moving average you have chosen, it will generate a lot of “noisy” signals. This option allows you to confirm the cross by selecting how many candles the price needs to stay above or below the moving average. Setting it 0 will turn it off.
MA Filter Type: There is a selection of moving averages that is available on TradingView currently. You can choose from 14 different moving average types to detect the trend as accurate as possible.
Filter Length: You can select the length of your moving average. Most commonly used length being 50,100 and 200.
Filter Type: This is our propriety smoothing method in order to make the moving averages lag less and influence the way they are calculated slightly. Type 1 being the normal calculation and type 2 being the secret sauce .
Reverse MA Filter: This option allows you to use the moving average in reverse. For example, the strategy will go long when the price is above the moving average. However, if you use the reserve MA Filter, you will go short when the price is above the moving average. This method works best in sideways market where price usually retraces back to the moving average. So in an anticipation of price reverting back to the moving average, it is a useful piece of option to use during sideway markets which is the worst market condition for scalper.
Please visit our website for more information
Directional Momentum Flux StrategyDirectional Momentum Flux (DMF) is a compound indicator designed to surface signals of projected change in directional momentum. The primary goal is to identify possible momentum inflection points and signal them before they happen, which is reached by applying a set of well-known high-level indicators (e.g. DEMA, RSIs, CCIs and VWAP), lower-level indicators (e.g. BOP, PPO and RMOMO), and some special sauce brewed in-house by yours truly.
This strategy is invite-only. Invitations are offered for a one-time fee of $250 payable in several cryptocurrencies (ETH, BTC, DASH, XMR or ZEC). Once you've got an invitation, you will automatically receive updates forever*.
DMF was designed to work across multiple asset classes. Extensive backtesting has been performed over multiple sample series (not just during the bull runs, for example) and against a randomized pool of assets. But don't take my word for it, I've included some time-based backtesting support tools to make it easy-peasy for you to validate the results yourself!
Under the hood, DMF is powered by numerous indicators, including:
✓ Double EMA & Composite SMA;
✓ Double RSI (fast & slow, variable);
✓ Composite StochRSI & VWAP (StochRSI+, two series);
✓ Composite Commodity Channel Index (CCI+, two series);
✓ Volume-Weighted Balance of Power (BOP itself was adapted from BOP_LB, kudos to LazyBear);
✓ Percentage Price Oscillator (PPO, split, two series);
✓ Range-adjusted Momentum Oscillator (RMOMO, my fancy MOM variant);
It crunches all that data and generates signals which are issued in two ways:
✓ Vertical Bands (or VBs) - Entry/Exit windows as vertical bands that remain "lit" (e.g. the background of a series of candles is semi-opaque white) while the top-level signals are showing sufficiently strong BUY signals. These windows are the primary entry/exit targets and can be relied upon with sufficient risk mitigation (e.g. a reasonable stop-loss or other scale-out exit mechanism). A VB followed immediately by an egg is as good as gold.
✓ Eggs - Entry/Exit validation signals that confirm the condition indicated by VBs. A lit VB without an egg in the same or next candle session is considered to be valid , but not safe (see above warning). Waiting for an egg can improve performance at the risk of missing the best possible entry point. Consider your risk tolerance and act accordingly.
Basic Instructions:
✓ Configure The Settings! The defaults are pretty good, but don't be scared to try variations. For example, by default SHORT positions are disabled. You might want to enable them if your risk tolerance allows them. (IMO there's gold on both ends of the rainbow. 🌈)
✓ Pay attention to the VBs. If you see a lit band being placed in an otherwise dark area, it's a projected inflection point. This is expected to be validated and confirmed in the same or immediately following period with an egg. You can enter a LONG position at this time.
✓ Pay attention to the eggs. If you see an egg, it's a confirmation that the VB changes in the same or immediately preceding candle period is valid. If you did not enter or exit your position at the point of the VB shift, now is the time to do so.
✓ Watch for the end of a VB period and be prepared to exit your position quickly as the next egg may be accompanied by a large directional momentum inflection.
Things to Note:
📉 - DMF is designed for day trading with aggressive position TTLs (15m was the upper bound during development and strategy testing). It appears to issue valid signals for other intervals, but it was not designed for >15m and YMMV. Don't go manually opening a LONG with no exit strategy and go to sleep... it probably won't work out to your benefit. You should be prepared to exit positions at any time. (Pro tip: automation is your friend!)
💸 - DMF indicator is not free from risk. As with all investment strategies, it is crucial to exercise caution and only trade with funds you are comfortable losing. DMF does not offer any form of guarantee or warranty, implied or otherwise. If you lose money, your house, your 401K... that's on you. (Pro tip: don't risk anything you're not ready to lose, because losses are part of the game and you WILL have them.)
🤔 - By using this indicator, you understand that any and all risks are the sole and complete responsibility of the end user (yeah, that's you). Don't use it if you're not 100% clear that you know exactly what you're doing. (Pro tip: always ask questions if you're feeling confused.)
⏱ - * Forever in this context means that, where room for improvement exists, I will improve it over time and you'll get all updates until I stop making them. (Pro tip: nobody lives forever.)

Quantum Flux Universal Strategy Summary in one paragraph
Quantum Flux Universal is a regime switching strategy for stocks, ETFs, index futures, major FX pairs, and liquid crypto on intraday and swing timeframes. It helps you act only when the normalized core signal and its guide agree on direction. It is original because the engine fuses three adaptive drivers into the smoothing gains itself. Directional intensity is measured with binary entropy, path efficiency shapes trend quality, and a volatility squash preserves contrast. Add it to a clean chart, watch the polarity lane and background, and trade from positive or negative alignment. For conservative workflows use on bar close in the alert settings when you add alerts in a later version.
Scope and intent
• Markets. Large cap equities and ETFs. Index futures. Major FX pairs. Liquid crypto
• Timeframes. One minute to daily
• Default demo used in the publication. QQQ on one hour
• Purpose. Provide a robust and portable way to detect when momentum and confirmation align, while dampening chop and preserving turns
• Limits. This is a strategy. Orders are simulated on standard candles only
Originality and usefulness
• Unique concept or fusion. The novelty sits in the gain map. Instead of gating separate indicators, the model mixes three drivers into the adaptive gains that power two one pole filters. Directional entropy measures how one sided recent movement has been. Kaufman style path efficiency scores how direct the path has been. A volatility squash stabilizes step size. The drivers are blended into the gains with visible inputs for strength, windows, and clamps.
• What failure mode it addresses. False starts in chop and whipsaw after fast spikes. Efficiency and the squash reduce over reaction in noise.
• Testability. Every component has an input. You can lengthen or shorten each window and change the normalization mode. The polarity plot and background provide a direct readout of state.
• Portable yardstick. The core is normalized with three options. Z score, percent rank mapped to a symmetric range, and MAD based Z score. Clamp bounds define the effective unit so context transfers across symbols.
Method overview in plain language
The strategy computes two smoothed tracks from the chart price source. The fast track and the slow track use gains that are not fixed. Each gain is modulated by three drivers. A driver for directional intensity, a driver for path efficiency, and a driver for volatility. The difference between the fast and the slow tracks forms the raw flux. A small phase assist reduces lag by subtracting a portion of the delayed value. The flux is then normalized. A guide line is an EMA of a small lead on the flux. When the flux and its guide are both above zero, the polarity is positive. When both are below zero, the polarity is negative. Polarity changes create the trade direction.
Base measures
• Return basis. The step is the change in the chosen price source. Its absolute value feeds the volatility estimate. Mean absolute step over the window gives a stable scale.
• Efficiency basis. The ratio of net move to the sum of absolute step over the window gives a value between zero and one. High values mean trend quality. Low values mean chop.
• Intensity basis. The fraction of up moves over the window plugs into binary entropy. Intensity is one minus entropy, which maps to zero in uncertainty and one in very one sided moves.
Components
• Directional Intensity. Measures how one sided recent bars have been. Smoothed with RMA. More intensity increases the gain and makes the fast and slow tracks react sooner.
• Path Efficiency. Measures the straightness of the price path. A gamma input shapes the curve so you can make trend quality count more or less. Higher efficiency lifts the gain in clean trends.
• Volatility Squash. Normalizes the absolute step with Z score then pushes it through an arctangent squash. This caps the effect of spikes so they do not dominate the response.
• Normalizer. Three modes. Z score for familiar units, percent rank for a robust monotone map to a symmetric range, and MAD based Z for outlier resistance.
• Guide Line. EMA of the flux with a small lead term that counteracts lag without heavy overshoot.
Fusion rule
• Weighted sum of the three drivers with fixed weights visible in the code comments. Intensity has fifty percent weight. Efficiency thirty percent. Volatility twenty percent.
• The blend power input scales the driver mix. Zero means fixed spans. One means full driver control.
• Minimum and maximum gain clamps bound the adaptive gain. This protects stability in quiet or violent regimes.
Signal rule
• Long suggestion appears when flux and guide are both above zero. That sets polarity to plus one.
• Short suggestion appears when flux and guide are both below zero. That sets polarity to minus one.
• When polarity flips from plus to minus, the strategy closes any long and enters a short.
• When flux crosses above the guide, the strategy closes any short.
What you will see on the chart
• White polarity plot around the zero line
• A dotted reference line at zero named Zen
• Green background tint for positive polarity and red background tint for negative polarity
• Strategy long and short markers placed by the TradingView engine at entry and at close conditions
• No table in this version to keep the visual clean and portable
Inputs with guidance
Setup
• Price source. Default ohlc4. Stable for noisy symbols.
• Fast span. Typical range 6 to 24. Raising it slows the fast track and can reduce churn. Lowering it makes entries more reactive.
• Slow span. Typical range 20 to 60. Raising it lengthens the baseline horizon. Lowering it brings the slow track closer to price.
Logic
• Guide span. Typical range 4 to 12. A small guide smooths without eating turns.
• Blend power. Typical range 0.25 to 0.85. Raising it lets the drivers modulate gains more. Lowering it pushes behavior toward fixed EMA style smoothing.
• Vol window. Typical range 20 to 80. Larger values calm the volatility driver. Smaller values adapt faster in intraday work.
• Efficiency window. Typical range 10 to 60. Larger values focus on smoother trends. Smaller values react faster but accept more noise.
• Efficiency gamma. Typical range 0.8 to 2.0. Above one increases contrast between clean trends and chop. Below one flattens the curve.
• Min alpha multiplier. Typical range 0.30 to 0.80. Lower values increase smoothing when the mix is weak.
• Max alpha multiplier. Typical range 1.2 to 3.0. Higher values shorten smoothing when the mix is strong.
• Normalization window. Typical range 100 to 300. Larger values reduce drift in the baseline.
• Normalization mode. Z score, percent rank, or MAD Z. Use MAD Z for outlier heavy symbols.
• Clamp level. Typical range 2.0 to 4.0. Lower clamps reduce the influence of extreme runs.
Filters
• Efficiency filter is implicit in the gain map. Raising efficiency gamma and the efficiency window increases the preference for clean trends.
• Micro versus macro relation is handled by the fast and slow spans. Increase separation for swing, reduce for scalping.
• Location filter is not included in v1.0. If you need distance gates from a reference such as VWAP or a moving mean, add them before publication of a new version.
Alerts
• This version does not include alertcondition lines to keep the core minimal. If you prefer alerts, add names Long Polarity Up, Short Polarity Down, Exit Short on Flux Cross Up in a later version and select on bar close for conservative workflows.
Strategy has been currently adapted for the QQQ asset with 30/60min timeframe.
For other assets may require new optimization
Properties visible in this publication
• Initial capital 25000
• Base currency Default
• Default order size method percent of equity with value 5
• Pyramiding 1
• Commission 0.05 percent
• Slippage 10 ticks
• Process orders on close ON
• Bar magnifier ON
• Recalculate after order is filled OFF
• Calc on every tick OFF
Honest limitations and failure modes
• Past results do not guarantee future outcomes
• Economic releases, circuit breakers, and thin books can break the assumptions behind intensity and efficiency
• Gap heavy symbols may benefit from the MAD Z normalization
• Very quiet regimes can reduce signal contrast. Use longer windows or higher guide span to stabilize context
• Session time is the exchange time of the chart
• If both stop and target can be hit in one bar, tie handling would matter. This strategy has no fixed stops or targets. It uses polarity flips for exits. If you add stops later, declare the preference
Open source reuse and credits
• None beyond public domain building blocks and Pine built ins such as EMA, SMA, standard deviation, RMA, and percent rank
• Method and fusion are original in construction and disclosure
Legal
Education and research only. Not investment advice. You are responsible for your decisions. Test on historical data and in simulation before any live use. Use realistic costs.
Strategy add on block
Strategy notice
Orders are simulated by the TradingView engine on standard candles. No request.security() calls are used.
Entries and exits
• Entry logic. Enter long when both the normalized flux and its guide line are above zero. Enter short when both are below zero
• Exit logic. When polarity flips from plus to minus, close any long and open a short. When the flux crosses above the guide line, close any short
• Risk model. No initial stop or target in v1.0. The model is a regime flipper. You can add a stop or trail in later versions if needed
• Tie handling. Not applicable in this version because there are no fixed stops or targets
Position sizing
• Percent of equity in the Properties panel. Five percent is the default for examples. Risk per trade should not exceed five to ten percent of equity. One to two percent is a common choice
Properties used on the published chart
• Initial capital 25000
• Base currency Default
• Default order size percent of equity with value 5
• Pyramiding 1
• Commission 0.05 percent
• Slippage 10 ticks
• Process orders on close ON
• Bar magnifier ON
• Recalculate after order is filled OFF
• Calc on every tick OFF
Dataset and sample size
• Test window Jan 2, 2014 to Oct 16, 2025 on QQQ one hour
• Trade count in sample 324 on the example chart
Release notes template for future updates
Version 1.1.
• Add alertcondition lines for long, short, and exit short
• Add optional table with component readouts
• Add optional stop model with a distance unit expressed as ATR or a percent of price
Notes. Backward compatibility Yes. Inputs migrated Yes.

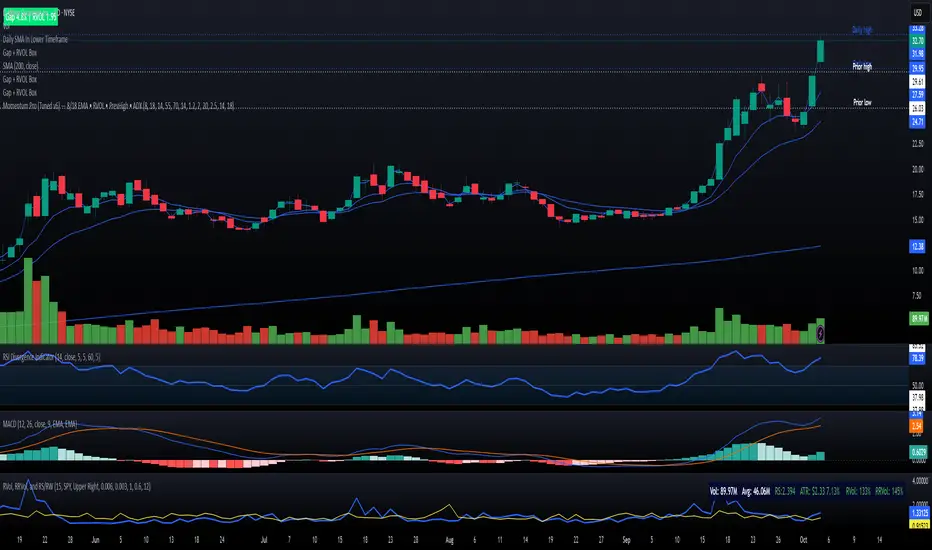
Momentum Pro (Tuned v6) — 8/18 EMA • RVOL • PrevHigh • ADXMomentum strategy with signals (VWAP + 9/20 EMA alignment, MACD hist > 0, RSI 55–70, RVOL filter, ATR stop, 2R target
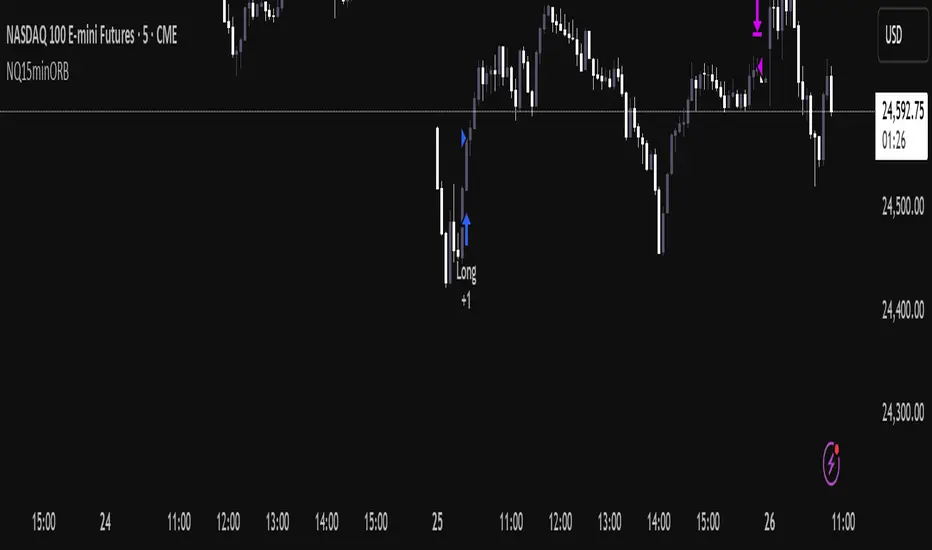
NQ Opening Range BreakoutOpening Range Breakout script with:
Customizable opening range timeframe selection.
Inputs for Risk to Reward ratio, EMAs, Vwap, and ATR sizing to avoid ranges that are too big or too small.
Features a toggle for reversal trades that when enabled will trade the other direction if the initial ORB gets stopped out.
Default it will use the entire opening range to determine stop loss and take profit and if neither the take profit or stop loss is hit it will end the trade at 16:00. There are toggles to use half the opening range as the stop loss and take profit will then be calculated as risk reward ratio * stop loss or you can select entry candle stop loss and risk reward ratio which places the stop loss at the entry candles opening price. There is also a take profit option that will only exit the trade when price closes below (for longs) or above (for shorts) a customizable ema length.
Note that if you have the opening range, for example, selected as 9:30 - 9:45 and are on a 5 minute chart it will enter on the first 5 min closure outside of that range and if you are on a 15 minute chart it will enter on the first 15 min closure outside of that range and so on.
You can automate the entries and exits by using a webhook service and using the strategy’s alerts.
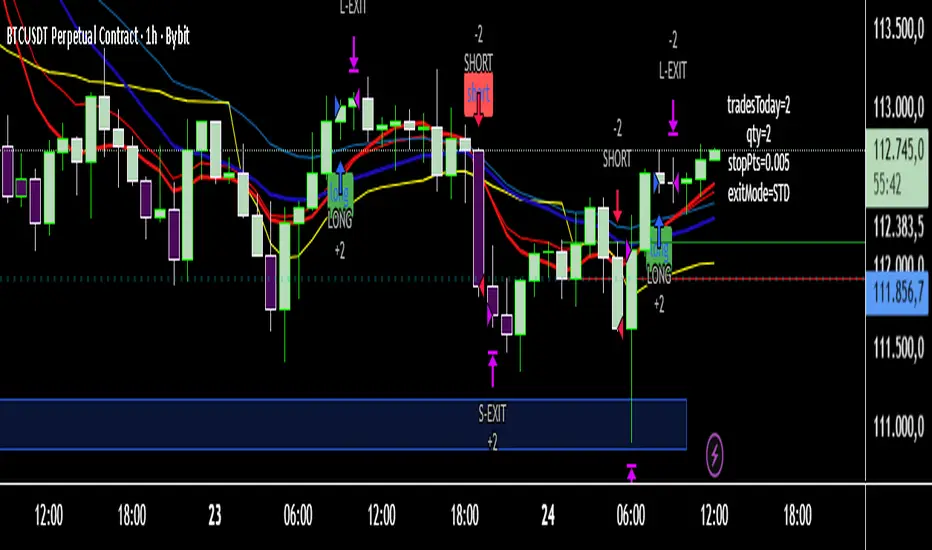
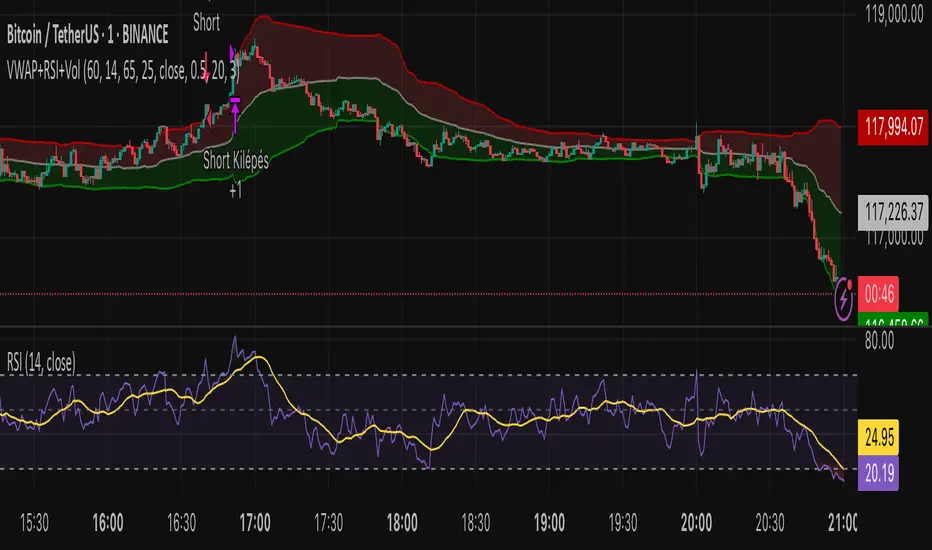
[Stratégia] VWAP Mean Magnet v9 (Simple Alert)This strategy is specifically designed for a ranging (sideways-moving) Bitcoin market.
A trade is only opened and signaled on the chart if all three of the following conditions are met simultaneously at the close of a candle:
Zone Entry
The price must cross into the signal zone: the red band for a Short (sell) position, or the green band for a Long (buy) position.
RSI Confirmation
The RSI indicator must also confirm the signal. For a Short, it must go above 65 (overbought condition). For a Long, it must fall below 25 (oversold condition).
Volume Filter
The volume on the entry candle cannot be excessively high. This safety filter is designed to prevent trades during risky, high-momentum breakouts.

Estrategia VWAP + RSI + SuperTrend (15m) con AlertasEstrategia para trading de Futuros en temporalidad de 15 minutos

Matrix Trading Strategy**Matrix Trading Strategy** is a multi-signal framework designed to identify and exploit intraday trends with controlled precision. It combines three independent entry engines—Opening Range Breakout (ORB), Ultimate Trend via ATR trailing, and a moving average crossover (MA Cross)—which can operate alone or in any combination, offering traders maximum flexibility.
Risk management is fully parameterizable: position sizing by percent of equity, fixed cash amount, or fixed quantity; SL/TP in pips aligned to the instrument’s tick size (`pipSize`); automatic break-even; ATR-based trailing stop (with an option to anchor to the UT line itself); and configurable partial exits (TP1/TP2). Daily trade limits, entry cooldowns, and forced end-of-session liquidation enforce strict discipline.
Visually, the script plots EMAs, a 1-minute VWAP, ORB levels, the UT trailing line, and signal markers, and it colors candles by RSI for rapid momentum assessment. Ready-to-use alerts for ORB, UT, and MA signals support seamless automation via webhooks.
All together, Matrix Trading is a modular framework that adapts effortlessly to cryptocurrencies, metals, or global indices, delivering realistic executions and transparent metrics in both backtests and live trading.
[Stratégia] VWAP Mean Magnet v2 (VolSzűrő)Ez a stratégia BTC- oldalazó időszakára van kifejlestve 1 perces chartra.
Momentum Pull Back Stratergy"Master Pull Back Strategy" is a highly detailed momentum and volume-based trading system designed for Trading View. It visually annotates the chart, detects buy/sell signals, tracks market phases, and evaluates retracements and confirmations. Below is a full breakdown of its logic and components:
🔷 1. Volume Profile Highlights (Arrow Emojis)
Purpose: Show volume strength vs. average using color-coded arrows.
Calculates average volume over a user-defined period (length = 10).
Divides current volume by average volume to get volRatio.
Based on volRatio, plots small arrows (acting like diamonds) in various colors:
Low volume (black, navy, blue...) to high volume (yellow, red, purple).
Visual Purpose: Give a quick sense of how "loud" or "quiet" a candle's volume is.
📈 2. Highs of Day Tracking
Purpose: Track the high price reached during different trading sessions.
Defines pre-market, regular, and post-market sessions.
Tracks the highest price (high) in each session.
Plots colored lines:
Orange: Pre-market high
Red: Regular market high
Blue: Post-market high
🟩 3. Green Candle Pattern Detection
Purpose: Detect bullish patterns formed by consecutive green candles.
Key Conditions:
Count green candles (greenCount) until a red candle appears or 10 candles max.
Require at least 1 silver-or-above volume candle (volRatio >= 1.0).
Must have ≥3% price gain during the green sequence.
Must accumulate >20,000 volume during the green run.
If Valid:
Locks the pattern.
Records important values:
patternStartPrice, patternEndPrice, totalPatternVolume, patternHigh, patternBars
Marks the bar after which red starts (redStartBar)
⬇️ 4. Retracement Monitoring
Purpose: Track retracement from the pattern high after it locks.
Defines retracement percentage:
(greenPatternHigh - low) / (greenPatternHigh - greenPatternLow)
If retracement exceeds 80%, it invalidates the pattern.
Buy signal is disabled if pattern retraces too far.
✅ 5. Buy Signal Logic
Purpose: Fire a buy signal after pattern lock if price breaks above local high.
Conditions:
Pattern is locked (patternLocked).
Price breaks above a short-term high (triggerBreak).
It's not the first red candle.
Price is within 8.5% above EMA9.
Buy signal fires and:
Sets buyActive = true
Tracks highest price after buy
Stores buyPrice = close
❌ 6. Sell Signal Logic
Purpose: Exit signal after retracement from post-buy high.
While buy is active:
If price retraces ≥3% from the post-buy high → sellSignal = true
Resets buyActive, trackedHigh, and buyPrice
Plots a red "SELL" label above the bar.
🎨 7. Buy Signal Visual Color Coding
Purpose: Color buy signal based on how deep the retracement is.
Uses retracement percentage:
≥65% → Red (high risk)
45–65% + MACD bullish → Yellow (moderate)
<45% + MACD bullish → Green (ideal)
Plots BUY label below bar in the respective color.
🔻 8. Retracement Triangle Visuals
Purpose: Shows retracement progression while pattern is locked.
If pattern is locked and not ready for buy:
Plots triangle below bar in the buyColor for visual tracking.
⭐ 9. Star Markers Above Lock Candle
Purpose: Confirmations when pattern locks.
First Star:
Plotted above the first red candle after green pattern lock.
Second Star (⭐⭐):
Additional confirmations:
Volume OK (less than previous)
MACD bullish
Price > VWAP
VolAtLock > 100K
Price up >6% from first green candle
Price below 75% of daily EMA200 or above EMA200
Third Star (⭐⭐⭐):
Even stricter confirmations:
Volume < 60% of previous
High <= previous high
VolAtLock > 500K
Price > $3
Gain >9% from first green
Price < 50% of daily EMA200 or above EMA200
📊 10. Bar Coloring
Purpose: Visually highlight bars based on pattern phase and MACD.
Gray: MACD Bearish
Light Green: Part of active green pattern
Blue: In locked phase but no buy triggered
🔄 11. Reset Logic
Purpose: Clears all tracking variables once a buy signal fires or pattern is invalidated.
Also resets if:
Retracement is too deep
10 candles pass post-lock without a trigger
⛰️ 12. Double Top Detection
Purpose: Basic visual marker when current high == previous high.
Plots a gray triangle if current and previous bar highs match.
📌 Summary: What This Strategy Shows
Buy Opportunities: Based on high-volume green runs and confirmed breakouts.
Sell Triggers: Once a retracement from peak exceeds 3%.
Visuals for Confirmation:
Diamonds for volume
Stars for lock confidence
Colors for retracement strength
Risk Management:
Retracement filtering
Time limits on locked phases
Volume filters
Market Context: Tracks pre/regular/post market highs and daily EMA 200.

External Signals Strategy Tester v5External Signals Strategy Tester v5 – User Guide (English)
1. Purpose
This Pine Script strategy is a universal back‑tester that lets you plug in any external buy/sell series (for example, another indicator, webhook feed, or higher‑time‑frame condition) and evaluate a rich set of money‑management rules around it – with a single click on/off workflow for every module.
2. Core Workflow
Feed signals
Buy Signal / Sell Signal inputs accept any series (price, boolean, output of request.security(), etc.).
A crossover above 0 is treated as “signal fired”.
Date filter
Start Date / End Date restricts the test window so you can exclude unwanted history.
Trade engine
Optional Long / Short enable toggles.
Choose whether opposite signals simply close the trade or reverse it (flip direction in one transaction).
Risk modules – all opt‑in via check‑boxes
Classic % block – fixed % Take‑Profit / Stop‑Loss / Break‑Even.
Fibonacci Bollinger Bands (FBB) module
Draws dynamic VWMA/HMA/SMA/EMA/DEMA/TEMA mid‑line with ATR‑scaled Fibonacci envelopes.
Every line can be used for stops, trailing, or multi‑target exits.
Separate LONG and SHORT sub‑modules
Each has its own SL plus three Take‑Profits (TP1‑TP3).
Per TP you set line, position‑percentage to close, and an optional trailing flag.
Executed TP/SLs deactivate themselves so they cannot refire.
Trailing behaviour
If Trail is checked, the selected line is re‑evaluated once per bar; the order is amended via strategy.exit().
3. Inputs Overview
Group Parameter Notes
Trade Settings Enable Long / Enable Short Master switches
Close on Opposite / Reverse Position How to react to a counter‑signal
Risk % Use TP / SL / BE + their % Traditional fixed‑distance management
Fibo Bands FIBO LEVELS ENABLE + visual style/length Turn indicator overlay on/off
FBB LONG SL / TP1‑TP3 Enable, Line, %, Trail Rules applied only while a long is open
FBB SHORT SL / TP1‑TP3 Enable, Line, %, Trail Rules applied only while a short is open
Line choices: Basis, 0.236, 0.382, 0.5, 0.618, 0.764, 1.0 – long rules use lower bands, short rules use upper bands automatically.
4. Algorithm Details
Position open
On the very first bar after entry, the script checks the direction and activates the corresponding LONG or SHORT module, deactivating the other.
Order management loop (every bar)
FBB Stop‑Loss: placed/updated at chosen band; if trailing, follows the new value.
TP1‑TP3: each active target updates its limit price to the selected band (or holds static if trailing is off).
The classic % block runs in parallel; its exits have priority because they call strategy.close_all().
Exit handling
When any strategy.exit() fires, the script reads exit_id and flips the *_Active flag so that order will not be recreated.
A Stop‑Loss (SL) also disables all remaining TPs for that leg.
5. Typical Use Cases
Scenario Suggested Setup
Scalping longs into VWAP‐reversion Enable LONG TP1 @ 0.382 (30 %), TP2 @ 0.618 (40 %), SL @ 0.236 + trailing
Fade shorts during news spikes Enable SHORT SL @ 1.0 (no trail) and SHORT TP1,2,3 on consecutive lowers with small size‑outs
Classic trend‑follow Use only classic % TP/SL block and disable FBB modules
6. Hints & Tips
Signal quality matters – this script manages exits, it does not generate entries.
Keep TV time zone in mind when picking start/end dates.
For portfolio‑style testing allocate smaller default_qty_value than 100 % or use strategy.percent_of_equity sizing.
You can combine FBB exits with fixed‑% ones for layered management.
7. Limitations / Safety
No pyramiding; the script holds max one position at a time.
All calculations are bar‑close; intra‑bar touches may differ from real‑time execution.
The indicator overlay is optional, so you can run visual‑clean tests by unchecking FIBO LEVELS ENABLE.

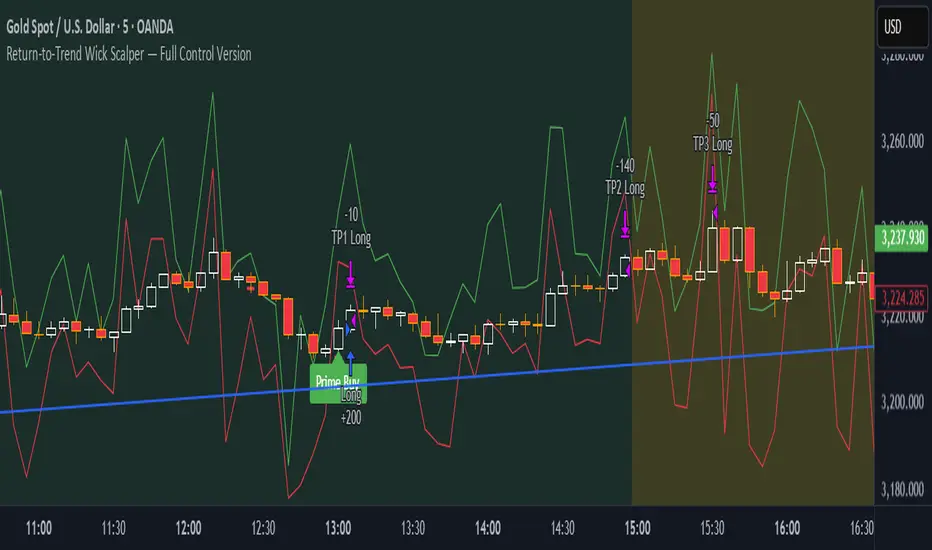
Return-to-Trend Wick Scalper — Full Control VersionReturn-to-Trend Wick Scalper — Modular Scalping Strategy for Gold (XAUUSD) & Indices
This is a precision-engineered scalping strategy designed primarily for high-volatility instruments such as Gold (XAUUSD), NASDAQ, and indices.
The system focuses on counter-trend pullbacks within the dominant daily trend, utilizing wick-based liquidity grabs (commonly referred to as “John Wick” candles) to identify high-probability return-to-trend opportunities.
Key Features:
✅ Dynamic Wick Reversal Detection: Detects reversal setups based on wick dominance and body ratio.
✅ Multiple Take Profit Levels: TP1, TP2, TP3 with individual enable/disable toggles and adjustable exit percentages.
✅ Time-Based Stop-Loss: Optional failsafe to close trades after exceeding a defined number of bars.
✅ VWAP Proximity Filter: Ensures entries happen near volume-weighted average price for precision.
✅ Pullback Depth Control: Filter for significant pullbacks using percentage of daily ATR.
✅ Dynamic Support & Resistance Validation: Confirms setups at key reactive levels.
✅ Volatility Filter: Avoids entries in overly volatile or dead market conditions.
✅ Aggressive Entry Mode: Optional early entry at pullback zones for faster fills.
✅ Paper Trading & Backtest Ready: Fully compatible with TradingView’s Paper Trading simulator.
Usage Notes:
Optimized for 5-minute chart entries.
Use in conjunction with Paper Trading for forward testing before live execution.
Can be connected to live brokers via alert webhooks and external bridges like PineConnector.
Instrument Focus:
Gold (XAUUSD) ✅
NASDAQ ✅
Dow Jones (US30) ✅
Other liquid indices ✅
Risk Note:
Always test thoroughly in Paper Trading before going live.
Optimize TP levels and filters according to market volatility conditions.
Designed for traders who want precision entries, flexibility in scaling out positions, and professional-grade risk control.
NY First Candle Break and RetestStrategy Overview
Session and Time Parameters:
The strategy focuses on the New York trading session, starting at 9:30 AM and lasting for a predefined session length, typically 3 to 4 hours. This timing captures the most active market hours, providing ample trading opportunities.
Strategy Parameters:
Utilizes the Average True Range (ATR) to set dynamic stop-loss levels, ensuring risk is managed according to market volatility.
Employs a reward-to-risk ratio to determine take profit levels, aiming for a balanced approach between potential gains and losses.
Strategy Settings:
Incorporates simple moving averages (EMA) and the Volume Weighted Average Price (VWAP) to identify trend direction and price levels.
Volume confirmation is used to validate breakouts, ensuring trades are based on significant market activity.
Trade Management:
Features a trailing stop mechanism to lock in profits as the trade moves in favor, with multiple take profit levels to secure gains incrementally.
The strategy is designed to handle both long and short positions, adapting to market conditions.
Alert Settings:
Provides alerts for key events such as session start, breakout, retest, and entry signals, helping traders stay informed and act promptly.
Visual cues on the chart highlight entry and exit points, making it easier for beginners to follow the strategy.
This strategy is particularly suited for the current volatile market environment, where simplicity and clear guidelines can help beginner traders navigate the complexities of trading. It emphasizes risk management and uses straightforward indicators to make informed trading decisions.
I put together this Trading View scalping strategy for futures markets with some help from Claude AI. Shoutout to everyone who gave me advice along the way—I really appreciate it! I’m sure there’s room for improvement, so feel free to share your thoughts… just go easy on me. :)

Negroni Opening Range StrategyStrategy Summary:
This tool can be used to help identify breakouts from a range during a time-zone of your choosing. It plots a pre-market range, an opening range, it also includes moving average levels that can be used as confluence, as well as plotting previous day SESSION highs and lows.
There are several options on how you wish to close out the trades, all described in more detail below.
Back-testing Inputs:
You define your timezone.
You define how many trades to open on any given day.
You decide to go: long only, short only, or long & short (CAREFUL: "Long & Short" can open trades that effectively closes-out existing ones, for better AND worse!)
You define between which times the strategy will open trades.
You define when it closes any open trades (preventing overnight trades, or leaving trades open into US data times!!).
This hopefully helps make back-testing reflect YOUR trading hours.
NOTE: Renko or Heikin-Ashi charts
For ALL strategies, don’t use Renko or Heikin-Ashi charts unless you know EXACTLY the implications.
Specific to my strategy, using a renko chart can make this 85-90% profitable (I wish it was!!) Although they can be useful, renko charts don’t always capture real wicks, so the renko chart may show your trade up-only but your broker (who is not using renko!!) will have likely stopped you out on a wick somewhere along the line.
NOTE: TradingView ‘Deep backtesting’
For ALL strategies, be cynical of all backtesting (e.g. repainting issues etc) as well as ‘Deep backtesting’ results.
Specific to this strategy, the default settings here SHOULD BE OK, but unfortunately at the time of writing, we can’t see on the chart what exactly ‘deep backtesting’ is calculating. In the past I have noted a number of trades that were not closed at the end of the day, despite my ‘end of day’ trade closing being enabled, so there were big winners and losers that would not have materialized otherwise. As I say, this seems ok at these settings but just always be cynical!!
Opening Range Inputs
You define a pre-market range (example: 08:00 - 09:00).
You define an opening range (example: 09:00 - 09:30).
The strategy will give an update at the close of the opening range to let you know if the opening range has broken out the pre-market range (OR Breakout), or if it has remained inside (OR Inside). The label appears at the end of the opening range NOT at the bar that ‘broke-out’.
This is just a visual cue for you, it has no bearing on what the strategy will do.
The strategy default will trade off the pre-market range, but you can untick this if you prefer to trade off the opening range.
Opening Trades:
Strategy goes long when the bar (CLOSE) crosses-over the ‘pre-market’ high (not the ‘opening range’ high); and the time is within your trading session, and you have not maxed out your number of trades for the day!
Strategy goes short when the bar (CLOSE) crosses-under the ‘pre-market’ low (not the ‘opening range low); and the time is within your trading session, and you have not maxed out your number of trades for the day!
Remember, you can untick this if you prefer to trade off the opening range instead.
NOTES:
Using momentum indicators can help (RSI and MACD): especially to trade range plays in failed breakouts, when momentum shifts… but the strategy won’t do this for you!
Using an anchored vwap at the session open can also provide nice confluence, as well as take-profit levels at the upper/lower of 3x standard deviation.
CLOSING TRADES:
You have 6 take-profit (TP) options:
1) Full TP: uses ATR Multiplier - Full TP at the ATR parameters as defined in inputs.
2) Take Partial profits: ATR Multiplier - Takes partial profits based on parameters as defined in inputs (i.e close 40% of original trade at TP1, close another 40% of original trade at TP2, then the remainder at Full TP as set in option 1.).
3) Full TP: Trailing Stop - Applies a Trailing Stop at the number of points, as defined in inputs.
4) Full TP: MA cross - Takes profit when price crosses ‘Trend MA’ as defined in inputs.
5) Scalp: Points - closes at a set number of points, as defined in inputs.
6) Full TP: PMKT Multiplier - places a SL at opposite pre-market Hi/Low (we go long at a break-out of the pre-market high, 50% would place a SL at the pre-market range mid-point; 100% would place a SL at the pre-market low)'. This takes profit at the input set in option 1).

Risk to Reward - FIXED SL BacktesterDon't know how to code? No problem! TradingView is an excellent platform for you. ✅ ✅
If you have an indicator that you want to backtest using a risk-to-reward ratio or fixed take profit/stop loss levels, then the Risk to Reward - FIXED SL Backtester script is the perfect solution for you.
introducing Risk to Reward - FIXED SL Backtester Script which will allow you to test any indicator / Signal with RR or Fixed SL system
How does it work ?!
Once you connect the script to your indicator, it will analyze your entry points and perform calculations based on them. It will then open trades for you according to the specified inputs in the script settings.
HOW TO CONNECT IT to your indicator?
simply open your indicator code and add the below line of code to it
plot(Signal ? 100 : 0,"Signal",display = display.data_window)
Replace Signal with the long condition from your own indicator. You can also modify the value 100 to any number you prefer. After that, open the settings.
Once the script is connected to your indicator, you can choose from two options:
Risk To Reward Ratio System
Fixed TP/ SL System
🔸if you select the Risk to Reward System ⤵️
The Risk-to-Reward System requires the calculation of a stop loss. That's why I have included three different types of stop-loss calculations for you to choose from:
ATR Based SL
Pivot Low SL
VWAP Based SL
Your stop loss and take profit levels will be automatically calculated based on the selected stop loss method and your risk-to-reward ratio.
You can also adjust their values to match your desired risk level. The trades will be displayed on the chart.
with the ability to change their values to match your risk.
once this is done, trades will be displayed on the chart
🔸if you select the Fixed system ⤵️
You have 2 inputs, which are FIXED TP & Fixed SL
input the values you want, and trades will be on your chart...
I have also added a Breakeven feature for you.
with this Breakeven feature the trade will not just move SL to Entry ?! NO NO, it will place it above entry by a % you input yourself, so you always win! 🚀
Here is an example
Enjoy, and have fun, if you have any questions do not hesitate to ask

Stochastic RSI Strategy (with SMA and VWAP Filters)The strategy is designed to trade on the Stochastic RSI indicator crossover signals.
Below are all of the trading conditions:
-When the Stochastic RSI crosses above 30, a long position is entered.
-When the Stochastic RSI crosses below 70, a short position is entered.
-The strategy also includes two additional conditions for entry:
-Long entries must have a positive spread value between the 9 period simple moving average and the 21 period simple moving average.
-Short entries must have a negative spread value between the 9 period simple moving average and the 21 period simple moving average.
-Long entries must also be below the volume-weighted average price.
-Short entries must also be above the volume-weighted average price.
-The strategy includes stop loss and take profit orders for risk management:
-A stop loss of 20 ticks is placed for both long and short trades.
-A take profit of 25 ticks is placed for both long and short trades.

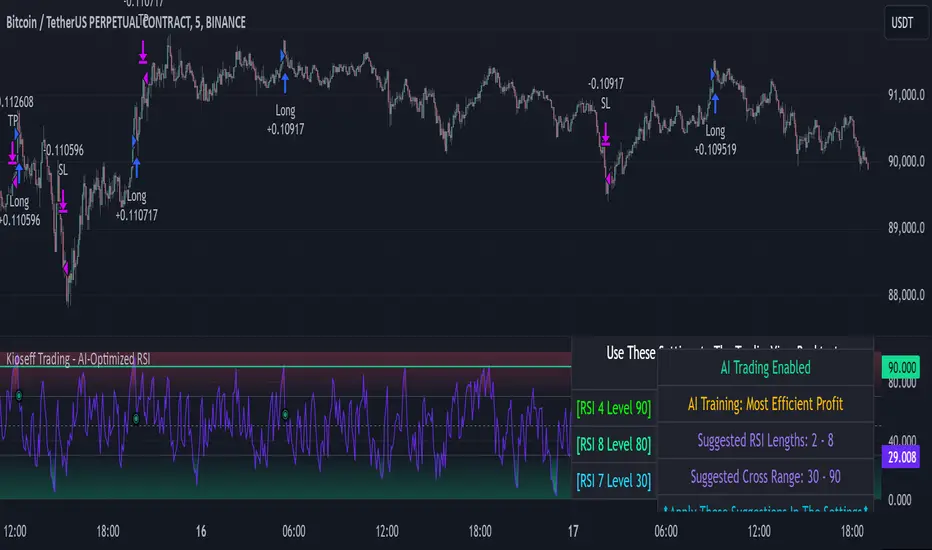
Kioseff Trading - AI-Optimized RSIAI-Optimized RSI
Introducing AI-Optimized RSI: a streamlined solution for traders of any skill level seeking to rapidly test and optimize RSI. Capable of analyzing thousands of strategies, this tool cuts through the complexity to identify the most profitable, reliable, or efficient approaches.
Paired with TradingView's native backtesting capabilities, the AI-Optimized RSI learns from historical performance data. Set up is easy for all skill levels, and it makes fine-tuning trading alerts and RSI straightforward.
Features
Purpose : Uncover optimal RSI settings and entry levels with precision. Say goodbye to random guesses and arbitrary indicator use—this tool provides clear direction based on data.
Target Performance : You set the goal, and AI-RSI seeks it out, whether it's maximizing profits, efficient trading, or achieving the highest win rate.
AI-Powered : With intelligent AI recommendations, the tool dynamically fine-tunes your RSI approach, steering you towards ideal strategy performance.
Rapid Testing : Evaluate thousands of RSI strategies.
Dual Direction : Perfect both long and short RSI strategies with equal finesse.
Deep Insights : Access detailed metrics including profit factor, PnL, win rate, trade counts, and more, all within a comprehensive strategy script.
Instant Alerts : Set alerts and trade.
Full Customization : Test and optimize all RSI settings, including cross levels, profit targets and stop losses.
Simulated Execution : Explore the impact of limit orders and other trade types through simulation.
Integrative Capability : Combine your own custom indicators or others from the TradingView community for a personalized optimization experience.
Flexible Timeframes : Set your optimization and backtesting to any date range.
Key Settings
The image above shows explanations for a list of key settings for the optimizer.
Direction : This setting controls trade direction: Long or Short.
Entry Condition : Define RSI entry: Select whether to trigger trades on RSI crossunders or crossovers.
RSI Lengths Range : Choose the range of RSI periods to test and find the best one.The AI will find the best RSI period for you.
RSI Cross Range : Set the range for RSI levels where crosses trigger trade signals. The AI will find the best level for you.
Combinations : Select how many RSI strategies to compare.
Optimization Type : Choose the goal for optimization and the AI: profit, win rate, or efficiency.
Profit Target : Set your profit target with this setting.
Stop Loss : Decide your maximum allowable loss (stop loss) per trade.
Limit Order : Specify whether to include limit orders in the strategy.
Stop Type : Choose your stop strategy: a fixed stop loss or a trailing stop.
How to: Find the best RSI for trading
It's important to remember that merely having the AI-Optimized RSI on your chart doesn't automatically provide you with the best strategy. You need to follow the AI's guidance through an iterative process to discover the optimal RSI settings and strategy.
1.Starting Your Strategy Setup
Begin by deciding your goals for each trade: your profit target and stop loss. You'll also choose how to manage your stops – whether they stay put (fixed) or move with the price (trailing), and whether you want to exit trades at a specific price (limit orders). Keep the initial settings for RSI lengths and cross ranges at their default to give the tool a broad testing field. The AI's guidance will refine these settings to pinpoint the most effective ones through a process of comprehensive testing.
The image above shows our chart prior to any optimization efforts.
Note: the settings shown above in the key settings section will be used to start our demonstration.
2. Follow AI’s suggestions
Optimization Prompt: After loading your strategy, the indicator will prompt you to change the RSI length range and RSI level range to a better performing range.
Continue changing the RSI length range and RSI level range to match the indicator's suggestions until "Best Found" is displayed!
The image above shows results after we applied the tool’s suggestions. New suggestions have appeared, and we will continue to apply them.
Continue to adjust settings as recommended by the optimizer. If no better options are found, the optimizer will suggest increasing the number of combinations. Repeat this process until the optimizer indicates that the optimal setting has been identified.
Success! With the "Best Found" notification, an optimized RSI is now active. The AI will keep refining the strategy based on ongoing performance, ensuring continuous optimization.
AI Mode
AI Mode incorporates Heuristic-Based Adaptive Learning to fine-tune trading strategies in a continuous manner. This feature consists of two main components:
Heuristic-Based Decision Making: The algorithm evaluates multiple RSI-based trading strategies using specific metrics such as Profit and Loss (PNL), Win Rate, and Most Efficient Profit. These metrics act as heuristics to assist the algorithm in identifying suitable strategies for trade execution.
Online Learning: The algorithm updates the performance evaluations of each strategy based on incoming market data. This enables the system to adapt to current market conditions.
Incorporating both heuristic-based decision-making and online learning, this feature aims to provide a framework for trading strategy optimization.
Settings
AI Mode Aggressiveness:
Description: The "AI Mode Aggressiveness" setting allows you to fine-tune the AI's trading behavior. This setting ranges from “Low” to “High”, with “High” indicating a more assertive trading approach.
Functionality: This feature filters trading strategies based on a proprietary evaluation method. A higher setting narrows down the strategies that the AI will consider, leaning towards more aggressive trading. Conversely, a lower setting allows for a more conservative approach by broadening the pool of potential strategies.
Adaptive Learning Aggressiveness:
Description: When Adaptive Learning is enabled, the "Adaptive Learning Aggressiveness" setting controls how dynamically the AI adapts to market conditions using selected performance metrics.
Functionality: This setting impacts the AI's responsiveness to shifts in strategy performance. By adjusting this setting, you can control how quickly the AI moves away from strategies that may have been historically successful but are currently underperforming, towards strategies that are showing current promise.
Optimization
Trading system optimization is immensely advantageous when executed with prudence.
Technical-oriented, mechanical trading systems work when a valid correlation is methodical to the extent that an objective, precisely-defined ruleset can consistently exploit it. If no such correlation exists, or a technical-oriented system is erroneously designed to exploit an illusory correlation (absent predictive utility), the trading system will fail.
Evaluate results practically and test parameters rigorously after discovery. Simply mining the best-performing parameters and immediately trading them is unlikely a winning strategy. Put as much effort into testing strong-performing parameters and building an accompanying system as you would any other trading strategy. Automated optimization involves curve fitting - it's the responsibility of the trader to validate a replicable sequence or correlation and the trading system that exploits it.