Recherche dans les scripts pour "weekly"

PLOW/PLHW (Potential weekly highs/lows)AP Capital – PLOW / PLHW (Potential Weekly Low / High)
This indicator highlights Potential Weekly Lows (PLOW) and Potential Weekly Highs (PLHW) in real time, using current-week price action, session context, and confirmed candle closes.
It is designed for intraday and swing traders who want early-week and late-week structure levels without repainting or hindsight bias.
🔹 How It Works
Potential Weekly Low (PLOW)
Detected during early week sessions
Triggers when price prints the current week’s lowest low
Confirmed only on candle close
Typically aligns with liquidity grabs, stop runs, or accumulation
Potential Weekly High (PLHW)
Detected during late week sessions
Triggers when price prints the current week’s highest high
Confirmed only on candle close
Often marks distribution or exhaustion zones
📊 Visual Elements
Clean weekly high & low levels
Optional weekly midpoint
Session-aware confirmation
Non-repainting labels
Minimalist layout (no clutter)
⚙️ Key Features
Works on any intraday timeframe
Fully non-repainting
Session-based logic (early vs late week)
Optional weekly range info panel
Suitable for Gold, FX, Indices, Crypto
🧠 Best Use Cases
Fade moves into weekly extremes
Combine with:
Previous Day High / Low
Liquidity sweeps
Market structure shifts
Identify high-probability reversals
Avoid chasing price late in the week
⚠️ Important Notes
This is NOT predictive — levels are confirmed from live price action
Best used as context, not a standalone entry system
Designed to complement price action & liquidity-based trading
📌 Disclaimer
This indicator is for educational purposes only.
Not financial advice. Always manage risk.

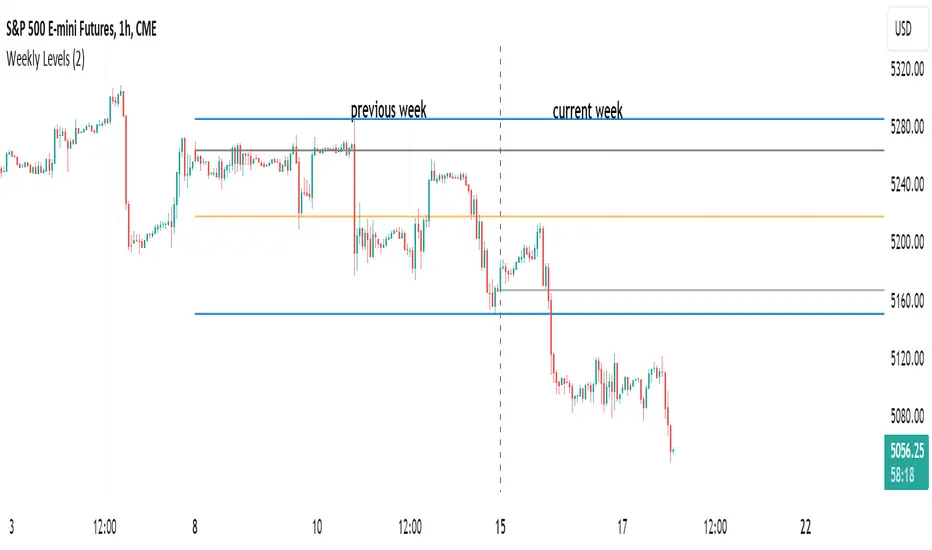
HT: Weekly LevelsIndicator draws several most important weekly levels on the lower timeframe: last week high/low, halfback, week close and current week open. These levels often act as support/resistance for price movements. Also, they can help to assess week character and control of power.
Indicator can be used on any timeframe, lower than weekly, for any type of instrument, including futures. It also provides an option to draw levels for any selected week back in time.
Important notes:
• Levels for the last week are drawn after the new week opens.
• Half-back is calculated as a middle line between week High and Low.
Parameters:
Date – user can select date, belonging to week, for which levels will be plotted. Works only if “Use” check box is on. Otherwise, levels will be plotted for the last week. (“time” value doesn’t matter; unfortunately, there is no way to hide the input box)
Time zone – your chart time zone (as UTC offset). Only needed if you use “Date” parameter.
Visuals – controls visibility and colors
Script is published as an open source. It uses two libraries: Levels Lib and Functions Lib. First one demonstrates how to work with pine-script object model and arrays. You can also reuse it in your custom scripts where there is need to construct any support/resistance levels. The second library contains some useful functions for working with time and dates.
Disclaimer
This indicator should not be used as a standalone tool to make trading decisions but only in conjunction with other technical analysis methods.
Daily Weekly Monthly Highs & Lows [Dova Lazarus]Daily Weekly Monthly Highs & Lows
📊 Overview
This Pine Script indicator displays key support and resistance levels by plotting the highs and lows from Daily, Weekly, and Monthly timeframes on your current chart. It's designed as an educational tool to help traders understand multi-timeframe analysis and identify significant price levels.
🎯 Key Features
Multi-Timeframe Support & Resistance
- Daily Levels: Shows previous daily highs and lows
- Weekly Levels: Displays weekly highs and lows
- Monthly Levels: Plots monthly highs and lows
- Smart Display: Only shows relevant timeframes based on your current chart timeframe
Fully Customizable Appearance
- Individual Colors: Set unique colors for each timeframe
- Line Styles: Choose between Solid, Dashed, or Dotted lines
- Line Width: Adjust thickness from 1-4 pixels
- Lookback Periods: Control how many historical levels to display
User-Friendly Options
- Enable/Disable: Toggle any timeframe on/off
- Line Extension: Option to extend lines into the future
- Clean Interface: Organized settings groups for easy configuration
🔧 Settings
Timeframes Group
- Show Daily/Weekly/Monthly Levels: Enable or disable each timeframe
- Lookback Periods: Number of historical levels to display (1-10)
Line Settings Group
- Color: Choose custom colors for each timeframe
- Style: Select line appearance (Solid/Dashed/Dotted)
- Width: Set line thickness (1-4 pixels)
Display Options Group
- Extend Lines Forward: Project lines 20 bars into the future
📈 How to Use
1. Add to Chart: Apply the indicator to any timeframe chart
2. Configure Timeframes: Enable the timeframes you want to see
3. Customize Appearance: Set colors and line styles for easy identification
4. Identify Levels: Use the plotted levels as potential support/resistance zones
5. Plan Trades: Look for price reactions at these key levels
💡 Trading Applications
- Support & Resistance: Identify key price levels where reversals may occur
- Entry Points: Look for bounces or breaks at these levels
- Stop Loss Placement: Use levels to set logical stop losses
- Target Setting: Previous highs/lows can serve as profit targets
- Multi-Timeframe Analysis: Understand the bigger picture context
🎓 Educational Value
This indicator is perfect for:
- Learning Pine Script: Clean, well-commented code structure
- Understanding Multi-Timeframe Analysis: See how different timeframes interact
- Practicing Technical Analysis: Identify key support/resistance concepts
- Code Study: Full variable names and detailed comments for learning
⚙️ Technical Details
- Version: Pine Script v6
- Overlay: True (plots directly on price chart)
- Max Lines: 500 (handles multiple timeframes efficiently)
- Compatibility: Works on all timeframes (shows relevant levels only)
🔍 What Makes This Different
- Educational Focus: Designed for learning with clear code structure
- Simplified Interface: Easy-to-use settings without overwhelming options
- Visual Clarity: Clean line display with customizable appearance
- Practical Application: Real trading tool, not just a demonstration
📋 Requirements
- TradingView account (any plan)
- Basic understanding of support/resistance concepts
- Any chart timeframe (indicator adapts automatically)
🚀 Quick Start
1. Add indicator to your chart
2. Default settings work great out of the box
3. Customize colors if desired (Green=Daily, Orange=Weekly, Red=Monthly)
4. Watch for price reactions at the plotted levels
5. Use as part of your technical analysis toolkit
---
*This indicator is designed as an educational tool and should be used in conjunction with other forms of analysis. Past performance does not guarantee future results.*

Initial balance - weeklyWeekly Initial Balance (IB) — Indicator Description
The Weekly Initial Balance (IB) is the price range (High–Low) established during the week’s first trading session (most commonly Monday). You can measure it over the entire day or just the first X hours (e.g. 60 or 120 minutes). Once that session ends, the IB High and IB Low define the key levels where the initial weekly range formed.
Why Measure the Weekly IB?
Week-Opening Sentiment:
Monday’s range often sets the tone for the rest of the week. Trading above the IB High signals bullish control; trading below the IB Low signals bearish control.
Key Liquidity Zones:
Large institutions tend to place orders around these extremes, so you’ll frequently see tests, breakouts, or rejections at these levels.
Support & Resistance:
The IB High and IB Low become natural barriers. Price will often return to them, bounce off them, or break through them—ideal spots for entries and exits.
Volatility Forecast:
The width of the IB (High minus Low) indicates whether to expect a volatile week (wide IB) or a quieter one (narrow IB).
Significance of IB Levels
Breakout:
A clear break above the IB High (for longs) or below the IB Low (for shorts) can ignite a strong trending move.
Fade:
A rejection off the IB High/Low during low momentum (e.g. low volume or pin-bar formations) offers a high-probability reversal trade.
Mid-Point:
The 50% level of the IB range often “magnetizes” price back to it, providing entry points for continuation or reversal strategies.
Three Core Monday IB Strategies
A. Breakout (Open-Range Breakout)
Entry: Wait for 1–2 candles (e.g. 5-minute) to close above IB High (long) or below IB Low (short).
Stop-Loss: A few pips below IB High (long) or above IB Low (short).
Profit-Target: 2–3× your risk (Reward:Risk ≥ 2:1).
Best When: You spot a clear impulse—such as a strong pre-open volume spike or news-driven move.
B. Fade (Reversal at Extremes)
Entry: When price tests IB High but shows weakening momentum (shrinking volume, upper-wick candles), enter short; vice versa for IB Low and longs.
Stop-Loss: Just beyond the IB extreme you’re fading.
Profit-Target: Back toward the IB mid-point (50% level) or all the way to the opposite IB extreme.
Best When: Monday’s action is range-bound and lacks a clear directional trend.
C. Mid-Point Trading
Entry: When price returns to the 50% level of the IB range.
In an up-trend: buy if it bounces off mid-point back toward IB High.
In a down-trend: sell if it reverses off mid-point back toward IB Low.
Stop-Loss: Just below the nearest swing-low (for longs) or above the nearest swing-high (for shorts).
Profit-Target: To the corresponding IB extreme (High or Low).
Best When: You see a strong initial move away from the IB, followed by a pullback to the mid-point.
Usage Steps
Configure your session: Measure IB over your chosen Monday timeframe (whole day or first X hours).
Choose your strategy: Align Breakout, Fade, or Mid-Point entries with the current market context (trend vs. range).
Manage risk: Keep risk per trade ≤ 1% of account and maintain at least a 2:1 Reward:Risk ratio.
Backtest & forward-test: Verify performance over multiple Mondays and in a paper-trading environment before going live.

4C Expected Move (Weekly Options)This indicator plots the Expected Move (EM) calculated from weekly options pricing, for a quick visual reference.
The EM is the amount that a stock is predicted to increase or decrease from its current price, based on the current level of implied volatility.
This range can be viewed as support and resistance, or once price gets outside of the range, institutional hedging actions can accelerate the move in that direction.
The EM range is based on the Weekly close of the prior week.
It can be useful to know what the weekly EM range is for a stock to understand the probabilities of the overall distance, direction and volatility for the week.
To use this indicator you must have access to a broker with options data (not available on Tradingview).
Look at the stock's option chain and find the weekly expected move. You will have to do your own research to find where this information is displayed depending on your broker.
See screenshot example on the chart. This is the Thinkorswim platform's option chain, and the Implied Volatility % and the calculated EM is circled in red. Use the +- number in parentheses, NOT the % value.
Input that number into the indicator on a weekly basis, ideally on the weekend sometime after the cash market close on Friday, and before the Market open at the beginning of the trading week.
The indicator must be manually updated each week.
It will automatically start over at the beginning of the week.

Daily and Weekly Moving Averages on Daily ChartThis script is designed to be used on Swing and Position style approaches.
Based on moving averages that I use with the integration of a weekly moving average that is visible on the daily chart /all timeframes.
The moving averages are:
9EMA;
21EMA;
10 week SMA ;
50EMA;
150EMA;
and 200EMA.
Base script from CaptainBrett with Matt Caruso's chat with Richard Moglen showing me that this can be done on Tradingview. When searching for the script, I couldn't find it within the public library.
Please Enjoy

4C Options Expected Move (Weekly + 0DTE)This indicator plots the calculated Expected Move for BOTH Weekly and Zero Dated Expiration (0DTE) Daily options, for a quick visual reference.
Please Note: This indicator is different from our original "4C Expected Move (Weekly Options)" indicator, as it now packages the ability to ALSO plot 0DTE options expected moves along with Weekly expected moves. Many other newer features have also been implemented.
Background Information
The Expected Move (EM) is the amount that a stock is predicted to increase or decrease from its current price, based on the current level of options pricing and implied volatility.
This range can be viewed as possible support and resistance, or, once price gets outside of the range, institutional hedging actions can accelerate the move in that direction.
It can be useful to know what the weekly EM range is for a stock to understand the probabilities of the overall distance, direction and volatility for the week.
About the Indicator
This indicator plots the calculated Expected Move for BOTH Weekly and Zero Dated Expiration (0DTE) options, for a quick visual reference.
For the weekly EM, the range is based on the Weekly close of the prior week.
For the Daily EM based on 0DTE options, the range is based on the Daily close of the prior day.
The indicator will automatically start a new weekly EM plot at the beginning of the week, and a new daily EM at the beginning of each day.
The EM values must be updated weekly and/or daily.
Features
Plots the EM for the week
Plots the EM for the day, for symbols that offer daily expiration options
Plots the 2 Standard Deviation EM for both the weekly and daily EM
Labels with calculated values are plotted near the levels for quick visual aid
Settings
Can toggle weekly EM on/off
Can toggle Daily EM on/off
Can toggle 2 Standard Deviation lines on/off
Can toggle labels for all EM on/off
Robust line settings
Can adjust label location left/right based on personal preference
Can enter symbol into settings as a reference
Handy instructions in the settings
How To Set Up The Indicator
To use this indicator you must have access to a broker with options data (not available on Tradingview).
Usually, you can look at the stock's option chain to find the weekly expected move.
You will have to do your own research to find where this information is displayed depending on your broker. You may also need to find the information elsewhere if your broker does not have this information.
You can also do your calculation of the EM using the following formula (please do your own research):
Expected Move = Option Price x Implied Volatility x Square Root of Time
See screenshot example below
This is the Thinkorswim platform's option chain, and the Implied Volatility % and the calculated EM are on the right side of the option chain.
The Expected Move is circled in blue. Use the +- number in parentheses, NOT the % value.
For the weekly EM, input the number that corresponds to the weekly option into the indicator. This must be done on a weekly basis, and It is typically best to use the EM for the next week expiration that is generated AFTER the Friday close and/or before the Monday open of the upcoming week.
For the daily EM, input the number that corresponds to the daily 0DTE option into the indicator. This must be done on a daily basis, and it is typically best to use the EM value for the 0DTE option that is generated the night before (after market close), or before the market opens for that 0DTE. .

WEEKLY BTC TRADING SCRYPTWeekly BTC Trading Scrypt(WBTS)
This script is only suggested for cryptocurrencies and weekly buying strategy which is long term.Using it in another markets(e.g forex,stock,e.t.c) is not suggested. The thing makes it different than other strategies we try to understand bull and bear seasons and buying selected crypto currency as using formula if weekly closing value crossover eight weeks simple moving avarage buy,else if selected crypto currency's weekly closing value crossunder eight weeks simple avarage sell. Eight week moving avarage is also uses weekly closing prices but for being able to use this strategy ,trading pair must have more than eight candles in weekly chart otherwise the 8 weeks simple moving avarage value cannot be calculated and script does not work.
This script has a chart called WBTS and it has following features:
Strategy group consist of 3 inputs:
1)Source: Close by default. Our whole strategy uses close values. You can change it but not suggested.
2)Loss Ratio: Because of the cases like the circumstances that manipulates market or high volatility , sometimes graphic show wrong buying signals and this ratio saves user from big money looses(Note : This ratio will always work when selling condition occurs to make user take his profit or prevent him to loss more money because of a wrong positive comes from the indicator.)
3)Reward Ratio : When selling condition happens it will exit user with more profit(if price is already higher than buying point) otherwise it will dimunish loss a bit(if user is below of buying point) or prevents looses(if user is in buying point when selling condition happened.
MA group consist of 2 inputs:
COLOR:Specifies color of the moving avarage.It is equal to #FF3232by hex color code by default.
LINE WIDTH: Specifies linewidth of the moving avarage. It is 2 by default.
GRAPHIC group consist of 2 inputs:
COLOR: It specifies the color of the line which consist of weekly closing prices. It is equal to #6666FF hex color code by default.
LINE WIDTH: Specifies linewidth of the line which consist of weekly closing prices. It is 2 by default.
STRATEGY EXECUTION YEAR: It will show the orders,profits and looses done by script after the input year giving in it.It is 2020 by default.
The last feature is strategy equity,it is not in one of these groups. User should click on settings button on the WBTS indicator than chose Style section and there is a deactivated check box near in the plot section if user activate it, the equity line will show in indicator's graph.
Logic of This Strategy:The story of this strategy began when I studied BTC's price movement from 2020 to today with 8 weeks simple moving avarage (it takes weekly closes as source) and weekly clossing values. I understood that there was a perfect interest between bull and bear market and following conditions:
buy_condition=crossover(weekly_closing_values,8_week_simple_moving_avarage)
sell_condition=crossover(weekly_closing_values,8_week_simple_moving_avarage)
and I tried same thing on the same and bigger time frames("for example i studied how the strategy works from the beginning to today with bitcoin and what is our final equity") with bitcoin and other cryptocurrencies and this made me saw better the relation between giving conditions and general market psychology, however I also witnessed some wrong positives coming by script and used a risk reward ratio to save user and set risk reward ratio 1/3 after a research.
For both conditions(buy_condition and sell_condition),when they are realised,script will alert users and an order will be triggered.
Before finishing the description,from settings/properties/ user can set initial capital,base currency,order size and type,but it is 100000 for initial_amount and 1 contract for order size by default.
In backtesting I used the options like the following example :
Initial capital=1000
Base_curreny=USD
Order size=40 USD
Properties place must set different by every single user according to his or her capital and order size must not be higher than his total money because this script is not the best or a good script for derivatives. It is only written for long term-crypto spot trading and I strongly recommend to users that margin may cause bad results and please do not use it with any margin or any market different than crypto market.
Thank you very much for reading)

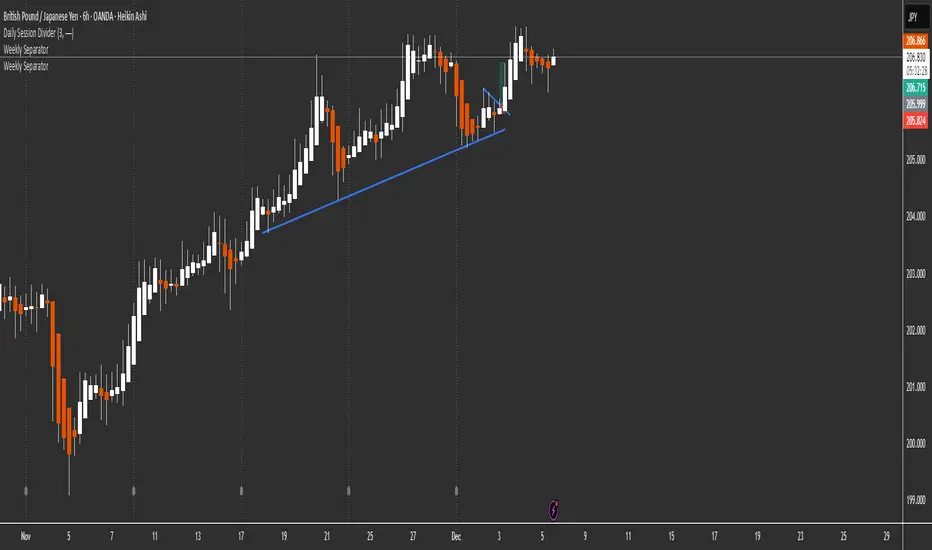
Weekly Separator - JammalWeekly Separator - Jammal
This script draws a clean and minimal weekly separator for better chart structure and visual clarity.
Every time a new trading week begins, the script automatically places a vertical dotted gray line extending across the entire chart.
Features:
Automatic weekly detection
Clean dotted vertical line
Light gray color to avoid clutter
Works on all timeframes
Helps identify weekly structure & price flow
Designed for traders who want a simple, non-intrusive weekly separator.
Enjoy and happy trading!
Session, Weekly, Daily LevelsScroll down for hungarian description!
Magyar leíráshoz görgess lejjebb!
Overview
This script provides a unified market structure mapping tool that automatically identifies and visualizes key intraday, daily, and weekly reference levels. It helps traders contextualize price action throughout the trading week by marking true session opens, previous day highs/lows, weekly highs/lows, and weekday opens, all with accurate historical anchoring and correct timezone handling.
What This Script Does
1. Intraday Session Opens (Tokyo, London, New York)
- Detects the exact candle where each session opens.
- Draws horizontal rays with labels.
- Automatically clears lines at the start of each new day.
- Uses a custom local-to-exchange timezone conversion system.
2. Weekly Levels
- Last week high and low (precise bar anchoring, not HTF aggregation)
- Current week open (also Monday open)
- Auto-reset on new week
- Levels are always drawn from the true candle where they formed.
3. Previous Day High & Low
- Continuously tracks intraday highs and lows.
- On a new day, stores yesterday’s values and anchors rays to the exact bars.
- Levels remain visible for the full current day and reset the next day.
4. Weekday Opens (Tue–Fri)
- Captures the exact opening price of Tuesday–Friday.
- Monday open = Week open, so it is not shown separately.
- Auto-reset on new week.
Timezone Logic (Original Feature)
The script converts:
local session times → exchange timezone → chart timestamps
It works correctly regardless of chart timezone or instrument exchange location.
Line Drawing Logic
- Finds the exact bar_index where each level forms.
- Draws rays extending to the right.
- Labels are placed ahead of price.
- Safe updating prevents “bar index too far” errors.
How to Use
- Identify daily/weekly structure.
- Track bias relative to session opens.
- Observe reactions around weekday opens.
- Compare price action to last week's range.
Originality
- Custom timezone conversion engine.
- True historical bar anchoring.
- Fully automated weekly/daily structural resets.
- Independent styling for each level type.
- Not a mashup; all components follow one unified logic.
Limitations
- Does not predict trend or direction.
- Structural tool only.
Summary
A precise and reliable market structure tool that unifies weekly, daily, and intraday reference levels with full timezone automation and true-candle anchoring.
MAGYAR LEÍRÁS
--------------
Áttekintés
Ez az indikátor egy összetett piaci szerkezet-feltérképező eszköz, amely automatikusan megjeleníti a legfontosabb intraday, napi és heti referenciaértékeket. A célja, hogy a kereskedő tisztán lássa a piac aktuális környezetét: hol nyíltak a főbb devizapiaci szekciók, hogyan alakult a tegnapi tartomány, hol volt a múlt heti csúcs/mélypont, és hogyan nyitottak az egyes hétköznapok.
Mit tud a script?
1. Szekciónyitások (Tokyo, London, New York)
- Megkeresi a pontos gyertyát, amely a szekciónyitáskori árat tartalmazza.
- Vízszintes vonalat és címkét rajzol.
- Minden nap elején automatikusan törli a korábbi nap szintjeit.
- Egyedi időzóna-konverziós rendszerrel működik (helyi idő → tőzsdei idő → chart idő).
2. Heti szintek
- Múlt heti maximum és minimum (pontos gyertyapontra horgonyozva)
- Aktuális heti nyitóár (egyben a hétfői nyitó is)
- Új hét kezdetekor automatikusan frissül.
- A múlt heti high/low nem fix időpontra, hanem a valódi gyertyára kerül.
3. Előző napi High és Low
- Folyamatosan követi a napi maximumot és minimumot.
- Napváltáskor elmenti és pontos gyertyáról indítja a ray-t.
- A szintek a teljes nap folyamán megmaradnak, majd a következő nap törlődnek.
4. Hétköznapok nyitóárai (Kedd–Péntek)
- A kedd, szerda, csütörtök és péntek nyitóárát rögzíti és megjeleníti.
- A hétfői nyitó a Week Open, ezért külön nem jelenik meg.
- Heti váltáskor automatikusan törlődnek.
Időzóna-kezelés (egyedi megoldás)
A script a felhasználó helyi idejét átszámítja az instrumentum tőzsdei időzónájára, majd a chartra vetíti.
Ez biztosítja, hogy minden szekciónyitás helyesen jelenik meg, bármely chart vagy instrumentum esetén.
Vonalrajzolási logika
- A szintek a valódi bar_index alapján kerülnek rögzítésre.
- Jobbra nyúló ray-eket rajzol.
- A címkék mindig a jobb oldalon, előre helyezve jelennek meg.
- Biztonságos frissítési rendszer akadályozza meg a hibákat (pl. “bar index too far”).
Használat
- Napi/heti szerkezet meghatározása.
- Bias követése a session openekhez viszonyítva.
- Reakciók figyelése a hétköznapok nyitóárai körül.
- Összevetés a múlt heti tartománnyal.
Eredetiség
- Egyedi időzóna-kezelő motor.
- Igazi gyertyapont-alapú horgonyzás.
- Automatikus napi/heti reset.
- Minden szint külön stílusban konfigurálható.
- Nem mashup; egységes rendszer.
Összegzés
Professzionális, pontos eszköz a piaci szerkezet feltérképezésére, amely egyesíti a heti, napi és intraday szinteket, teljes időzóna-automatizálással és gyertyapontra horgonyzott kijelölésekkel.

Smart Weekly Lines — Clean & Scroll-Proof (Pine v6)Because your chart deserves structure. Elegant weekly dividers that stay aligned, scroll smoothly, and project future weeks using your wished UTC offset.
Smart Weekly Lines draws precise, full-height vertical lines marking each new week — perfectly aligned to your local UTC offset. It stays clean, smooth, and consistent no matter how far you scroll.
Features
• Accurate weekly boundaries based on your local UTC offset (supports half-hour zones like India +5.5)
• Clean, full-height lines that never cut off with zoom or scroll
• Adjustable color, opacity, width, and style (solid, dashed, dotted)
• Future week projection for planning and alignment
• Optional visibility: show only on Daily and Intraday charts
Works with any market — stocks, crypto, forex, or futures.
Built for traders who value clarity, structure, and precision.
Developed collaboratively with the assistance of ChatGPT under my direction and testing.

HTF 3rd Weekly High/LowThis indicator plots horizontal lines for the high and low of a selected past weekly candle, allowing traders to visualize higher time frame (HTF) structure on lower time frame charts (e.g., 1H, 4H, etc.).
Features:
Custom Weekly Range Selection: Use the dropdown to choose which weekly candle to reference — from the current week (0) to up to five weeks back.
Clean Horizontal Lines: High and low levels of the selected week are drawn as persistent horizontal lines.
Automatic Text Labels: Labels like Week-3H and Week-3L are shown on the right side of the chart, matching the week selected.
Customization:
Line colors
Line width and style (solid, dotted, dashed)
Text label offset
Automatic Refresh: Levels and labels are redrawn at the start of each new week to stay current with your selection.

Daily/Weekly/Monthly LevelsDaily/Weekly/Monthly Levels
TLDR
Shows Daily/Weekly/Monthly reversal levels. These can act as support/resistance levels.
Can only see what's in your candle history. I.e. It won't see old monthlies on your 1m chart! Use Daily to see everything with the most history.
Can only see levels higher than or equal to your current time frame. I.e. it will not see daily levels if you're looking at a weekly chart.
Doesn't keep levels that have been closed through. Does keep levels that have been only wicked.
This indicator shows you daily, weekly and monthly horizontal reversal levels to save you the hassle of doing it yourself. It's a little aid to speed up your TA routine.
Usage Details and Limitations
All daily, weekly, and monthly levels will be marked with lines on the chart automatically. Levels will only be visible from that level's TF or lower, i.e. you can't see the daily levels from the weekly chart, but you can see all levels from daily or lower charts. No levels will be displayed if you select a time frame higher than 1 month.
New levels will not be drawn if they are very close to existing levels. You can change the 'closeness' threshold in settings. It is specified as a percentage move from the existing level.
However, higher TF levels will REPLACE lower TF levels if they are too close. If you set the 'closeness' setting to 0, all levels will be drawn.
Levels will only be drawn if they are in your displayed candle range! I.e. the lower you go in timeframe, the less history you can see, and so levels originating from further back might be missed!
One technique you might have is to load up the daily timeframe and use that to mark any nearby levels of interest.
How does it work?
Basically, it looks for reversal candles on the D/W/M Timeframes, and draws a line for you from the open of the reversal candle (of that TF), so long as you are on a TF equal or lower than that level.
New bars on that TF that close through that TF's old levels will clear that level. Wicks do not clear.
Each newly found level will not be drawn if it's within the percentage distance of an existing level of equal or higher time frame.
Each new level also checks for existing levels on lower TFs that it can replace. E.g. if a monthly bar closes and produces a monthly level equal to an existing daily or weekly level, that daily or weekly level will be replaced. Use the settings to specify your 'closeness' allowance.
Please remember, it can only see as far back as your candle history, so you won't see old monthlies on a 1 minute chart! Use the daily TF to see all three levels at once with maximum history.

Weekly RSI Buy/Sell SignalsWeekly RSI Buy/Sell Signal Indicator
This indicator is designed to help traders identify high-probability buy and sell opportunities on the weekly chart by using the Relative Strength Index (RSI). By utilizing weekly RSI values, this indicator ensures signals align with broader market trends, providing a clearer view of potential price reversals and continuation.
How It Works:
Weekly RSI Calculation: This script calculates the RSI using a 14-period setting, focusing on the weekly timeframe regardless of the user’s current chart view. The weekly RSI is derived using request.security, allowing for consistent signals even on intraday charts.
Signal Conditions:
Buy Signal: A buy signal appears when the RSI crosses above the oversold threshold of 30, suggesting that price may be gaining momentum after a potential bottom.
Sell Signal: A sell signal triggers when the RSI crosses below the overbought threshold of 70, indicating a possible momentum shift downwards.
Visual Cues:
Buy/Sell Markers: Clear green "BUY" and red "SELL" markers are displayed on the chart when buy or sell conditions are met, making it easy to identify entry and exit points.
RSI Line and Thresholds: The weekly RSI value is plotted in real time with color-coded horizontal lines at 30 (oversold) and 70 (overbought), providing a visual reference for key levels.
This indicator is ideal for traders looking for reliable, trend-based signals on higher timeframes and can be a helpful tool for filtering out shorter-term market noise.

Futures Weekly Open RangeThe weekly opening range ( high to low ) is calculated from the open of the market on Sunday (1800 EST) till the opening of the Bond Market on Monday morning (0800 EST). This is the first and most crucial range for the trading week. As ICT has taught, price is moving through an algorithm and as such is fractal; because price is fractal, the opening range can be calculated and projected to help determine if price is trending or consolidating. As well; this indicator can be used to incorporate his PO3 concept to enter above the weekly opening range for shorts if bearish, or entering below the opening range for longs if bullish.
This indicator takes the high and low of weekly opening range, plots those two levels, plots the opening price for the new week, and calculates the Standard Deviations of the range and plots them both above and below of the weekly opening range. These are all plotted through the week until the start of the new week.
The range is calculated by subtracting the high from the low during the specified time.
The mid-point is half of that range added to the low.
The Standard deviation is multiples of the range (up to 10) added to the high and subtracted
from the low.
At this time the indicator will only plot the Standard deviation lines on the minutes time frame below 1 hour.
Only the range and range lines will be plotted on the hourly chart.

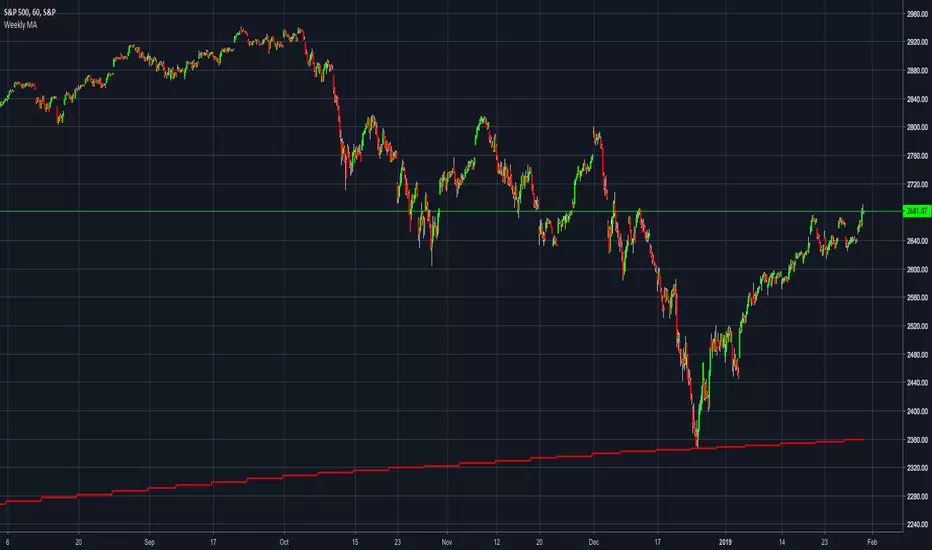
Swing VWAP Weekly Stock and Crypto StrategyThis is a simple yet very efficient swing strategy designed for crypto and stock market, using big timeframes.
Its main component is VWAP weekly, so for best scenarios its better to use big timeframes such as 8h+.
The rules for entry are simple:
If our close if above vwap weekly we enter long .
If our close is below vwap weekly we enter short.
We exit from the trade, when a reverse condition than the entry one is triggered.
Because this strategy has no risk management inside, I recommend to be careful with it.
If you have any questions, let me know

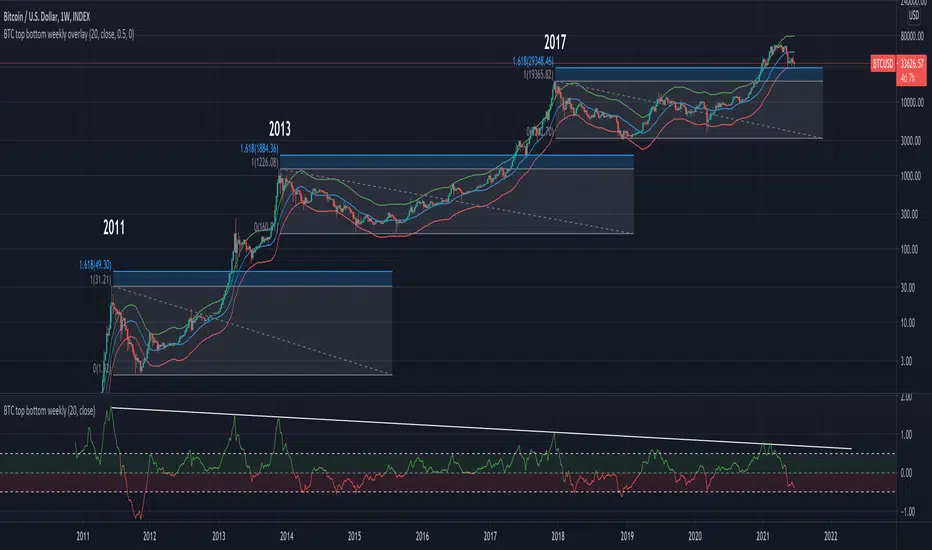
BTC top bottom weekly oscillatorThis indicator is based on the 20 weekly simple moving average and it could be used to help finding potential tops and bottoms on a weekly BTC chart.
This version uses an "oscillator" presentation, it fluctuates around the value zero.
The indicator plots 0 when the close price is near the 20 weekly moving average.
If it's below 0 it reflects the price being below the 20 weekly moving average, and opposite for above.
IT's possible to see how many times the price has hit the 0.5 coef support. In one case it hit 0.6 showing that the 0.5 support can be broken.
The indicator is calculated as Log(close / sma(close))
Instructions:
- Use with the symbol INDEX:BTCUSD so you can see the price since 2010
- Set the timeframe to weekly
Optionals:
- change the coef to 0.6 for a more conservative bottom
- change the coef to 0.4 for a more conservative top

BTC top bottom weekly bandsThis indicator is based on the 20 weekly simple moving average and it could be used to help finding potential tops and bottoms on a weekly BTC chart.
When using the provided "coef" parameter set to the default of 0.5 it shows how most bottoms since 2013 have hit the lower band of this indicator.
The lower band is calculated as exp(coef) * sma(close)
Instructions:
- Use with the symbol INDEX:BTCUSD so you can see the price since 2010
- Set the timeframe to weekly
- Use logarithmic chart (toggle "log" on)
Optionals:
- change the coef to 0.6 for a more conservative bottom
- change the coef to 0.4 for a more conservative top
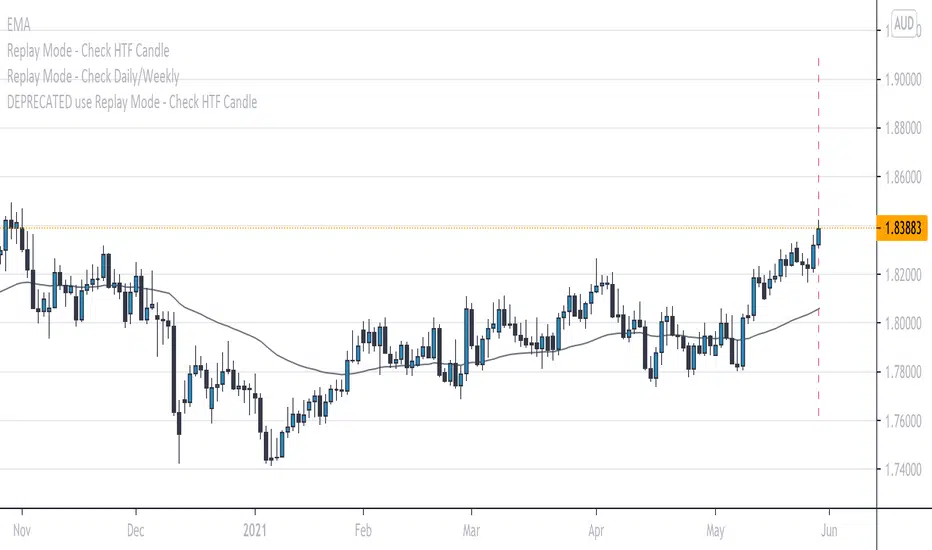
Replay Mode - Check Daily/WeeklyThis indicator is intended to be used while using Replay Mode.
It is similar to the built-in Session Breaks, but has the benefit of not needing to remove one candle before checking the Daily.
When on an intraday chart (timeframe less than Daily), a vertical line will be drawn when you can safely check the Daily or Weekly candle without seeing future price.
When the line is the color of your Daily settings, it is safe to check the Daily candle.
When the line is the color of your Weekly settings, it is safe to check both the Daily and Weekly candle.
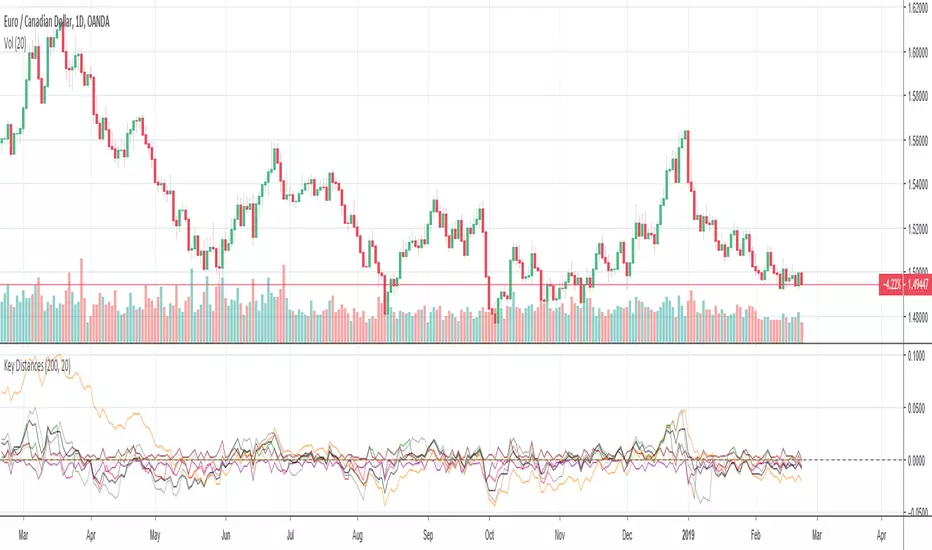
Key Distances (Weekly, Daily Open, & EMA)This indicator provides the pip value from various key levels I've found important in my trading system.
The results are graphed. I suggest that you choose the 2 most important ones you want to graph otherwise the indicator gets difficult to read.
The important data is the actual numbers but I've found it helpful to understand how a ticker moves in regards to weekly open and distance from 200EMA to be most helpful.
Here is the order of the data listed:
Distance from weekly open (green if above open, red if below open, also paints color on line)
Distance from last week opening price
Distance from daily open
Distance to 200EMA
Future Possible Updates:
- customized EMA
- Distance from weekly low/high
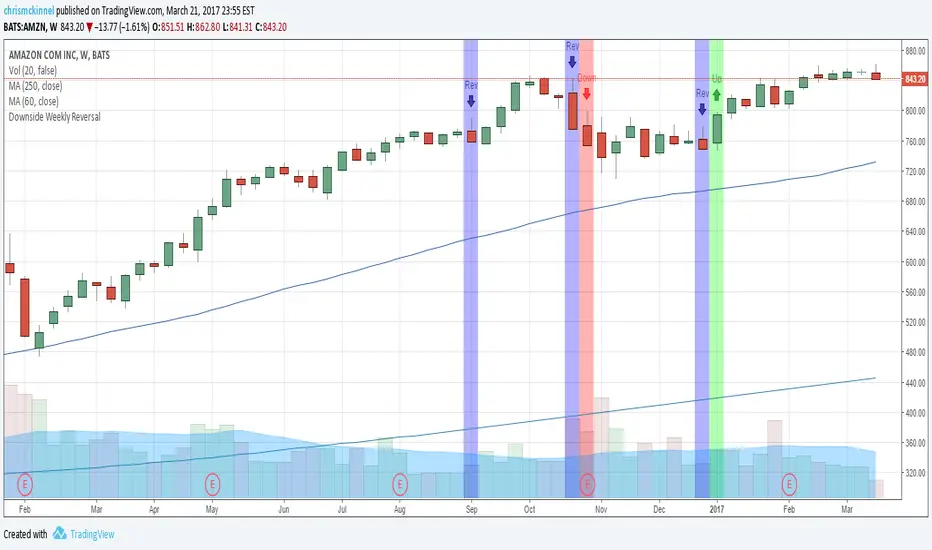
Downside Weekly ReversalBased on Thomas Bulkowski's top ranking small pattern: the Downside Weekly Reversal pattern.
Add this indicator to your weekly charts.
Blue bars represent weekly reversals and green bars following blue bars indicate an upside breakout. These are to be traded in a Bull market.
Red bars following blue bars indicate a downside breakout. These are to be traded in a Bear market.
More details: thepatternsite.com