Recherche dans les scripts pour "weekly"
Weekly Range ProjectionsWeekly Range Projections
Inspired by toodegrees' excellent "ICT Friday's Asian Range" indicator
This indicator is a modified and enhanced version of the original Friday's Asian Range indicator created by toodegrees. While studying their brilliant work, I realized the concept could be expanded beyond just Friday's Asian session to create a more versatile tool for weekly price projections.
What's New?
I've transformed the original concept into a fully customizable range projection tool that allows traders to:
Select Any Day of the Week - Not limited to just Fridays anymore
Define Custom Time Ranges - Set your own start and end times to capture any session (Asian, London, New York, or custom ranges)
Flexible Deviation Levels - Choose between 1-9 standard deviations instead of the fixed 5
Toggle Body/Wick Ranges - Show or hide body and wick projections independently
Updated to Pine Script v6 - Taking advantage of the latest Pine Script features
How It Works
The indicator captures the price range (body and/or wick) during your specified time window on your chosen day, then projects standard deviation levels from that range. These levels often act as significant support/resistance throughout the week.
Use Cases
Weekly Opening Range - Capture Monday's opening range for week-long projections
Session-Based Analysis - Define any session on any day for targeted analysis
Multi-Timeframe Projections - Create different instances for various time ranges
ICT Concepts - Perfect for traders following ICT methodologies with customizable ranges
Credits
Huge thanks to toodegrees for creating the original Friday's Asian Range indicator and sharing it with the community. Their clean code structure and innovative approach to range projections inspired this modification. The core logic and visual presentation style remain true to their original vision, with added flexibility for broader applications.
If you find this useful, please also check out toodegrees' original indicators - they create fantastic tools for the TradingView community!
Settings Guide
Range Settings - Choose your day and define start/end times
Range Type - Toggle body and/or wick ranges
Deviations - Select how many standard deviation levels to display
Styling - Customize colors and line styles for both range types
Alerts - Set up alerts for price crossing specific deviation levels
Remember to use this on 5-minute or 15-minute charts as intended by the original design.
Note: This indicator follows the Mozilla Public License 2.0

Globex, Extended, Daily, Weekly, Monthly, Yearly Range* Adds Right Side Only Price Line & Labels for Tracking without Extending Both Sides
* Tracks Current, Previous, and Two Previous Globex Sessions/ Futures:
* Tracks Current, Previous, and Two Previous Extended Session/ Stocks:
* Tracks Current, Previous, Two, & Three Previous Day Session/ Equities:
* Tracks Current, Last, Two, Three, Four, & Five Week Session/ Equities:
* Tracks Current, Last, Two, Three, Four, & Five Month Session/ Equities:
* Tracks Current, Last, Two, Three, Four, & Five Year Session/ Equities:
* Allows Custom Range on Globex, Extended, & Daily Sessions
* Allows Custom Range on Weekly, Monthly, & Yearly Sessions
* Lines & Labels Are Not Visible on Chart Scales
* Reversible Text & Background Color
* Lines Extend Accordingly with Range
* Labels show Price & Percent Change
* Background Colors should match Chart Color to avoid Overlapping Text & Labels
* Lines have Offset Extension
* Labels have Offset Extension
* Globex Session is only visible on Futures & if Current Timeframe is Intraday
* Extended Session is only visible on Stocks & if Current Timeframe is Intraday
* Daily, Weekly, Monthly, & Yearly Sessions are visible on All Symbols & All Timeframes
* Globex, Extended, & Regular use their Default Time Sessions but allow Customization
* For Back Testing Default Sessions, switch over on the Menu to Style and Turn On/Off their Background Color; Any Area on the Chart Without Background Color is Regular Session

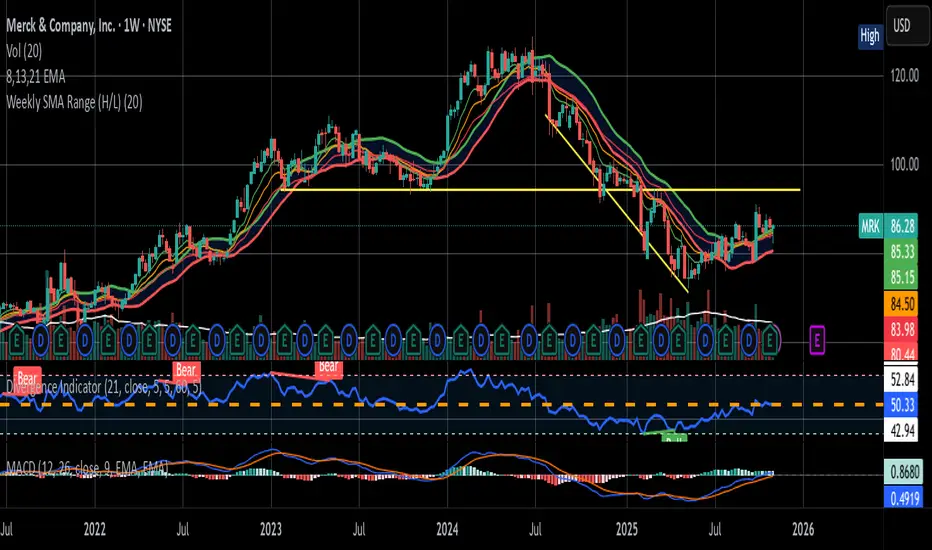
Daily Monday Weekly Monthly Quarterly Yearly High Low Mid This indicator can be useful for traders who are interested in analyzing price movements over different time periods. By displaying the daily, Monday, weekly, monthly, quarterly, and yearly high and low values along with their mid values on a chart, traders can get a better understanding of how prices have behaved over longer periods of time.
For example, a trader might use this information to identify trends or patterns in the market. They might look for occasions when the daily high and low values move outside of an established range or when the weekly or monthly mid values cross certain key levels. This could signal a potential change in the market trend that the trader could act upon.
Additionally, the code can help traders identify key support and resistance levels based on the high and low values of the candles. By plotting these values on a chart, traders can see where prices tend to find support or resistance over different time periods. This information can be used to place stop loss orders or take profit orders at important levels.
Overall, the benefit of using the code you provided is that it offers traders a comprehensive view of price movements over different time periods, which can aid in making more informed trading decisions.
Each level described above has its own unique label, which is abbreviated for convenience. These abbreviations are listed below for quick reference:
For daily levels: DH (Daily High), DM (Daily Mid), and DL (Daily Low)
For Monday levels: MonH (Monday High), MonM (Monday Mid), and MonL (Monday Low)
For monthly levels: MH (Monthly High), MU50 (Monthly 50 percent of Mid and High), MM (Monthly Mid), MD50 (Monthly 50 percent of Mid and Low), and ML (Monthly Low)
For quarterly levels: 3MH (Quarterly High), 3MU50 (Quarterly 50 percent of Mid and High), 3MM (Quarterly Mid), 3MD50 (Quarterly 50 percent of Mid and Low), and 3ML (Quarterly Low)
For yearly levels: YH (Yearly High), YU50 (Yearly 50 percent of Mid and High), YM (Yearly Mid), YD50 (Yearly 50 percent of Mid and Low), and YL (Yearly Low)
These labels can help you quickly identify the different levels and keep track of important price points.
If the chosen timeframe does not fall under the category of intraday, daily and Monday level will not be displayed.
Please feel free to send your suggestions to @z_mehran.

Strategy weekly results as numbers v1This script is based on an idea of monthly statistics that have been found across tradingview community scripts. This is an improved version with weekly results with the ability to define the size of every group (number of weeks within one group).
Initial setup of the strategy
1. Set the period to calculate the results between.
2. Set the statistic precision and group size.
3. Enable "Recalculate" → "On every tick" under the strategy "Properties" section.
The logic under the hood
1. Get the period between which to calculate the strategy.
2. Calculate the first day of the first week within the period.
3. Calculate the latest day of the latest week within the period.
4. Calculate the results of the selected period.
5. Group the values by the defined number of cells.
6. Calculate the summary of every group.
7. Render the table.
Please, be careful . To use this tool you will need to enable the "Recalculate" → "On every tick" option but it means that your strategy will be executed on every tick instead of bar close. It can cause unexpected results in your strategy behaviour.

Know your Monthly, Weekly, Daily LevelsThis script will show monthly, weekly and daily (with or without pre market) levels on your intraday chart. You can chose what values of the corresponding candles (high, low, close) should be included.
Please consider following limitations:
1. Maximum of 500 drawing objects per chart
To make sure the most relevant levels are shown, values are sorted based on the latest close value before levels > 500 are cut off.
2. Lookback history
The max lookback history is limited by the currently selected timeframe. E.g. on a 5min timeframe, 20000 bars (Premium Plan) result in approx. 5 months of lookback period, meaning you may want to have a 30 min or higher chart open to get a complete picture of levels, while trading on a lower timeframe.
High/Low/Open/Close Daily, Weekly, Monthly Line
I wrote this for the purpose of saving time while marking up charts by automating the process of drawing and labeling lines at areas of interest on larger
timeframes while still having the option to change the style and size of the lines and labels to adjust for any timeframe and avoid a messy chart.
I also used this as an exercise in menu organization giving users every imaginable option and producing clean readable code.
- This indicator draws a line on the Daily, Weekly, and Monthly bar at the High, Low, Open and Close of each bar as price
tends to react when revisiting these areas.
- Each set of bars has an optional identifying label with its own color set that can be shown with or without the lines
price value, and has drop down menus for size and style of each set of labels.
- Each set of lines has inputs for line/text color, line width and style, and can be hidden if the user doesn't have the need for any particular timeframe.
- Lines and Labels with delete when a new line is created.
- I recommend going into Chart Settings/Status Line and turning off indicator arguments OR moving the script to the top
of the indicator list to avoid an obstructed chart view with this indicators arguments. When Pine allows, I will update it to hide them.
Contains some public domain code from T.V. manuals and tutorial for creating drop down input menus for options.
/ ~For My Pal Jittery~
~ Who likes his clean chart and custom colors~

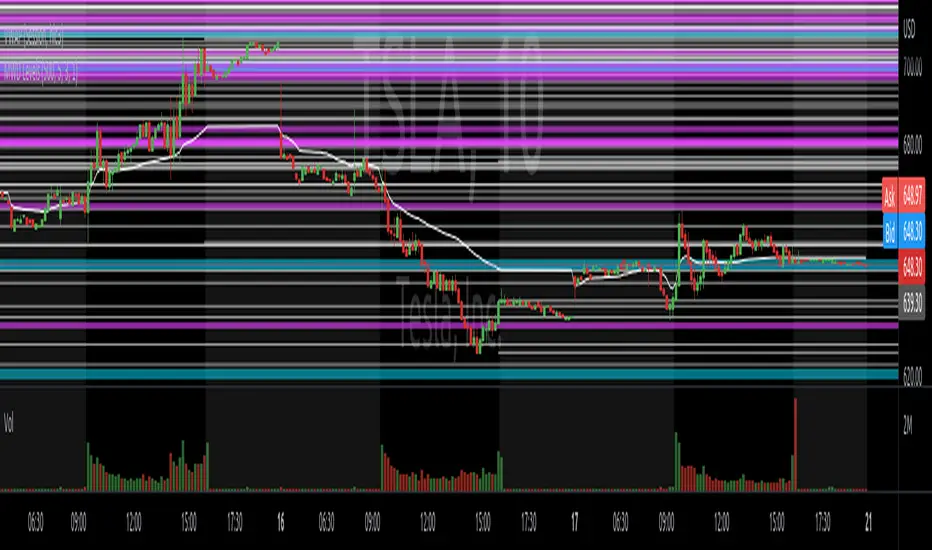
Key Levels (Time Frames - Weekly,Monthly,Quarterly,Yearly)This indicator plots the 4h, Daily, Weekly, Monthly, Quarterly, Yearly Open High, Low and Mids.
You can watch how these institutional trading levels work as support and resistance.
Most Important you can add alerts to these levels with a few clicks.
Just add/remove unnecessary levels for scaling problems.
For any error/suggestion/improvement just let me know.

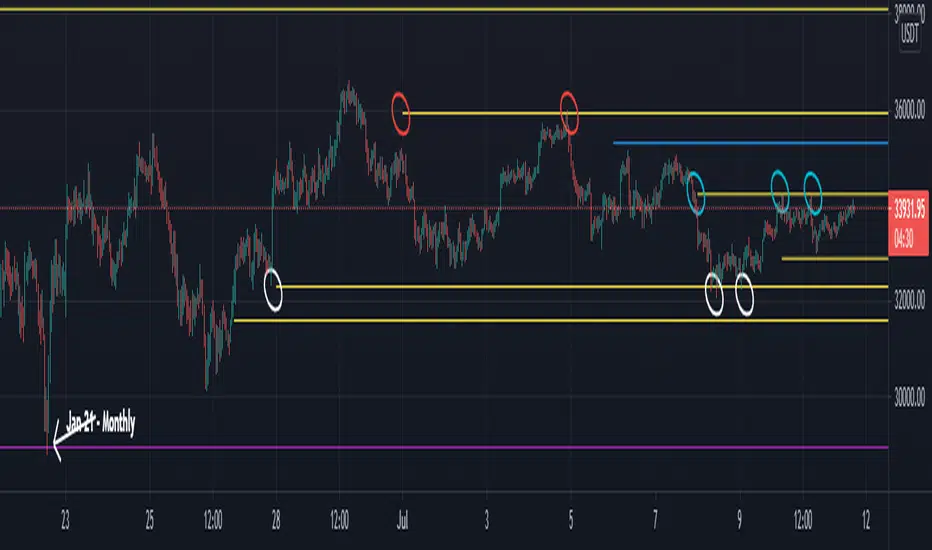
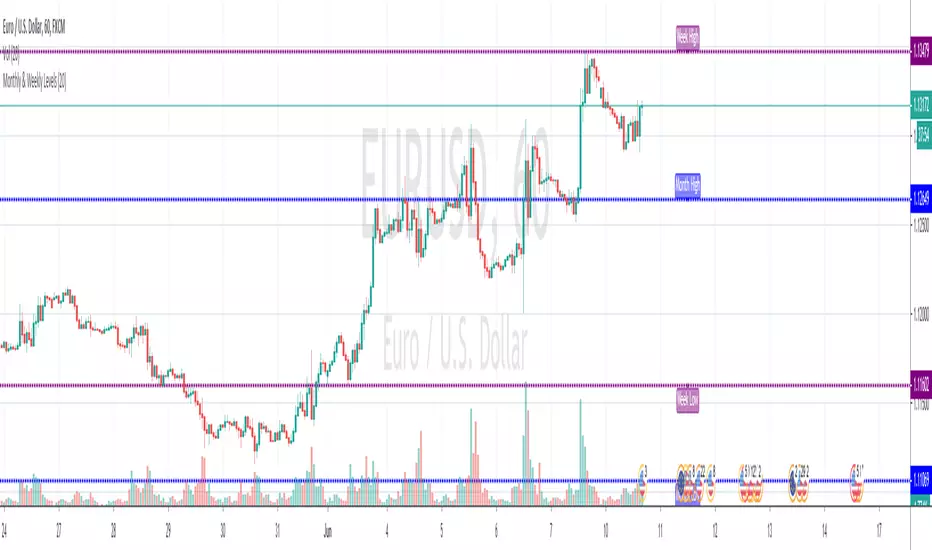
Naked - Daily Weekly MonthlyUser request for Naked Daily Weekly Monthly Opens.
This indicator plots the Daily Weekly Opens (the day after day after creation), they then will stay on the chart until a candle close is completed on the other side of the plot.
In the above chart picture you can see how previous monthly and daily opens have acted as support and resistance.
Thanks go to:
StackOverFlow Bjorn Mistiaen
RVC-Weekly-Pivots-GANN-LevelsPurpose:
Weekly - Fibonacci pivot levels and Gann levels calculation and marking on Chart automatically.
Mainly expected to use for trading on NIFTY and BankNifty
Kindly share your comments and suggestions to improve

Monthly & Weekly LevelsShows and labels the previous monthly and weekly highs and lows, which are generally great areas to trade off. Loads quick and there's an option to hide the labels if they don't float your boat
Weekly VWAP (ETH to RTH) - OHLC4Weekly vwap with standard deviations. The vwap will carry over ETH data into RTH when RTH mode is turned on.

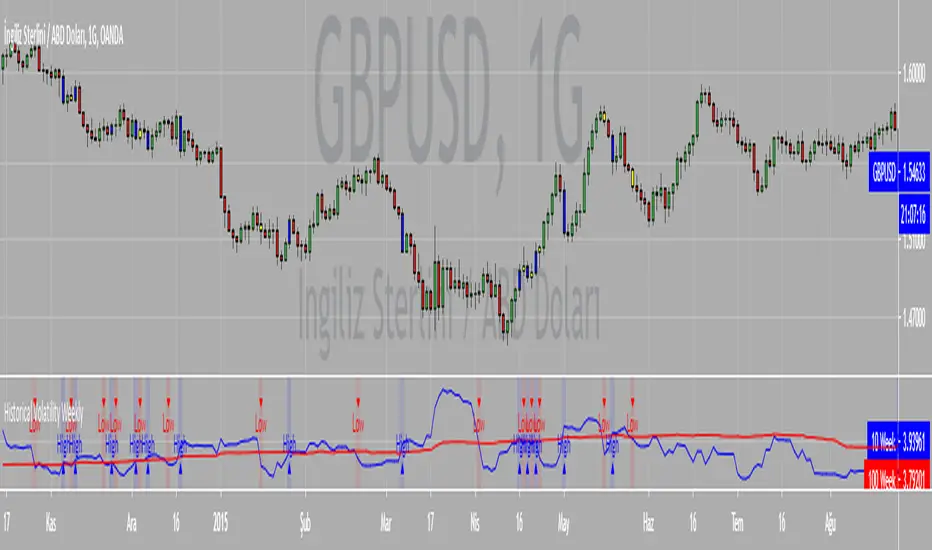
Weekly Moving Averages (MAs) to Intraday ChartWeekly Moving Averages to Intraday Chart. Helpful for long term analysis and for day trading during steep market drawdowns.

Weekly Range & Trend (Signed)Weekly Trend & Range is basically calculated every week.
It helps to get a broad idea whether coming week market can be directional , volatile or range bound action. So this helps me to get a hint which style of approach should be given more important on positional basis like directional or non-directional.
I mostly track in NSE:BANKNIFTY , NSE:NIFTY , BSE:SENSEX
For example:
Average range difference of past 4 weeks is bigger in compare to current week range difference means good chance for directional opportunities.
Average range difference of past 4 weeks is lesser in compare to current week range difference means good chance for non-directional opportunities.
Directional or Non-directional hint is been shown in terms of probability . So based on this i plan my week and trades.

Weekly BiasWeekly Bias
For H1 time frame and below.
Horizontal Line Plots every week.
Condition for line is 12am EST on Monday.
Price above, line is green~ potential bullishness.
Price below, line is red~ potential bearishness.
This line gives us potential sentiment for any given week on any given forex market.
If you have any questions, or want access to other indicators, please message me.

Weekly EMA Squeeze (Bullish + Bearish)Purpose
The Weekly EMA Squeeze indicator identifies periods where price is compressing tightly around a cluster of weekly EMAs and then flags when that compression resolves with directional bias. It is designed to surface high-timeframe inflection points where trends are most likely to begin or meaningfully change.
This indicator operates entirely on weekly data, even when viewed on lower timeframes.
________________________________________
Core Components
1. Weekly EMA Cluster
• Uses three weekly EMAs (fast / mid / slow)
• Compression is defined by:
o Tight EMA spread
o Reduced weekly volatility (ATR contraction)
• Represents balance and indecision at a higher timeframe
2. Bullish Weekly EMA Squeeze
Triggered when:
• EMAs are tightly compressed
• Price is holding above or within the EMA cluster
• EMA slopes flatten or turn upward (optional filter)
• Optional requirement: weekly close above EMA cluster
Displayed as:
• Green upward triangles
• Green vertical shaded band marking the squeeze event window
3. Bearish Weekly EMA Squeeze
Triggered when:
• EMAs are tightly compressed
• Price is holding below or within the EMA cluster
• EMA slopes flatten or turn downward (optional filter)
• Optional requirement: weekly close below EMA cluster
Displayed as:
• Red downward triangles
• Red vertical shaded band marking the squeeze event window
4. Vertical Shaded Event Bands
• Each squeeze event (bull or bear) is visually marked with a vertical shaded region
• Shading appears on every qualifying event, including consecutive ones
• Purpose: clearly identify when the market entered a compressed, directional decision state
________________________________________
What the Indicator Is Signaling
• Compression + directional bias, not immediate breakouts
• Transition points between:
o Range → trend
o Trend → reversal
o Trend → re-acceleration after consolidation
This indicator does not attempt to predict magnitude — it identifies timing and regime change risk.
________________________________________
How to Use It
Best used for:
• High-timeframe bias setting
• Filtering lower-timeframe signals
• Identifying when to stop fading price
• Recognizing when volatility expansion is likely
Typical interpretations:
• Bullish squeeze → bias shifts upward; favor long exposure
• Bearish squeeze → bias shifts downward; favor defensive or short exposure
• Multiple squeezes in same direction → trend reinforcement
• Rapid bull ↔ bear flips → higher-timeframe indecision
________________________________________
What It Is Not
• Not an entry trigger by itself
• Not a momentum oscillator
• Not a replacement for breakout confirmation
This indicator answers:
“Is the weekly market coiling, and in which direction is pressure building?”

Weekly Breakout Confirm + RS vs BTC + VolumePurpose
The Weekly Breakout Confirmation indicator validates whether price has structurally exited a prior weekly range and whether that breakout is supported by volume expansion and relative strength vs BTC.
It is a regime confirmation tool, designed to separate real breakouts from false ones.
________________________________________
Core Components
1. Weekly Donchian Channel
• Upper band (green): prior weekly range high
• Lower band (red): prior weekly range low
• Calculated on weekly data with no repainting
These levels define the structural range the market must escape to enter a new regime.
________________________________________
2. Weekly Breakout (W BO)
Triggered when:
• Weekly close breaks above the upper Donchian band
• Volume confirms expansion
• Optional filter: relative strength vs BTC is rising
Displayed as:
• Bullish breakout marker
• Green structure line remains on chart as reference
________________________________________
3. Weekly Breakdown (W BD)
Triggered when:
• Weekly close breaks below the lower Donchian band
• Volume confirms expansion
• Optional filter: relative strength vs BTC is weakening
Displayed as:
• Bearish breakdown marker
• Red structure line remains on chart as reference
________________________________________
4. Relative Strength vs BTC
• Measures asset performance relative to BTC on a weekly basis
• Helps identify:
o True altcoin leadership
o False breakouts driven only by BTC beta
• Optional requirement for breakout validation
________________________________________
5. Volume Confirmation
• Weekly volume must exceed a moving average threshold
• Filters out low-participation breakouts
• Ensures institutional-grade participation
________________________________________
What the Indicator Is Signaling
• Confirmed regime transitions
• Entry into:
o Sustained trends
o Distribution phases
o Structural breakdowns
Once a breakout is confirmed:
• The prior range is invalidated
• The green/red line becomes support/resistance reference, not a trigger
________________________________________
How to Use It
Best used for:
• Determining whether the market is trending or ranging
• Confirming whether weekly EMA squeezes are actionable
• Managing exposure duration and risk tolerance
Interpretation framework:
• W BO + rising RS + volume → trend acceptance
• W BO without RS → BTC-driven move (lower confidence)
• No recent W BO / W BD → consolidation regime
• W BD → risk-off, defensive posture

Weekly High/Low Weekday Stats by [M1rage]Патч: условная статистика по дню недельного экстремума
Добавлена новая функция, позволяющая строить условное распределение по дням недели.
Что нового.
Два новых параметра в настройках:
Condition: Weekly High on — зафиксировать день недели, в который сформировался недельный High.
Condition: Weekly Low on — зафиксировать день недели, в который сформировался недельный Low.
Таблица автоматически перестраивается:
Левая колонка показывает — вероятности минимума недели при выбранном дне максимума.
Правая колонка показывает — вероятности максимума недели при выбранном дне минимума.
В заголовках колонок появляется подпись формата:
Weekly Low | High=Tue
Weekly High | Low=Thu
---------------------------------------------------------------------------------------------------------------------
Patch: Conditional Statistics by Day of the Weekly Extremum
A new feature has been added that builds a conditional distribution by weekdays.
What’s new
Two new settings:
Condition: Weekly High on — fix the weekday on which the weekly High formed.
Condition: Weekly Low on — fix the weekday on which the weekly Low formed.
The table updates automatically:
Left column — probabilities of the weekly Low given the selected day of the High.
Right column — probabilities of the weekly High given the selected day of the Low.
Column headers now display labels in the format:
Weekly Low | High=Tue
Weekly High | Low=Thu
Weekly Open (Current Week Only)📘 Indicator Name: Weekly Open (Current Week Only)
📝 Description:
This indicator plots a horizontal line representing the weekly open price, visible only during the current trading week. At the beginning of each new week (based on TradingView’s weekly time segmentation), the indicator captures the open price of the first candle and draws a constant line across the chart until the week ends. Once the new week begins, the line resets and updates with the new weekly open.
🎯 How to Use – ICT Concepts Integration (Weekly Profile):
This tool is designed to complement ICT (Inner Circle Trader) trading strategies, particularly within the weekly profile framework, by offering a clear and persistent visual of the weekly open, which is a critical reference point in ICT’s market structure theory.
✅ Use Cases:
Directional Bias:
According to ICT concepts, price trading above the weekly open suggests a bullish bias for the week, while trading below it implies bearish conditions.
Traders can use the weekly open line to align their intraweek trades with higher timeframe directional bias.
Dealing Ranges:
Weekly open helps frame the weekly dealing range, especially when combined with other levels like weekly high/low or previous week’s range.
It allows traders to identify potential liquidity pools or areas where price may seek to rebalance.
Mean Reversion Entries:
Price often reverts to or reacts from the weekly open. Traders may use this as a target or entry level, particularly during Monday/Tuesday setups.
Works well in conjunction with concepts like OTE (Optimal Trade Entry) and Judas Swings.
Risk Management:
Acts as a clean and visual anchor to structure stop losses or take-profits based on weekly bias shifts.

Weekly H/L DOTWThe Weekly High/Low Day Breakdown indicator provides a detailed statistical analysis of the days of the week (Monday to Sunday) on which weekly highs and lows occur for a given timeframe. It helps traders identify recurring patterns, correlations, and tendencies in price behavior across different days of the week. This can assist in planning trading strategies by leveraging day-specific patterns.
The indicator visually displays the statistical distribution of weekly highs and lows in an easy-to-read tabular format on your chart. Users can customize how the data is displayed, including whether the table is horizontal or vertical, the size of the text, and the position of the table on the chart.
Key Features:
Weekly Highs and Lows Identification:
Tracks the highest and lowest price of each trading week.
Records the day of the week on which these events occur.
Customizable Table Layout:
Option to display the table horizontally or vertically.
Text size can be adjusted (Small, Normal, or Large).
Table position is customizable (top-right, top-left, bottom-right, or bottom-left of the chart).
Flexible Value Representation:
Allows the display of values as percentages or as occurrences.
Default setting is occurrences, but users can toggle to percentages as needed.
Day-Specific Display:
Option to hide Saturday or Sunday if these days are not relevant to your trading strategy.
Visible Date Range:
Users can define a start and end date for the analysis, focusing the results on a specific period of interest.
User-Friendly Interface:
The table dynamically updates based on the selected timeframe and visibility of the chart, ensuring the displayed data is always relevant to the current context.
Adaptable to Custom Needs:
Includes all-day names from Monday to Sunday, but allows for specific days to be excluded based on the user’s preferences.
Indicator Logic:
Data Collection:
The indicator collects daily high, low, day of the week, and time data from the selected ticker using the request.security() function with a daily timeframe ('D').
Weekly Tracking:
Tracks the start and end times of each week.
During each week, it monitors the highest and lowest prices and the days they occurred.
Weekly Closure:
When a week ends (detected by Sunday’s daily candle), the indicator:
Updates the statistics for the respective days of the week where the weekly high and low occurred.
Resets tracking variables for the next week.
Visible Range Filter:
Only processes data for weeks that fall within the visible range of the chart, ensuring the table reflects only the visible portion of the chart.
Statistical Calculations:
Counts the number of weekly highs and lows for each day.
Calculates percentages relative to the total number of weeks in the visible range.
Dynamic Table Display:
Depending on user preferences, displays the data either horizontally or vertically.
Formats the table with proper alignment, colors, and text sizes for easy readability.
Custom Value Representation:
If set to "percentages," displays the percentage of weeks a high/low occurred on each day.
If set to "occurrences," displays the raw count of weekly highs/lows for each day.
Input Parameters:
High Text Color:
Color for the text in the "Weekly High" row or column.
Low Text Color:
Color for the text in the "Weekly Low" row or column.
High Background Color:
Background color for the "Weekly High" row or column.
Low Background Color:
Background color for the "Weekly Low" row or column.
Table Background Color:
General background color for the table.
Hide Saturday:
Option to exclude Saturday from the analysis and table.
Hide Sunday:
Option to exclude Sunday from the analysis and table.
Values Format:
Dropdown menu to select "percentages" or "occurrences."
Default value: "occurrences."
Table Position:
Dropdown menu to select the table position on the chart: "top_right," "top_left," "bottom_right," "bottom_left."
Default value: "top_right."
Text Size:
Dropdown menu to select text size: "Small," "Normal," "Large."
Default value: "Normal."
Vertical Table Format:
Checkbox to toggle the table layout:
Checked: Table displays days vertically, with Monday at the top.
Unchecked: Table displays days horizontally.
Start Date:
Allows users to specify the starting date for the analysis.
End Date:
Allows users to specify the ending date for the analysis.
Use Cases:
Day-Specific Pattern Recognition:
Identify if specific days, such as Monday or Friday, are more likely to form weekly highs or lows.
Seasonal Analysis:
Use the start and end date filters to analyze patterns during specific trading seasons.
Strategy Development:
Plan day-based entry and exit strategies by identifying recurring patterns in weekly highs/lows.
Historical Review:
Study historical data to understand how market behavior has changed over time.
TradingView TOS Compliance Notes:
Originality:
This script is uniquely designed to provide day-based statistics for weekly highs and lows, which is not a common feature in other publicly available indicators.
Usefulness:
Offers practical insights for traders interested in understanding day-specific price behavior.
Detailed Description:
Fully explains the purpose, features, logic, input settings, and use cases of the indicator.
Includes clear and concise details on how each input works.
Clear Input Descriptions:
All input parameters are clearly named and explained in the script and this description.
No Redundant Functionality:
Focused specifically on tracking weekly highs and lows, ensuring the indicator serves a distinct purpose without unnecessary features.

Weekly High/Low Day BreakdownThe "Weekly High/Low Day Breakdown" is a tool designed to help identify patterns in market behaviour by analysing the days of the week when weekly highs and lows occur. This indicator calculates the frequency and percentage of weekly highs and lows for each day from Monday to Sunday within the visible range of your chart.
Features:
Weekly Analysis: Calculates weekly highs and lows based on daily open high and low prices from Monday to Sunday.
Day-Specific Breakdown: Tracks which day of the week each weekly high and low occurred.
Visible Range Focus: Only considers data within the current visible range of your chart for precise analysis.
Interactive Table Display: Presents the results in an easy-to-read table directly on your chart.
How It Works:
Data Collection: Fetches daily high, low, day of the week, and time data regardless of your chart's timeframe. Uses these daily figures to determine the weekly high and low for each week.
Weekly Tracking: Monitors the day of the week when the weekly high and low prices occur. Resets tracking at the end of each week (Sunday).
Visible Range Analysis: Only includes weeks that fall entirely within the visible time range of your chart. Ensures that the analysis is relevant to the period you are focusing on.
Percentage Calculation: Counts the occurrences of weekly highs and lows for each day. Calculates the percentage based on the total number of weeks in the visible range.
Result Display: Generates a table with days of the week as columns and "Weekly High" and "Weekly Low" as rows. Displays the percentage values, indicating how often highs and lows occur on each day.
How to Use:
Add the Indicator: Apply the "Weekly High/Low Day Breakdown" indicator to your TradingView chart.
Adjust Visible Range: Zoom in or out to set the desired visible time range for your analysis.
Interpret the Table:
Columns: Represent days from Monday to Sunday.
"Weekly High" Row: Shows the percentage of times the weekly high occurred on each day. "Weekly Low" Row: Shows the percentage of times the weekly low occurred on each day.
Colors: Blue text indicates high percentages, red text indicates low percentages.
Example Interpretation:
If the table shows a 30% value under "Tuesday" for "Weekly High," it means that in 30% of the weeks within the visible range, the highest price of the week occurred on a Tuesday.
Similarly, a 40% value under "Friday" for "Weekly Low" indicates that 40% of the weekly lows happened on a Friday.
