Setup 9.2 - Larry Williams---IN-US---
Hi traders, this simple setup was created by the professional Trader Larry Willians.
This trade system is based on 9 EMA.
Setup EMA 9.2
1) Find a stock with 9 EMA uptrend.
2) Wait for a close below the last candle low and mark the high of it candle.
3) If the price doesnt across the high, mark the next high.
4) Buy when the price cross the mark.
5) Stop-loss in the low of the marked candle.
---PT-BR---
Olá traders, setup universal, criado pelo famoso Trader Larry Williams, e divulgado pelo Trader Palex. Setup baseado na MME de 9 períodos.
Setup MME 9.2
1) Achar ativo com a MME9 subindo;
2) Aguardar fechamento abaixo da mínima do candle anterior e marcar a máxima desse candle;
3) Se a máxima não for rompida, marcar a próxima máxima;
4) Compra no rompimento dessa máxima (qualquer negócio acima dessa máxima);
5) Stop na mínima do candle anterior ao que gerou a entrada;
Bons trades.
Recherche dans les scripts pour "williams"

Cryptopeep RSI, Stochastic RSI, Stochastic and Williams %R, 4in14 Charts all in one chart, RSI, Stochastic RSI, Stochastic and Williams %R
Hope you like, please let me know your thoughts.
If you would like to be kept up to date please FOLLOW us and try our indicators and strategies here: uk.tradingview.com
If you like it please click the LIKE button.

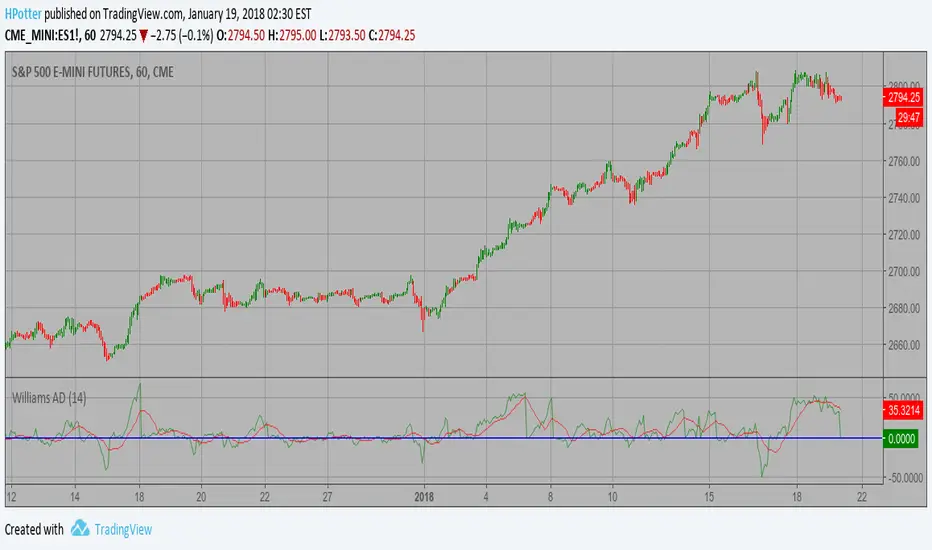
Smoothened Williams A/D Strategy Accumulation is a term used to describe a market controlled by buyers;
whereas distribution is defined by a market controlled by sellers.
Williams recommends trading this indicator based on divergences:
Distribution of the security is indicated when the security is making
a new high and the A/D indicator is failing to make a new high. Sell.
Accumulation of the security is indicated when the security is making
a new low and the A/D indicator is failing to make a new low. Buy.
WARNING:
- This script to change bars colors.
Colored Williams %RThis script is the same as Williams %R except that on green days we plot green and red on red days. If a bar opens and closes the same, we plot black.

COT Williams Indicator by BWThis indicator can be thrown on any future contract (such as ES, GC, ZW, ZL, E6, PR, ZC etc.). It shows the Williams Indicator as defined in his book "Trad Stocks Commodities with the Insiders" (2005).

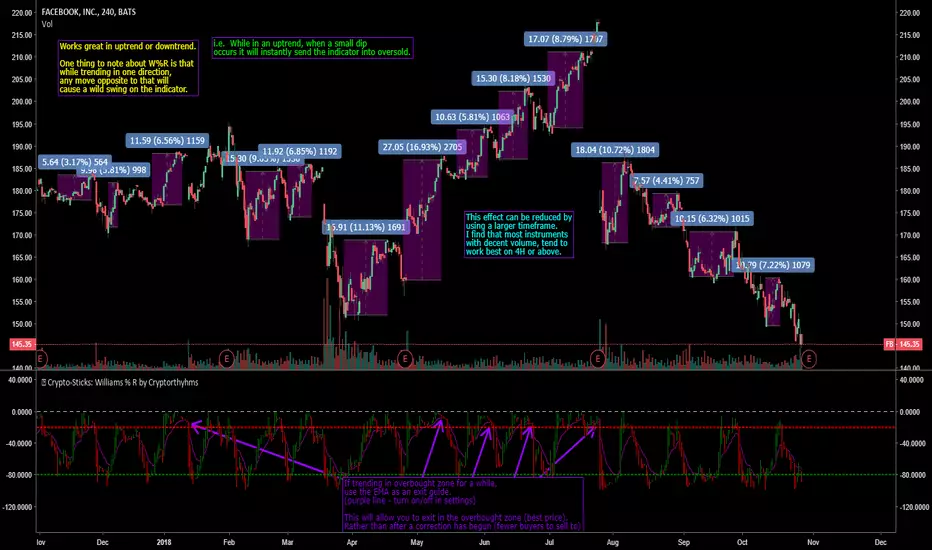
🥢Crypto-Sticks: Williams % R by Cryptorthyhms🥢 Crypto-Sticks™ Williams %R
A new series of indicators brought to you by Cryptorthyhms...giving you an alternate look at your trusted favorites! Follow me, there are still 2 dozen Crypto-Sticks indicators planned - all will be released in public library.
🚀 Indicator Specific Info
New in this indicator is an EMA of the average signal line output. Eventually I will go back and update the previous indicators with this feature as well!
⛔Please remember that you may have to adjust the overbought and oversold levels to suit the volatility of the instrument you are working with. In the future I will implement a feature that does this automatically, but for now its manual.
Heiken Ashi candles (default) adds some more clear trend changing points which can be executed at the second candle going in either direction. Other coins/charts will require their own strategy - you could potentially have to tweak that parameter. In this example you would enter on 2nd green, exit on 2nd red.
Volume weighting the HA candles adds a different dimension to the indicator which I have to explore more fully. With W%R I find it to be an interesting transformation of the output. The indicator tends to stay in overbought ranges longer, and only dips quickly to oversold. The opposite is also true in a downtrend. In this example I would personally increase the overbought zone and decrease the oversold zone to match up better with the historical results. An example of VW+HA:
Enjoying this indicator or find it useful? Please give me a like and follow! There are many more indicators to be released in this series, not to mention I post crypto analysis and other free indicators regularly.
Questions? Comments? Want to get access to an entire suite of proven trading indicators? Come visit us on telegram and chat, or just soak up some knowledge. We make timely posts about the market, news, and strategy everyday. Our community isn't open only to subscribers - everyone is welcome to join.
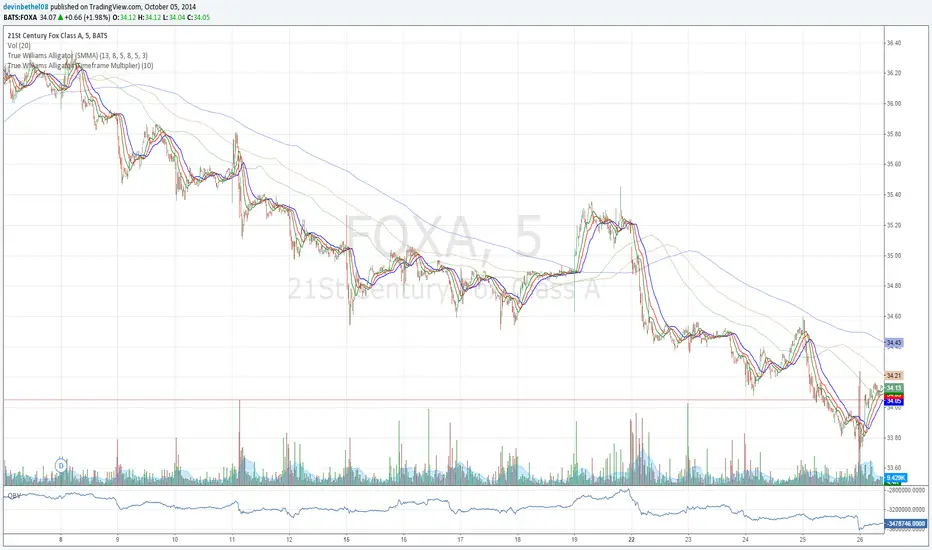
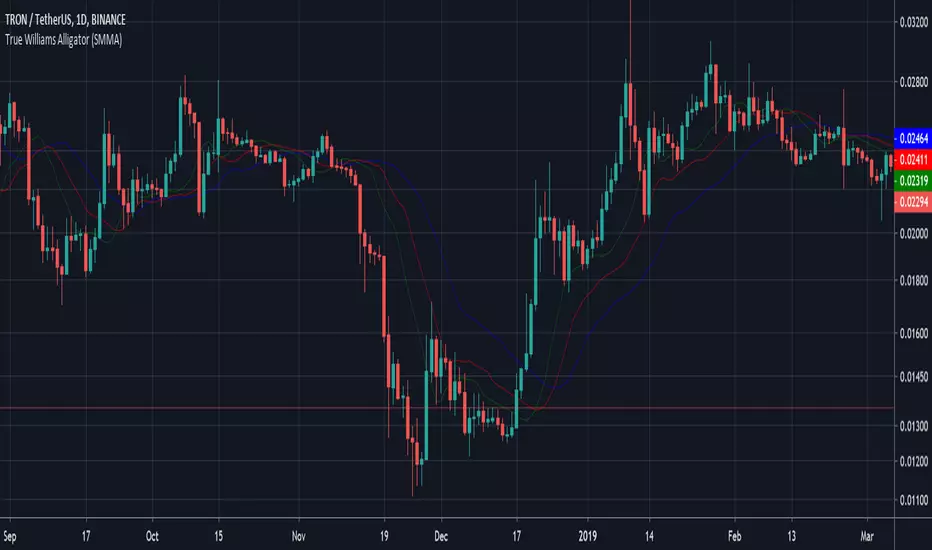
True Williams Alligator (Timeframe Multiplier)Modified version of my original "True Williams Alligator (SMMA)" indicator that includes a multiplier to show the alligator (ie elliot wave mode) of higher timeframes. See original indicator for details.
Note: First script submission. Didn't mean to use this chart. Ugly and messy. Oops.
Williams Squat BarsSquat bars are a battle of the bulls and the bears, with lots of buying and selling but little price movement.
A squat bar will be one of the top three OR bottom three bars 85% of the time at the end of a trend.
While all trends end with a squat, all squats are NOT the end of a trend.

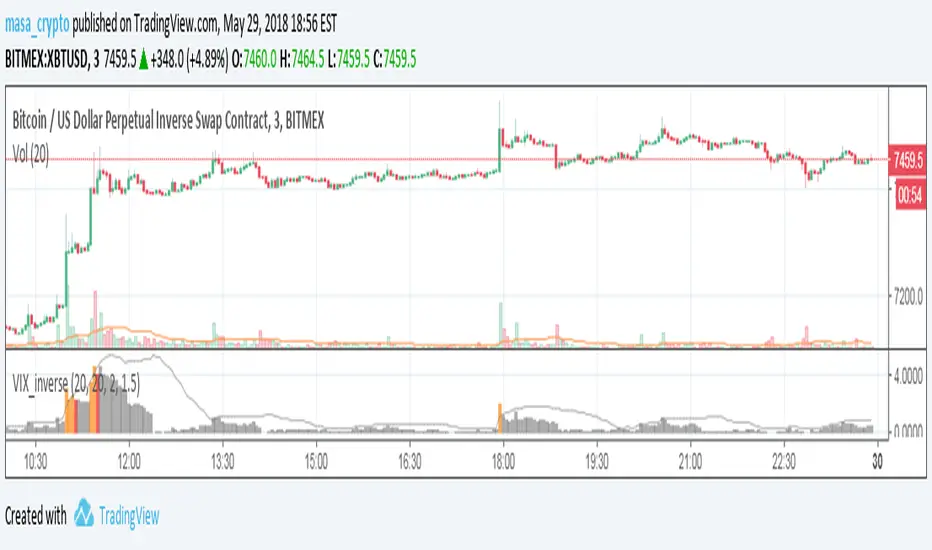
Williams Vix Fix ultra complete indicator (Tartigradia)Williams VixFix is a realized volatility indicator developed by Larry Williams, and can help in finding market bottoms.
Indeed, as Williams describe in his paper, markets tend to find the lowest prices during times of highest volatility, which usually accompany times of highest fear. The VixFix is calculated as how much the current low price statistically deviates from the maximum within a given look-back period.
Although the VixFix originally only indicates market bottoms, its inverse may indicate market tops. As masa_crypto writes : "The inverse can be formulated by considering "how much the current high value statistically deviates from the minimum within a given look-back period." This transformation equates Vix_Fix_inverse. This indicator can be used for finding market tops, and therefore, is a good signal for a timing for taking a short position." However, in practice, the Inverse VixFix is much less reliable than the classical VixFix, but is nevertheless a good addition to get some additional context.
For more information on the Vix Fix, which is a strategy published under public domain:
* The VIX Fix, Larry Williams, Active Trader magazine, December 2007, web.archive.org
* Fixing the VIX: An Indicator to Beat Fear, Amber Hestla-Barnhart, Journal of Technical Analysis, March 13, 2015, ssrn.com
* Replicating the CBOE VIX using a synthetic volatility index trading algorithm, Dayne Cary and Gary van Vuuren, Cogent Economics & Finance, Volume 7, 2019, Issue 1, doi.org
Created By ChrisMoody on 12-26-2014...
V3 MAJOR Update on 1-05-2014
tista merged LazyBear's Black Dots filter in 2020:
Extended by Tartigradia in 10-2022:
* Can select a symbol different from current to calculate vixfix, allows to select SP:SPX to mimic the original VIX index.
* Inverse VixFix (from masa_crypto and web.archive.org)
* VixFix OHLC Bars plot
* Price / VixFix Candles plot (Pro Tip: draw trend lines to find good entry/exit points)
* Add ADX filtering, Minimaxis signals, Minimaxis filtering (from samgozman )
* Convert to pinescript v5
* Allow timeframe selection (MTF)
* Skip off days (more accurate reproduction of original VIX)
* Reorganized, cleaned up code, commented out parts, commented out or removed unused code (eg, some of the KC calculations)
* Changed default Bollinger Band settings to reduce false positives in crypto markets.
Set Index symbol to SPX, and index_current = false, and timeframe Weekly, to reproduce the original VIX as close as possible by the VIXFIX (use the Add Symbol option, because you want to plot CBOE:VIX on the same timeframe as the current chart, which may include extended session / weekends). With the Weekly timeframe, off days / extended session days should not change much, but with lower timeframes this is important, because nights and weekends can change how the graph appears and seemingly make them different because of timing misalignment when in reality they are not when properly aligned.

Williams Fractals + SMMAwilliams fractail + smoothed moving average. moving average. williams fractails with moving average , williams fractails + MA, smma

Williams A/D IndicatorWilliams A/D Indicator, with three choices of ema (regular, double, and zero-lag). Running sum of positive accumulation values (buying pressure) and negative distribution values (selling pressure), as determined by price's location within a given day's true range. Williams states that it is worth selling if the price makes a new high and the indicator fails to follow suit. As well, it's better to purchase if prices fall to a new bottom while the A/D indicator fails to reach a new low.


Williams_VIX_fix_inverseThe volatility index, Williams vix fix developed by Larry Williams, is a well-known index for finding market bottoms. It describes how much the current low price statistically deviates from the maximum within a given look-back period.
The inverse can be formulated by considering "how much the current high value statistically deviates from the minimum within a given look-back period." This transformation equates Vix_Fix_inverse. This indicator can be used for finding market tops, and therefore, is a good signal for a timing for taking a short position.
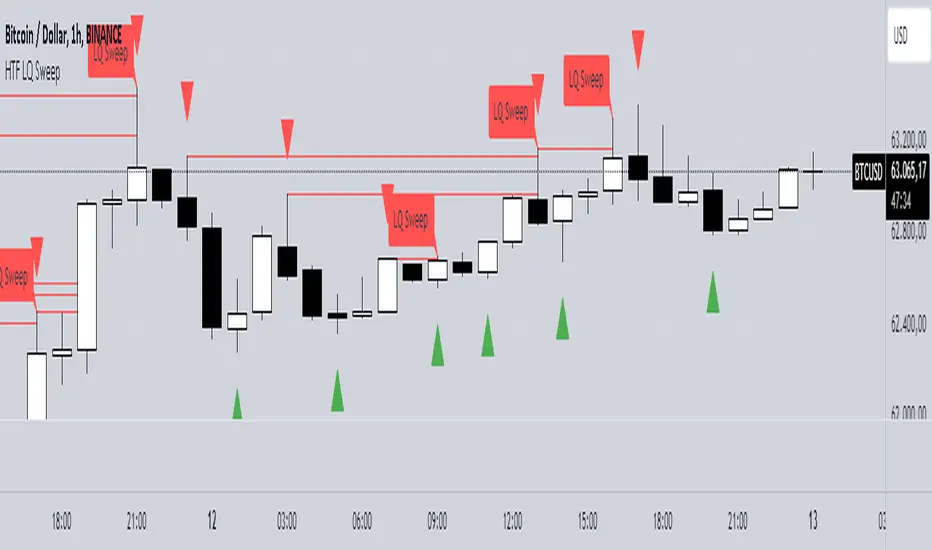
HTF LQ SweepThe following script recognises QL sweeps in the desired time frame with alarm function!
Theory:
There is liquidity above highs and below lows. If this is tapped and the market reacts strongly immediately, the probability of a reversal is greatly increased! In the chart, this is defined in such a way that a candle has its wicks BELOW the old low, but the close is ABOVE the old low. the same applies to the high, of course!
In such a case we have an "LQ Sweep"
How does the script work?
Williams 3 fractals are used as a basis. These are meaningful as lows or highs. Whenever a fractal is created, the price level is saved.
This means that not only the last fractal is relevant, but all historical fractals as long as they have not been reached!
If a candle reaches the level, but shows a rejection and closes within the level again, we have our "LQ Sweep" setup.
In the script you can select the timeframe in which the market has to be analysed. When the QL sweep occurs, an alert is triggered. This saves a lot of time because you can analyse different markets in different timeframes at the same time!
Each QL Sweep is marked in the chart when we are in the selected timeframe. These can also be deactivated so that only the last sweep is displayed.
Benefits for the trader:
An LQ sweep is a nice confirmation for a reversal.
If we have such an LQ sweep, we can wait in the lower timeframe for further confirmation, such as a structural break, to position our entries there.
The alarm function saves us a lot of time and we only go to the chart when a potential setup has been created.
You can set different time frames in the script: The selected time frame is then scanned and sends a signal when the event occurs.


Williams_proGO_PRICEVersione rivisitata del Williams ProGo che risulta essere direttamente sul grafico principale con aggiunta
delle medie classiche per controllo golden cross ed anche una serie di calcoli visibili nella finestra dati per il posizionamento
dei livelli stop loss e take profit calcolati con un atr


Fractal Trend Detector [Skyrexio]Introduction
Fractal Trend Detector leverages the combination of Williams fractals and Alligator Indicator to help traders to understand with the high probability what is the current trend: bullish or bearish. It visualizes the potential uptrend with the coloring bars in green, downtrend - in red color. Indicator also contains two additional visualizations, the strong uptrend and downtrend as the green and red zones and the white line - trend invalidation level (more information in "Methodology and it's justification" paragraph)
Features
Optional strong up and downtrends visualization: with the specified parameter in settings user can add/hide the green and red zones of the strong up and downtrends.
Optional trend invalidation level visualization: with the specified parameter in settings user can add/hide the white line which shows the current trend invalidation price.
Alerts: user can set up the alert and have notifications when uptrend/downtrend has been started, strong uptrend/downtrend started.
Methodology and it's justification
In this script we apply the concept of trend given by Bill Williams in his book "Trading Chaos". This approach leverages the Alligator and Fractals in conjunction. Let's briefly explain these two components.
The Williams Alligator, created by Bill Williams, is a technical analysis tool used to identify trends and potential market reversals. It consists of three moving averages, called the jaw, teeth, and lips, which represent different time periods:
Jaw (Blue Line): The slowest line, showing a 13-period smoothed moving average shifted 8 bars forward.
Teeth (Red Line): The medium-speed line, an 8-period smoothed moving average shifted 5 bars forward.
Lips (Green Line): The fastest line, a 5-period smoothed moving average shifted 3 bars forward.
When the lines are spread apart and aligned, the "alligator" is "awake," indicating a strong trend. When the lines intertwine, the "alligator" is "sleeping," signaling a non-trending or range-bound market. This indicator helps traders identify when to enter or avoid trades.
Williams Fractals, introduced by Bill Williams, are a technical analysis tool used to identify potential reversal points on a price chart. A fractal is a series of at least five consecutive bars where the middle bar has the highest high (for a up fractal) or the lowest low (for a down fractal), compared to the two bars on either side.
Key Points:
Up fractal: Formed when the middle bar shows a higher high than the two preceding and two following bars, signaling a potential turning point downward.
Down fractal: Formed when the middle bar has a lower low than the two surrounding bars, indicating a potential upward reversal.
Fractals are often used with other indicators to confirm trend direction or reversal, helping traders make more informed trading decisions.
How we can use its combination? Let's explain the uptrend example. The up fractal breakout to the upside can be interpret as bullish sign, there is a high probability that uptrend has just been started. It can be explained as following: the up fractal created is the potential change in market's behavior. A lot of traders made a decision to sell and it created the pullback with the fractal at the top. But if price is able to reach the fractal's top and break it, this is a high probability sign that market "changed his opinion" and bullish trend has been started. The moment of breaking is the potential changing to the uptrend. Here is another one important point, this breakout shall happen above the Alligator's teeth line. If not, this crossover doesn't count and the downtrend potentially remaining. The inverted logic is true for the down fractals and downtrend.
According to this methodology we received the high probability up and downtrend changes, but we can even add it. If current trend established by the indicator as the uptrend and alligator's lines have the following order: lips is higher than teeth, teeth is higher than jaw, script count it as a strong uptrend and start print the green zone - zone between lips and jaw. It can be used as a high probability support of the current bull market. The inverted logic can be used for bearish trend and red zones: if lips is lower than teeth and teeth is lower than jaw it's interpreted by the indicator as a strong down trend.
Indicator also has the trend invalidation line (white line). If current bar is green and market condition is interpreted by the script as an uptrend you will see the invalidation line below current price. This is the price level which shall be crossed by the price to change up trend to down trend according to algorithm. This level is recalculated on every candle. The inverted logic is valid for downtrend.
How to use indicator
Apply it to desired chart and time frame. It works on every time frame.
Setup the settings with enabling/disabling visualization of strong up/downtrend zones and trend invalidation line. "Show Strong Bullish/Bearish Trends" and "Show Trend Invalidation Price" checkboxes in the settings. By default they are turned on.
Analyze the price action. Indicator colored candle in green if it's more likely that current state is uptrend, in red if downtrend has the high probability to be now. Green zones between two lines showing if current uptrend is likely to be strong. This zone can be used as a high probability support on the uptrend. The red zone show high probability of strong downtrend and can be used as a resistance. White line is showing the level where uptrend or downtrend is going be invalidated according to indicator's algorithm. If current bar is green invalidation line will be below the current price, if red - above the current price.
Set up the alerts if it's needed. Indicator has four custom alerts called "Uptrend has been started" when current bar closed as green and the previous was not green, "Downtrend has been started" when current bar closed red and the previous was not red, "Uptrend became strong" if script started printing the green zone "Downtrend became strong" if script started printing the red zone.
Disclaimer:
Educational and informational tool reflecting Skyrex commitment to informed trading. Past performance does not guarantee future results. Test indicators before live implementation.

Fractal Trail [UAlgo]The Fractal Trail is designed to identify and utilize Williams fractals as dynamic trailing stops. This tool serves traders by marking key fractal points on the chart and leveraging them to create adaptive stop-loss trails, enhancing risk management and trade decision-making.
Williams fractals are pivotal in identifying potential reversals and critical support/resistance levels. By plotting fractals dynamically and providing configurable options, this indicator allows for personalized adjustments based on the trader's strategy.
This script integrates both visual fractal markers and adjustable trailing stops, offering insights into market trends while catering to a wide variety of trading styles and timeframes.
🔶 Key Features
Williams Fractals Identification: The indicator marks Williams Fractals on the chart, which are significant highs and lows within a specified range. These fractals are crucial for identifying potential reversal points in the market.
Dynamic Trailing Stops: The indicator generates dynamic trailing stops based on the identified fractals. These stops adjust automatically as new fractals are formed, providing a responsive and adaptive approach to risk management.
Fractal Range: Users can specify the number of bars to the left and right for analyzing fractals, allowing for flexibility in identifying significant price points.
Trail Buffer Percentage: A percentage-based safety margin can be added between the fractal price and the trailing stop, providing additional control over risk management.
Trail Invalidation Source: Users can choose whether the trailing stop flips based on candle closing prices or the extreme points (high/low) of the candles.
Alerts and Notifications: The indicator provides alerts for when the price crosses the trailing stops, as well as when new Williams Fractals are confirmed. These alerts can be customized to fit the trader's notification preferences.
🔶 Interpreting the Indicator
Fractal Markers: The triangles above and below the bars indicate Williams Fractals. These markers help traders identify potential reversal points in the market.
Trailing Stops: The dynamic trailing stops are plotted as lines on the chart. These lines adjust based on the latest identified fractals, providing a visual representation of potential support and resistance levels.
Fill Colors: The optional fill colors between the trailing stops and the price action help traders quickly identify the current trend and potential pullback zones.
🔶 Disclaimer
Use with Caution: This indicator is provided for educational and informational purposes only and should not be considered as financial advice. Users should exercise caution and perform their own analysis before making trading decisions based on the indicator's signals.
Not Financial Advice: The information provided by this indicator does not constitute financial advice, and the creator (UAlgo) shall not be held responsible for any trading losses incurred as a result of using this indicator.
Backtesting Recommended: Traders are encouraged to backtest the indicator thoroughly on historical data before using it in live trading to assess its performance and suitability for their trading strategies.
Risk Management: Trading involves inherent risks, and users should implement proper risk management strategies, including but not limited to stop-loss orders and position sizing, to mitigate potential losses.
No Guarantees: The accuracy and reliability of the indicator's signals cannot be guaranteed, as they are based on historical price data and past performance may not be indicative of future results.

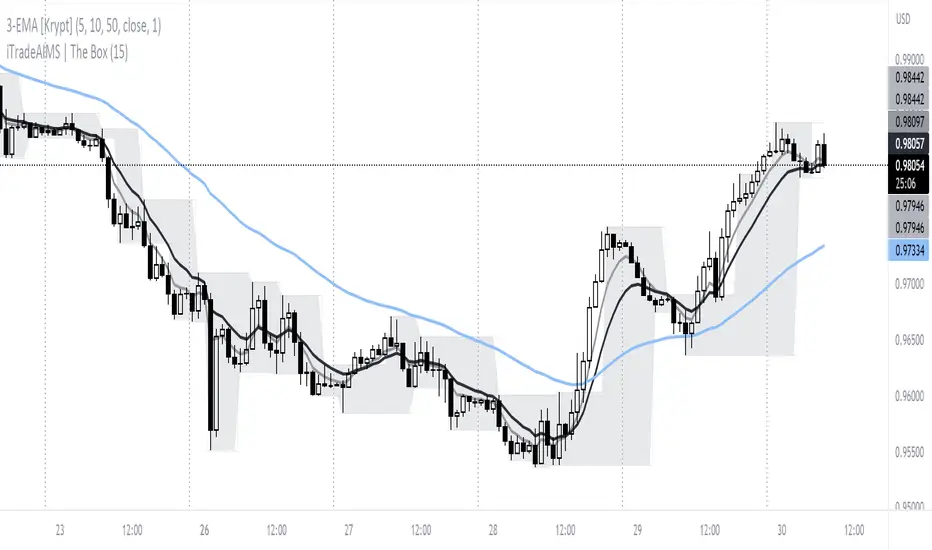
iTradeAIMS | The BOX IndicatorIntroduction to iTradeAIMS The Box Indicator
Here I will attempt to give a brief introduction to this amazing indicator that has revolutionised my trading since 2009.
Everything in the universe is energy and energy follows the path of least resistance. When it moves it heavily influenced by a structure.
When energy flows it reacts to the underlying structure. Electricity flows through copper wires easily compared to "my arm".
A river flows smoothly on flat plains of the land but becomes violent when flowing down a mountain. Why is this? Why does it change its behaviour?
The Science of Chaos Brings us here. Everything in the universe has an internal or underlying structure. That structure is often, but not always, hidden.
The Market has an underlying Unseen Structure. And it can be revealed by using this indicator. TSX:TSL
Anatomy of the Box
The iTradeAIMS Boxes are formed using the high and low of the fractals.
A new AIMS Box will be created whenever price makes a new high or low Fractal.
The bottom of the AIMS Box – the Lower AIMS Level - is created when a low Fractal is formed i.e. the low of a candle is lower than two candles to the left and two candles to the right.
What is the Underlying Structure of the Market?
The underlying structure of the Market is Elliott Wave .
And the Underlying Structure of the Elliott Wave is the Fractals.
This BOX is an indicator based on the Fractals.
The Upper and Lower Levels require a minimum of five bars with the top of the box being the upper Fractal; the bottom of the box, the lower Fractal
The AIMS Levels are the high and low of the AIMS Box – the upper and lower Fractals.
This indicator, by itself, provided the concept that revolutionised my trading.
What are the Benefits of Using AIMS iTradeAIMS The Box?
1. Identify Trend:
The Box will also help you identify Trending Markets.
The Stepping Up pattern it creases is an indication of UPTREND .
The Stepping Down pattern indicates DOWNTREND .
2. Identify Entry Points
The Box will help you identify Entry Points into the market.
There are two ways it helps you make entries into the market.
a) breakout entry
b) trend following entry
3. Identify Range-Bound Market
The Box helps identify a sideways range-bound market.
When the box is not creating either a stepping up or stepping down pattern, it usually indicates to a sideways or rangebound market on that time frame.
4. Help you Make Entries: Calculate Correct Positions Size and Risk Size
The BOX is the structure of the market that offers the best method of How to calculate Risk Per Trade based on the market generated information.
Calculate your Entry Level and Stop Loss level using the Box Levels on either side of the box.
Buying the Box:
Set a Buy Order a Point above the Box and Stop Loss a point below the Box Low.
Selling the Box
Set a Sell Order a Point Below the Box Low and Stop Loss a Point Above the Box High.
TSLA Entries and Exits for Tesla Stock
I took this trade on the box high of this stock OII
I shared the Idea on TradingView as a Buy Signal on OII
Check the BitCoin Entry Here
5. Stop Loss Trailing Mechanism to Lock in Profits
The box levels are used for Trailing Stops.
For Long (Buy) Orders use the box low as a stop loss level for trailing and locking-in profits.
For Shorts (Sell) Orders, use the Box High levels for trailing stop and lock in profits.
6. Support and Resistance
The Box Levels (upper and lower) clearly shows support and resistance – where price approached a level and could not go further, forcing it to retrace on itself.
Pay attention to how box levels create ranges and also indicate trends.
How to Use this Indicator with other Indicators?
This indicator is great on its own but even greater if used in conjunction with iTradeAIMS The Wave and The Gator and The Magic Purple (Script Available FREE to use on iTradeAIMS Profile)
> The market always creates an AIMS Box before it turns around.
> Every trend starts and ends with an AIMS Box.
> Entries are always taken on the breakout of the AIMS Box.
How to Get Access to This Script?
Enjoy and accept it as my gift to the TradingView Community from iTradeAIMS | This Indicator is now available to everyone for FREE.
Credits: I learned the method from Bill Williams of Profitunity.com All credits, thanks, gratitude, positive vibes, and prayers goes to Dr Williams 🥇 (RIP) and his family ❤.
ChaosThis script adds a Bill Williams Alligator to your charts and the three wisemen:
1. Wiseman 1 - Bullish or bearish divergent bars shown with a circle (be sure to check angulation manually).
2. Wiseman 2 - Super AO - with a square.
3 Wiseman 3 - Fractal with a triangle.
Be sure to wait until the current bar is closed before using these signals.
Reference: TradingChaos Version 2
