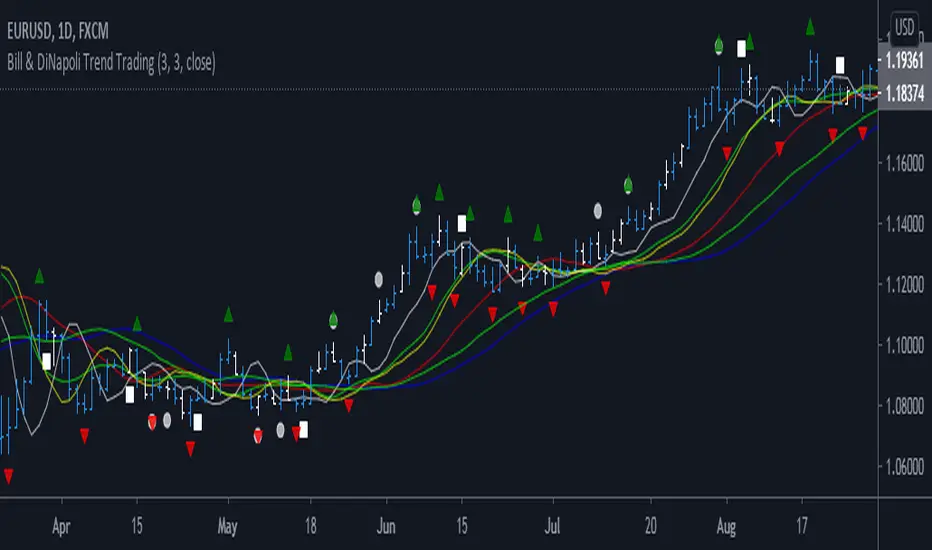
Bill & DiNapoli TradingThis Indicator is a pack of set of Indicators. I am a Bill Williams Chaos and DiNapoli system trader. It includes following indicators,
1. Wiseman 1 - Divergent Bar indicated by Circle. Angulation to be manually observed
2. Wiseman 2 - The Super AO signal, indicated by a square
3. Wiseman 3 - Bill William's Fractal indicated as Triangle
4. DiNapoli DMA1 - 3 Bar SMA, Shifted 3 Periods forward
5. DiNapoli DMA2 - 7 Bar SMA, Shifted 5 Periods forward
6. DiNapoli DMA3 - 25 Bar SMA, Shifted 5 Periods forward
7. Squat Bar - Bill William's Trading System
You can check out Bill Willam's Trading Chaos 2nd Edition and DiNapoli Level Book
Recherche dans les scripts pour "williams"
Finnie's RSI + 3EMA crossover + MFI + Vix Fix-added a medium and long term rsiEMA, in addition to the previous short term, except this time there's a visual crossover :)
-added CM Williams vix fix
-and finally just a general visual overhaul!

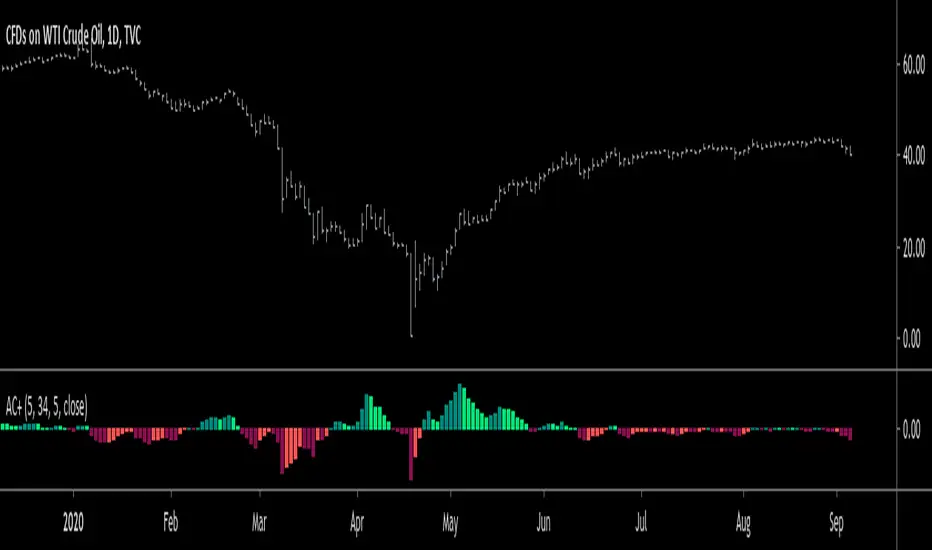
Accelerator Oscillator PlusBill Williams designed the Accelerator Oscillator (AC) to provide the earliest indications possible to changes in the trend, and he claimed that it gives traders a significant advantage in the market.
Improving upon his indicator, I give you Accelerator Oscillator Plus (AC+). Currently, Accelerator Oscillator Plus sets itself apart from other Accelerator Oscillators in Tradingview because it has a source option that allows the user to choose between close, hl2, etc.
Calculation:
AO(5,34) = sma(close,5) - sma(close,34)
AC(5,34,5)+ = AO - sma(AO,5)
The default & recommended settings for Accelerator Oscillator Plus are:
AO ma1: 5
AO ma2: 34
AC ma: 5
AO Source: Close
How to trade with this oscillator:
When values are greater than zero, oscillator is green/bullish.
When values are lesser than zero, oscillator is red/bearish.
A signal to buy occurs when the oscillator changes from (-) to (+) values...and vise versa for a sell signal.
If you have any questions or concerns, please leave a comment down below.
Also, hit the like & follow buttons if you haven't already!
I come up with new indicators every month!
Good luck, and enjoy :)
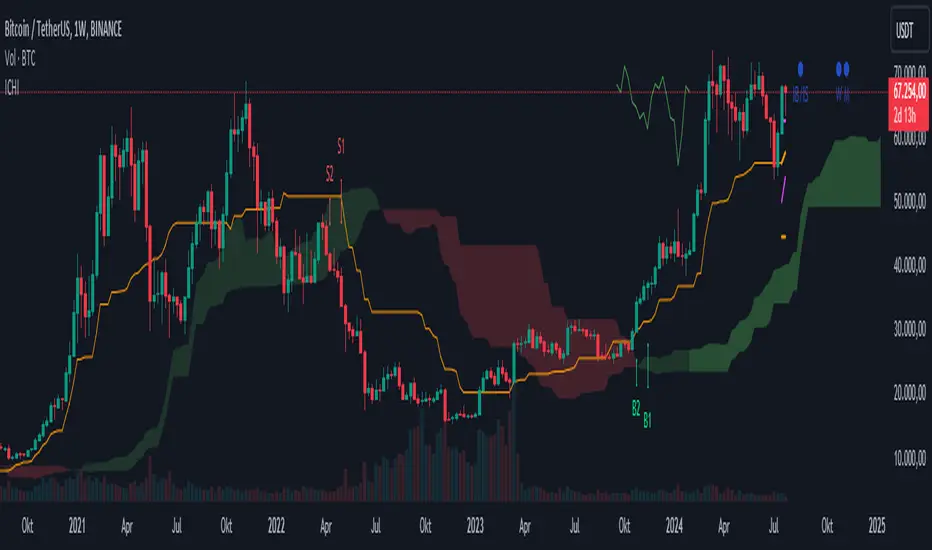
Ichimoku Kinko Hyo + FractalsIn contrast to my Ichimoku ++ Study this is a pure Ichimoku Konko Hyo Study with Bill Williams Fractals (I couldn't leave out the fractals as these levels are too important for Ichimoku trading).
In this study you can find many visualisation options for the Ichimoku Indicator and the signals the Ichimoku Tradingsystem can provide.
Tenkan-sen and Kijun-sen are provided optionally as mtf levels.
An mtf price cloud relationship is shown in the upper right.
The included signals are:
B1/S1 is a strong filtered signal. The condition for long entry is:
price > Kumo AND Chikou > price AND Chikou > Kumo AND Tenkan > Kijun AND Komo is green
B2/S2 is a less filtered signal. The condition for long entry is:
price > Kumo AND Chikou > price AND Tenkan > Kijun
IB/IS is a confluence signal. The condition for a long/short entry is: more than 50% of the 8 defined conditions must trigger a long signal. Below 50% long, it is a short signal because more than 50% of the entry conditions have triggered a short signal.
Effort v RewardI made this indicator to make it easier to compare volume and price movement. This is similar in concept to the Market Facilitation Index by Bill Williams, although hopefully this can make that analysis easier to see at a glance (similar to the way some bar overlays/recolors work but with more detail and in its own pane). The primary use for this indicator would be paying attention to the red EMA, which shows the difference between price movement and volume, normalized within the normalization lookback period (adjustable, defaults to 30 bars). When the red ema moves up, it means there is less effort required to move price more, which means the trend (if there is one) is probably stronger or has had resistance removed/shaken out already; if the red ema moves down into the negative, it means there is a lot of effort for very little price movement, meaning a large battle between the bears and the bulls currently (squat). Enjoy, let me know if you want adjustments, and safe and successful trading!

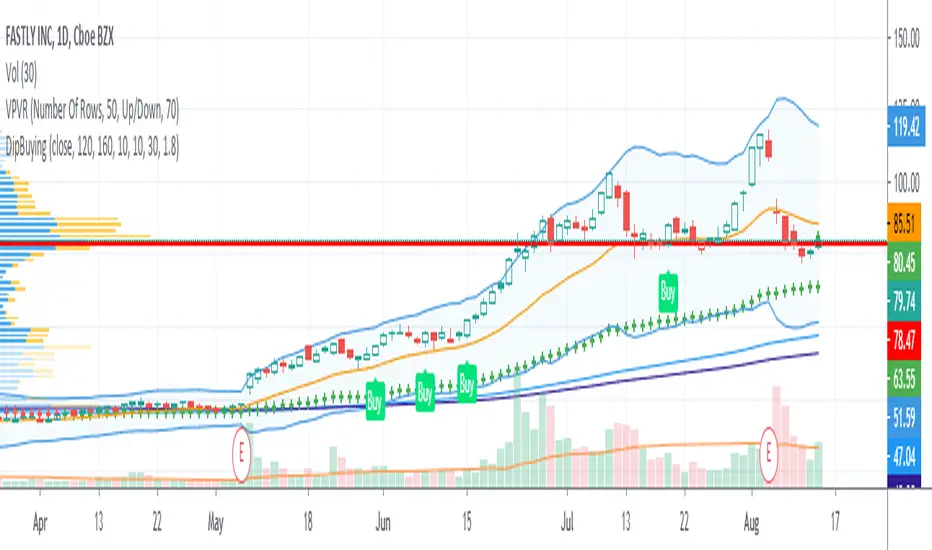
Nerd Dip Buying for StocksThis script is intended to generate BUY signals during pullbacks in stocks which are in the midst of mid to long-term uptrends. The ideal timeframe is Daily.
Signals should be acted upon at or near the close, or at open next bar.
I use 2 simple moving averages (SMA1 and SMA2) to determine whether the stock is currently in an uptrend. The default parameters are:
SMA1 = 120
SMA2 = 160
Buy signals are only produced when SMA1 is above SMA2.
As an additional filter I also use the Adaptive Moving Average (AMA) developed by Perry Kaufman. The settings are (10, 10, 30). Buy signals are allowed only when the bar closes above the AMA.
Lastly, the Buy signal itself is computed utilizing the Greatest Swing Value, a concept pioneered by Larry Williams in his book Long-Term Secrets To Short-Term Trading . You can control how often BUY signals appear by tweaking the parameter GSV Buy Factor . The smaller the number, the more often BUY signals appear. By default,
GSV Buy Factor = 1.8
This indicator has been developed with stocks trading in mind only, in particular US stocks. Feel free to apply it to other markets or asset classes and let me know the results. Thank you very much.
Larry Williams 9.2 with EMA21 filter - ValenteIndicator for the setup Larry Willians 9.2
there is a option to include the EMA21 as a filter.

Riley's Percent RangeThis indicator is based on Williams Percent Range, but uses a slightly different formula.
When the indicator line is green = buy, red = sell, gray = neutral.
Enjoy! and hit the follow button to stay up to date with my latest indicators!

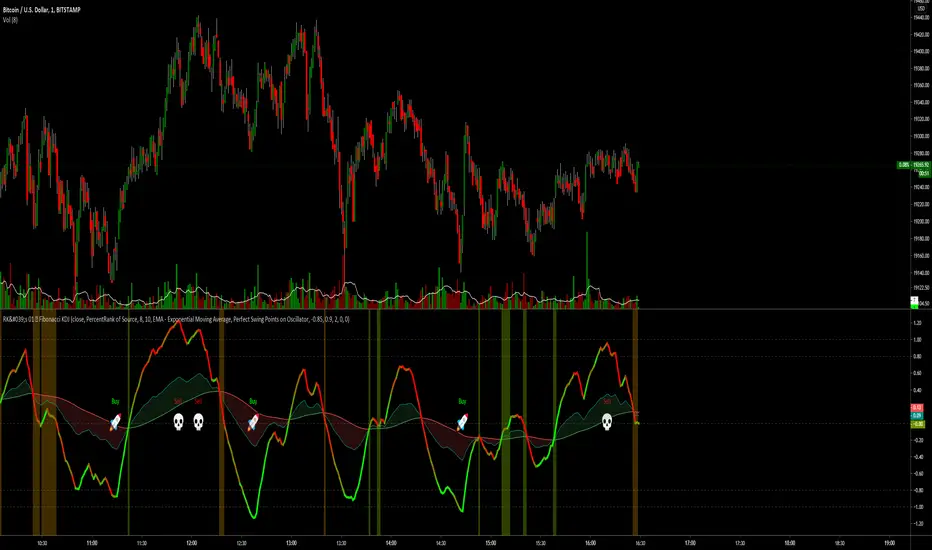
RK's 01 ∴ Fibonacci KDJAfter receiving some messages asking about my Fibonacci KDJ Indicator, I decided to share with everyone here, but, in this moment I prefer to keep the script hide. 😅
About this indicator:
This is a traditional KDJ indicator with more options:
You can choose the oscillator method between PercentRank, Stochastic and Williams %R;
Treat all the source values as a Logarithmic number;
Use Fibonacci's nth term number as Period and Signal Length, or uncheck this options and type your favorite Length numbers;
And choose what kind of moving average to apply on signal.
The other options is for help the user to enter or exit the market, and I put some visuals options to fit in different styles
Hope you like and have great lucky and profit.
Liquidity and SFPThis tool prints fractal high & lows (triangles) illustrating probably points of liquidity & Williams method.
If the liquidity points have been run, there will be a line print, when they have not been run there will still be a single triangle print without a line.
If the liquidity is run and then the candle closes above we print a checkmark to demo that it is likely that this was a stop run to generate liquidity for bigger market participants. This can help with entry identification if this is a method you deploy.
This indicator is available as part of membership at at decentrader.com

Two Fractals TrendlinesThis study draws a trend line for the last two Bill Williams up-fractals and down-fractals.
Trend line break signals and alerts can optionally be added.

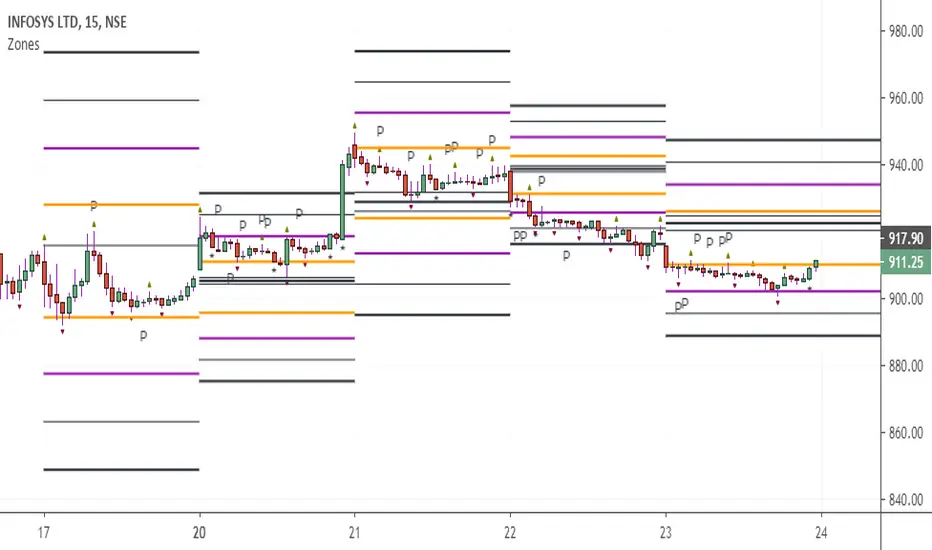
CAMZONEAdded Fractals which establishes high and low based on Bill Williams definition. Added one type of Pinbar (where the open and close is near extreme of the range and with long shadow that is at least 80% of the range). It is a powerful reversal pattern especially on the daily charts. These bars are identified with the character P. Also included dots below momentum candles.
Jackrabbit.modulus.Williams%RThis is the Williams %R for the Jackrabbit suite and modulus framework.
This indicator supports differential timeframe analysis and confirmational bias. Dynamic timeframes are supported.
This is an updated view of %R and supports traditional overbought/sold boundaries and cross over regions.
The main indicatior and the confirmational indicator can both be individually tuned for the length and smoothing, with 30 different moving average types:
SMA, Double SMA, Triple SMA,
EMA, Double EMA, Triple EMA,
RMA, Double RMA, Triple RMA
WMA, Double WMA, Triple WMA,
VWMA, Double VWMA, Triple VWMA,
Hull, Double Hull, Triple Hull,
ZLEMA, Double ZLEMA, Triple ZLEMA,
SWMA, Double SWMA, Triple SWMA,
SSMA, Double SSMA, Triple SSMA,
SMMA,Double SMMA, Triple SMMA
The Jackrabbit modulus framework is a plug in play paradigm built to operate through TradingView's indicator on indicatior (IoI) functionality. As such, this script receives a signal line from the previous script in the IoI chain, and evaluates the buy/sell signals appropriate to the current analysis. The results are either combined with the signal line, or used as confirmation to the signal line. A new signal line is generated for the next script in the link.
This script is not designed or meant to function outside my framework.
By default, the signal line is visible and the charts are turned off. Signal line visibility is controlled by the Style tab, and the charts display is controlled by the indicator settings tab.
This script is by invitation only. To learn more about accessing this script, please see my signature or send me a PM. Thank you.

Ichimoku ++ public v0.9Description:
The intention of this script is to build/provide a kind of work station / work bench for analysing markets and especially Bitcoin . Another goal is to get maximum market information while maintaining a good chart overview. A chart overloaded with indicators is useless because it obscures the view of the chart as the most important indicator. The chart should be clear and market structure should be easy to see. In addition, some indicator signals can be activated to better assess the quality of signals from the past. The chart environment or the chart context is important for the quality of a signal.
The intention of this script is not to teach someone how to trade or how to use these Indicators but to provide a tool to analyse markets better and to help to draw conclusions of market behaviour in a higher quality.
A general advise:
Use the included indicators and signals in a confluent way to get stoploss, buy and sell entry points. SR clusters can be identified for use in conjunction with fractals as entry and exit pints. My other scripts can also help. Prefer 4 hours, daily and a longer time frame. There is no "Holy Grail" :).
If someone is new to trading you should learn about the indicators first. Definitely learn about Ichimoku Cloud Indicator.
Integrated indicators are:
Ichimoku Cloud and signals
Parabolic SAR and signal
ATR stop
Bollinger Bands
EMA / SMA and background color as signal
Williams Fractals and signal
Puell Multiple signal

Larry Williams 9.1 with Optional Filters - ValenteThis indicator is based on the Larry Willians 9.1 Strategy.
It will paint the candles WHITE when Long entries are activated and BLACK when short entries are activated.
There is an option to include an EMA or SMA filter.

Gator RibbonThere's nothing fancy here--I just like the look of this one. And it works pretty well. This started out as the standard Alligator indicator. There I reset all the offsets to 0 and added an Ichimoku Cloudish fill.
Astute observers will notice a fourth line has been added at 34 SMA. It's a bit of a cheat. 34 SMA is the zero line of another classic B. Williams indicator, the Awesome Oscillator. When the green line crosses over 34 SMA, it's quite likely the Awesome Oscillator will have changed sentiment as well. It also makes a nice loose trailing stop loss reference if you're hoping to get into some long trends.

Volume strength with Accumulation Distribution in Cycle of understanding psychology behind candle formation, i posted my script which is intended to determine the buying and selling pressure with candle wicks.
Idea behind wicks was although buyer and seller tried to make price high and low but it did not sustain indicating weakness in strength.
in this script i have tried to see the volume along with candle formation and structure. i tried to measure and derive volume information with body length of candle. Also plotted Williams Accumulation distribution to understand real trend ( Demand( Accumulation ) vs Supply ( Distribution ) )
Once can see difference in Usual volume indicator and information derived from this custom indicator with combination of WAD.

Bayesian BBSMA OscillatorSometime ago (very long ago), one of my tinkering project was to do a spam or ham classification type app to filter news I'd wanna read. So I built myself a Naive Bayes Classifier to feed me my relevant articles. It worked great, I can cut through the noise.
The hassle was I needed to manually train it to understand what I wanna read. I trained it using 50 articles and to my surprise, it's enough.
Complexity Theory
I've been reading a book called The Road to Ruin by Jim Rickards. He described how he got to his conclusion of how the stock market works by using Complexity Theory. Bill Williams would agree. Jim tells us that by using just enough data, we calculate the probability of an event to occur. We can't say for sure when but we know it's coming. This was my light bulb moment.
While Jim talks much about Bayesian Inference in which a probability of an event can always be updated as more evidence comes to light, I had my eyes set on binary probabilities of when prices are going up and down.
Assumptions
These are my assumptions:
Prices breaking up a Bollinger basis line will have fuel to go up even higher
Prices will go down when prices have broken up a Bollinger upper band
Scalping is the main method so we should use a lower period Moving Average (MA)
When prices are above MA, it's likelier a correction to the downside is imminent
When prices are below MA, it's likelier a correction to the upside is imminent
Optimize parameters for 1 hour timeframe which will give us time to react while still having more opportunities to trade
Building Blocks
Jim Rickards started with limited data (events) while in technical trading, data are plentiful. I decided to classify 2 events which are:
Next candles would be breaking up
Next candles would be breaking down
Key facts:
We won't know for sure when prices are going to break
We won't know for sure how much the prices movements are going to be
Formulas
Breaking up:
Pr(Up|Indicator) = Pr(Indicator|Up) * Pr(Up) / Pr(Indicator|Up) * Pr(Up) + Pr(Indicator|Down) * Pr(Down)
Breaking down:
Pr(Down|Indicator) = Pr(Indicator|Down) * Pr(Down) / Pr(Indicator|Down) * Pr(Down) + Pr(Indicator|Up) * Pr(Up)
Reading The Oscillator
Green is the probability of prices breaking up
Red is the probability of prices breaking down
When either green or red is flatlining ceiling, immediately on the next candle when the probability decreases go short or long based on which direction you're observing - Strong Signal
When either green or red is flatlining ceiling, take no action while it's ceiled
Usually when either green or red is flatlining bottom, the next candle when the probability increases, immediately take a short long position based on the direction you're observing - Weak Signal
When either green or red is flatlining bottom, take no action while it's bottomed
Alerts
Use Once per Bar option when generating alerts.

Boufuu Scalping Indicator
THIS indicator to look at GC DC on a Williams %R that reacts quickly with RSI
See volatility with ATR and make a small profit!
enjoy

pip hunter baseline overlayThis is a multi time frame baseline indicator which incorporates many aspects to help you eliminate false ideas from the other 2 indicators in the pip hunter package this indicator is the baseline guide to the direction you should be looking at the markets
this indicator can do the following things
work out pivot points
work out fibonacci retracement levels
give you multi time frame based trend ideas and reversal indications this is done in a heavily modified multitimeframe Williams alligator , multitimeframe up and downtrend labels, a multitimeframe TEMA cloud and a multitimeframe dot alert which is based on a proprietary set of exponential moving averages
and give you multiple powerful confluences as to the direction of the market including but not limited to a confirmation bar at the top of the screen which changes colour and brightness depending on the direction of the trend and the amount of chop in the market, it also adds this to the candles in the form of triangles and squares above and below the candles relevant to the direction. you will notice little flag icons these are designed to be little floating take profits with the idea that when a flag appears you should take partials if not the whole position off the table and wait for another entry or for other movement to occur as well as stars these can be used as signals when used with other confluences in the system to make sure that they are valid and correct ideas
this is best used with the rest of the pip hunter package for more info on getting access to all three indicators in the package please message me for more information

Dynamic Support and ResistanceSupport is a price level where a downtrend can be expected to pause due to a concentration of demand or buying interest. As the price of assets or securities drops, demand for the shares increases, thus forming the support line.
Meanwhile, resistance zones arise due to selling interest when prices have increased.s their name implies, dynamic support and resistance levels change their level with each new price-tick.To draw dynamic support and resistance levels, traders usually use moving averages which are automatically drawn by your trading platform. The 200-day exponential moving average (EMA), 100-day EMA, and 20-30-40-50-day EMA are very popular dynamic support and resistance levels.also in some references Williams Fractal level used for dynamic support and resistance levels. and it also includes other support and resistance levels that are projected based on the pivot point calculation. All these levels help traders see where the price could experience support or resistance. Similarly, if the price moves through these levels it lets the trader know the price is trending in that direction.

matrix on chartthis indicator uses several tools to provide detailed and accurate information across various time frames about the overall trend of the market it also shows the strength of the current move in the top confirmation bar it does this by showing both the direction and how much chop there is in the market simultaneously in the 4 colour bright green being a trend with no chop dark green is a bullish trend where chop is occurring, dark red is a bearish trend where chop is occurring and bright red is a bearish trend where no chop is occurring to make this even more evident these 4 confirmation bar colours are also drawn onto the candles as triangles above and below the candle when they are in the no chop zone and as dim squares above and below the candles when the chop is occurring. also at the top of the screen you will find occasional + symbols these are an additional confirmation on whether the market is bullish or bearish .
moving down to where the candles are on the chart you will find 3 lines inside of the trend flow this is a modified Williams alligator which can be used in conjunction with the other tools as a base line to hold the system together. this indicator also plots your higher highs, lower lows etc and plots where you've broken through them with a little X above or below the candle that broke through this can help you see at a quick glance if a support or resistance point has been broken. the other way of showing potential support and resistance is with the Fibonacci retracement tool that is automatically drawn onto the chart so you can help find those optimal turning points for continuing on a trend. lastly on the charts you will notice little flag icons these are designed to be little floating take profits with the idea that when a flag appears you should take partials if not the whole position off the table and wait for another entry or for other movement to occur

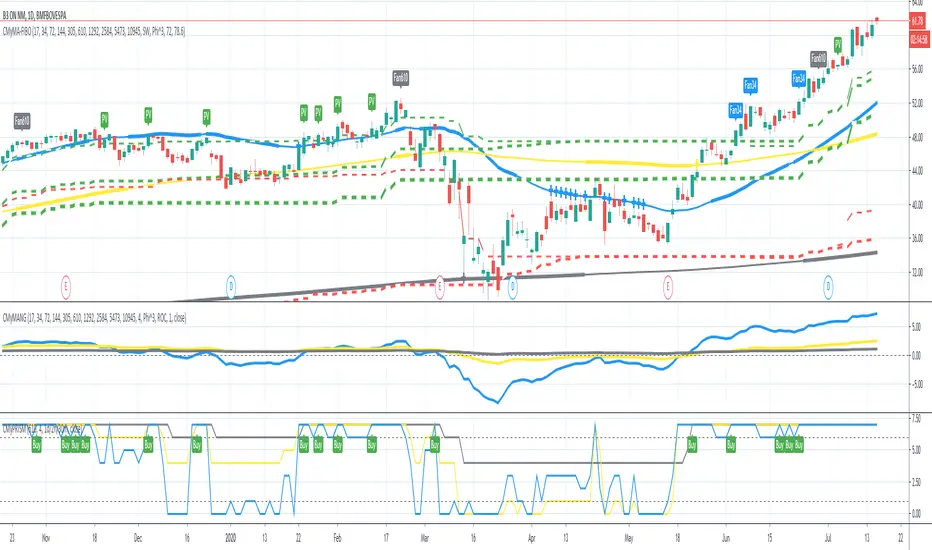
MyMA PrismThis script implements the Binary Logic Trading (BLT) algorithm to calculate a score from 0 to 7. This score is calculated assigning a power of 2 weight to the positive sign of 3 Phi^3 distant Moving Average (MA) slopes. The largest MA slope positive sign receives weight 4, the middle length MA slope positive sign receives weight 2 and the shortest MA slope positive sign receives weight 1. The positive sign of an MA is defined as 1 if the slope of the MA is positive and 0, otherwise. Therefore, for MAs 305, 72 and 17, if slope(MA305) > 0, slope(MA72) < 0 and slope(MA17) > 0, then score will be 4*1 + 2*0 + 1*1 = 5. Up to my knowledge, this score was first proposed by Bo Williams and named by him as Prisma.
The used Moving Averages can be chosen between EMA and MyMA. MyMA is a Moving Average that tries to mimic Bo William's MIMA. Due to the close resemblance between MyMA and MIMA, I do not feel comfortable to open this script source code. In order to learn how this script operates with EMAs, please refer to my Custom EMA Prism indicator that has its source code open.
Due too sampling issues, this script ONLY WORKS with graphic time of 1d. I would like to thanks to MrBitmanBob for showing me how to get quotations from a graphic time distinct from the current one.
This script also gets sampling data from graphic times 2h and 30m to calculate their score. As, even for smaller graphic times, price data is sampled at the current time frequency, the MA lengths for those smaller graphic times needed to be proportionally decreased, meaning that when calculating the score for 1d with lengths 305, 72 and 17, the score for 2h must be calculated with lengths 72, 17 and 4, and the score for 30m must be calculated with lengths 17, 4 an 1. I understand that some precision may be lost but it is the best that is possible.
There is an optional setting for Crypto Currencies that instead of calculating the score for 1d, 2h and 30m, it calculates the score for 1d, 4h and 60m. This is due to the fact that Crypto Currencies are traded 24x7. Despite of this setting, the labels at the Style tab of the settings window remains 2h and 30m, because they must be constants.
This script with the corresponding MyMAs chart and the MyMAs Angle chart provides a broader view of the trading scenario.