Elliott Wave - Impulse + Corrective Detector (Demo) เทคนิคการใช้
สำหรับมือใหม่
ดูเฉพาะ Impulse Wave ก่อน
เทรดตาม direction ของ impulse
ใช้ Fibonacci เป็น support/resistance
สำหรับ Advanced
ใช้ Corrective Wave หาจุด reversal
รวม Triangle กับ breakout strategy
ใช้ Complex correction วางแผนระยะยาว
⚙️ การปรับแต่ง
ถ้าเจอ Pattern น้อยเกินไป
ลด Swing Length เป็น 3-4
เพิ่ม Max History เป็น 500
ถ้าเจอ Pattern เยอะเกินไป
เพิ่ม Swing Length เป็น 8-12
ปิด patterns ที่ไม่ต้องการ
สำหรับ Timeframe ต่างๆ
H1-H4: Swing Length = 5-8
Daily: Swing Length = 3-5
Weekly: Swing Length = 2-3
⚠️ ข้อควรระวัง
Elliott Wave เป็น subjective analysis
ใช้ร่วมกับ indicators อื่นๆ
Backtest ก่อนใช้เงินจริง
Pattern อาจเปลี่ยนได้ตลอดเวลา
🎓 สรุป
โค้ดนี้เป็นเครื่องมือช่วยวิเคราะห์ Elliott Wave ที่:
✅ ใช้งานง่าย
✅ ตรวจจับอัตโนมัติ
✅ มี confidence scoring
✅ แสดงผล Fibonacci levels
✅ ส่ง alerts เรียลไทม์
เหมาะสำหรับ: Trader ที่ต้องการใช้ Elliott Wave ในการวิเคราะห์เทคนิค แต่ไม่มีเวลานั่งหา pattern เอง
💡 Usage Tips
For Beginners
Focus on Impulse Waves first
Trade in the direction of impulse
Use Fibonacci as support/resistance levels
For Advanced Users
Use Corrective Waves to find reversal points
Combine Triangles with breakout strategies
Use Complex corrections for long-term planning
⚙️ Customization
If You See Too Few Patterns
Decrease Swing Length to 3-4
Increase Max History to 500
If You See Too Many Patterns
Increase Swing Length to 8-12
Turn off unwanted pattern types
For Different Timeframes
H1-H4: Swing Length = 5-8
Daily: Swing Length = 3-5
Weekly: Swing Length = 2-3
⚠️ Important Warnings
Elliott Wave is subjective analysis
Use with other technical indicators
Backtest before using real money
Patterns can change at any time
🔧 Troubleshooting
No Patterns Showing
Check if you have enough price history
Adjust Swing Length settings
Make sure pattern detection is enabled
Too Many False Signals
Increase confidence threshold requirements
Use higher timeframes
Combine with trend analysis
Performance Issues
Reduce Max History setting
Turn off unnecessary visual elements
Use on liquid markets only
📈 Trading Applications
Entry Strategies
Wave 3 Entry: After Wave 2 completion (61.8%-78.6% retracement)
Wave 5 Target: Equal to Wave 1 or Fibonacci extensions
Corrective Bounce: Trade reversals at C wave completion
Risk Management
Stop Loss: Beyond pattern invalidation levels
Take Profit: Fibonacci extension targets
Position Sizing: Based on pattern confidence
🎓 Summary
This code is an Elliott Wave analysis tool that offers:
✅ Easy to use interface
✅ Automatic pattern detection
✅ Confidence scoring system
✅ Fibonacci level display
✅ Real-time alerts
Perfect for: Traders who want to use Elliott Wave analysis but don't have time to manually identify patterns.
📚 Quick Reference
Pattern Hierarchy (Most to Least Reliable)
Impulse Waves (90% confidence)
Expanded Flats (85% confidence)
Zigzags (80% confidence)
Triangles (75% confidence)
Complex Corrections (70% confidence)
Best Practices
Start with higher timeframes for main trend
Use lower timeframes for precise entries
Always confirm with volume and momentum
Don't trade against strong fundamental news
Keep a trading journal to track performance
Remember: Elliott Wave is an art as much as a science. This tool helps identify potential patterns, but always use your judgment and additional analysis before making trading decisions.
Recherche dans les scripts pour "zigzag"

Fibonacci Range Detector ║ BullVision🔬 Overview
The Fibonacci Range Mapper is a dynamic technical tool designed to identify, track, and visualize price ranges using Fibonacci levels. Whether you're trading manually or prefer automated structure recognition, this indicator helps you contextualize market moves and locate key price zones with precision.
⚙️ Core Logic
🔍 Range Detection (Auto & Manual Modes)
In Auto mode, the indicator uses an advanced ZigZag system based on ATR or percentage thresholds to confirm market swings and construct Fibonacci-based ranges.
In Manual mode, traders can define their own swing low and high to generate precise custom ranges.
📐 Fibonacci Mapping
Each detected range is automatically plotted with key Fibonacci retracement levels — 0%, 25%, 50%, 75%, 100% — along with optional extensions (127.2% and 161.8%) to anticipate price continuations or reversals.
📋 Live Data Table
An integrated info panel dynamically displays crucial metrics:
• Range size
• Current price zone (Discount / Mid / Premium)
• Position within range (%)
• Distance to range extremes
• Range status (Pending or Confirmed)
🕰️ Historical Memory
Up to 20 past ranges can be stored and visualized simultaneously, helping traders recognize repeated price behaviors and contextual support/resistance levels.
🎨 Visual Highlights
Zones of interest (0–25% = Discount, 75–100% = Premium) are color-coded with custom transparency, and labels can be toggled for clarity. The current active range updates in real time as structure evolves.
🔧 User Customization
• Detection Method: Choose between ATR or % ZigZag for automated swing identification
• Confirmation Delay: Set how many bars to wait before confirming a new high
• Manual Overrides: Select exact price levels when you want full control
• Extensions & Labels: Toggle additional lines and info to suit your charting style
• Visual Table Position: Customize where the data table appears on screen
• Color Scheme: Define your own zone gradients for better visual interpretation
📈 Use Cases
This indicator is ideal for traders who want to:
• Identify value zones within local or macro price structures
• Plan trades around Fibonacci retracement and extension levels
• Detect shifts in market structure using an adaptive ZigZag logic
• Track recurring price ranges and historical reaction points
• Enhance technical confluence with clean, visual price mapping
⚠️ Important Notes
This tool is not a buy/sell signal generator — it is a visual framework for structure-based analysis.
Use it in conjunction with your existing strategy and risk management process.
Always confirm with broader context and multi-timeframe alignment.

The Butterfly [theUltimator5]This is a technical analysis tool designed to automatically detect and visualize Butterfly harmonic patterns based on recent market pivot structures. This indicator uses a unique plotting and detection algorithm to find and display valid Butterfly patterns on the chart.
The indicator works in real-time and historically by identifying major swing highs and lows (pivots) based on a user-defined ZigZag length. It then evaluates whether the most recent price structure conforms to the ideal proportions of a bullish or bearish Butterfly pattern. If the ratios between price legs XA, AB, BC, and projected CD meet defined tolerances, the pattern is plotted on the chart along with a projected D point for potential reversal.
Key Features:
Automatic Pivot Detection: The script analyzes recent price action to construct a ZigZag pattern, identifying swing points as potential X, A, B, and C coordinates.
Butterfly Pattern Validation: The pattern is validated against traditional Fibonacci ratios:
--AB should be approximately 78.6% of XA.
--BC must lie between 38.2% and 88.6% of AB.
--CD is projected as a multiple of BC, with user control over the ratio (e.g., 1.618–2.24).
Bullish and Bearish Recognition: The pattern logic detects both bullish and bearish Butterflies, automatically adjusting plotting direction and color themes.
Custom Ratio Tolerance: Users can define how strictly the AB/XA and BC/AB legs must adhere to ideal ratios, using a percentage-based tolerance slider.
Fallback Detection Logic: If a new pattern is not identified in recent bars, the script performs a backward search on the last four pivots to find the most recent valid pattern.
Force Mode: A toggle allows users to force the drawing of a Butterfly pattern on the most recent pivot structure, regardless of whether the ideal Fibonacci rules are satisfied.
Dynamic Visualization:
--Clear labeling of X, A, B, C, and D points.
--Colored connecting lines and filled triangles to visualize structure.
--Optional table displaying key Fibonacci ratios and how close each leg is to ideal values.
Inputs:
Length: Controls the sensitivity of the ZigZag pivots. Smaller values result in more frequent pivots.
Tolerance (%): Adjustable threshold for acceptable deviation in AB/XA and BC/AB ratios.
CD Length Multiplier: Projects point D by multiplying the BC leg using a value between 1.618 and 2.24.
Force New Pattern: Overrides validation checks to display a Butterfly structure on recent pivots regardless of ratio accuracy.
Show Table: Enables a table showing calculated ratios and deviations from the ideal.

Higher Timeframe Market StructureHTF Market Structure – ZigZag, Break of Structure & Supply/Demand
This powerful indicator is designed to identify higher-timeframe market structure using a combination of ZigZag patterns, Break of Structure (BOS) signals, and Supply/Demand zones.
Key Features:
Automatic detection of Higher Highs (HH), Higher Lows (HL), Lower Lows (LL), and Lower Highs (LH)
Internal structure shifts based on Open or High/Low logic
Supply and Demand zones plotted on the chart
Break of Structure (BOS) lines with optional alerts
Mitigation logic to mark or delete invalidated order blocks
Customizable aggregation factor to view higher time frame structure on lower time frames
How to Use:
Focus on market structure and BOS to understand the current trend.
Watch for internal shifts as early signals of potential reversals.
Use ZigZag lines to connect swing highs and lows to visualize market rhythm.
Supply zones (red) and Demand zones (green) are automatically drawn after structure breaks:
Use Demand Zones in Bullish Markets for the highest probability entries.
Use Supply Zones in Bearish Markets to align with the prevailing trend.
Best Practices:
Only use Demand Zones in Bullish markets and Supply Zones in Bearish markets for optimal results.
Look for price action or reversal signals within these zones to refine your entries.
Enable alerts to get notified on:
New order blocks
Internal shifts
BOS events
HH, HL, LL, LH formations
Liquidity sweeps
Customization Options:
Aggregation Factor: Control how many candles are grouped for structure analysis.
Zone Duration: Define how length of plotted zones.
Mitigation Settings: Automatically delete or fade zones after mitigation.
Colors: Choose custom colors for bullish and bearish zones and structure markers.
This tool is ideal for traders who rely on price action, structure, and smart money concepts. Combine it with your own S&D strategy or integrate it with other confluence tools for even better precision.

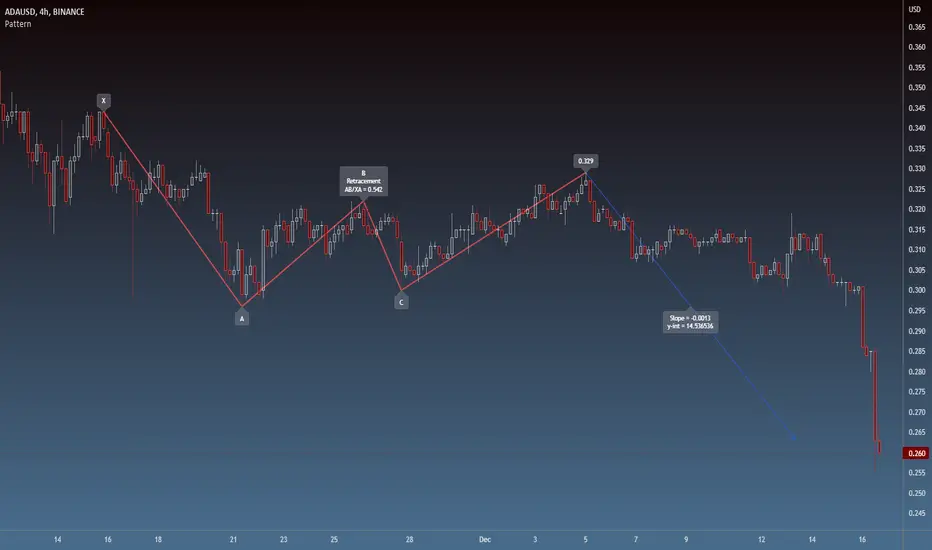
Segment RegressionAs an example of the descriptive power of Pine Script, this very short example traces a 'segment regression', a result not entirely obvious with so few lines of code, repositioning them when the previous inference moves away from the graph beyond the pre-set limit.
A trick used is to restart the new inference segment
- from the maximum reached in the previous trend, when positive (slope>0)
- from the minimum reached in the previous trend, when negative (slope<0)
The result can in my opinion be easily used to build strategies.

Triad Trade MatrixOverview
Triad Trade Matrix is an advanced multi-strategy indicator built using Pine Script v5. It is designed to simultaneously track and display key trading metrics for three distinct trading styles on a single chart:
Swing Trading (Swing Supreme):
This mode captures longer-term trends and is designed for trades that typically span several days. It uses customizable depth and deviation parameters to determine swing signals.
Day Trading (Day Blaze):
This mode focuses on intraday price movements. It generates signals that are intended to be executed within a single trading session. The parameters for depth and deviation are tuned to capture more frequent, shorter-term moves.
Scalping (Scalp Surge):
This mode is designed for very short-term trades where quick entries and exits are key. It uses more sensitive parameters to detect rapid price movements suitable for scalping strategies.
Each trading style is represented by its own merged table that displays real-time metrics. The tables update automatically as new trading signals are generated.
Key Features
Multi-Style Tracking:
Swing Supreme (Large): For swing trading; uses a purple theme.
Day Blaze (Medium): For day trading; uses an orange theme.
Scalp Surge (Small): For scalping; uses a green theme.
Real-Time Metrics:
Each table displays key trade metrics including:
Entry Price: The price at which the trade was entered.
Exit Price: The price at which the previous trade was exited.
Position Size: Calculated as the account size divided by the entry price.
Direction: Indicates whether the trade is “Up” (long) or “Down” (short).
Time: The time when the trade was executed (formatted to hours and minutes).
Wins/Losses: The cumulative number of winning and losing trades.
Current Price & PnL: The current price on the chart and the profit/loss computed relative to the entry price.
Duration: The number of bars that the trade has been open.
History Column: A merged summary column that shows the most recent trade’s details (entry, exit, and result).
Customizability:
Column Visibility: Users can toggle individual columns (Ticker, Timeframe, Entry, Exit, etc.) on or off according to their preference.
Appearance Settings: You can customize the table border width, frame color, header background, and text colors.
History Toggle: The merged history column can be enabled or disabled.
Chart Markers: There is an option to show or hide chart markers (labels and lines) that indicate trade entries and exits on the chart.
Trade History Management:
The indicator maintains a rolling history (up to three recent trades per trading style) and displays the latest summary in the merged table.
This history column provides a quick reference to recent performance.
How It Works
Signal Generation & Trade Metrics
Trade Entry/Exit Calculation:
For each trading style, the indicator uses built-in functions (such as ta.lowestbars and ta.highestbars) to analyze price movements. Based on a customizable "depth" and "deviation" parameter, it determines the point of entry for a trade.
Swing Supreme: Uses larger depth/deviation values to capture swing trends.
Day Blaze: Uses intermediate values for intraday moves.
Scalp Surge: Uses tighter parameters to pick up rapid price changes.
Metrics Update:
When a new trade signal is generated (i.e., when the trade entry price is updated), the indicator calculates:
The current PnL as the difference between the current price and the entry price (or vice versa, depending on the trade direction).
The duration as the number of bars since the trade was opened.
The position size using the formula: accountSize / entryPrice.
History Recording:
Each time a new trade is triggered (i.e., when the entry price is updated), a summary string is created (showing entry, exit, and win/loss status) and appended to the corresponding trade history array. The merged table then displays the latest summary from this history.
Table Display
Merged Table Structure:
Each trading style (Swing Supreme, Day Blaze, and Scalp Surge) is represented by a table that has 15 columns. The columns are:
Trade Type (e.g., Swing Supreme)
Ticker
Timeframe
Entry Price
Exit Price
Position Size
Direction
Time of Entry
Account Size
Wins
Losses
Current Price
Current PnL
Duration (in bars)
History (the latest trade summary)
User Customization:
Through the settings panel, users can choose which columns to display.
If a column is toggled off, its cells will remain blank, allowing traders to focus on the metrics that matter most to them.
Appearance & Themes:
The table headers and cell backgrounds are customizable via color inputs. The trading style names are color-coded:
Swing Supreme (Large): Uses a purple theme.
Day Blaze (Medium): Uses an orange theme.
Scalp Surge (Small): Uses a green theme.
How to Use the Indicator
Add the Indicator to Your Chart:
Once published, add "Triad Trade Matrix" to your TradingView chart.
Configure the Settings:
Adjust the Account Size to match your trading capital.
Use the Depth and Deviation inputs for each trading style to fine-tune the signal sensitivity.
Toggle the Chart Markers on if you want visual entry/exit markers on the chart.
Customize which columns are visible via the column visibility toggles.
Enable or disable the History Column to show the merged trade history in the table.
Adjust the appearance settings (colors, border width, etc.) to suit your chart background and preferences.
Interpret the Tables:
Swing Supreme:
This table shows metrics for swing trades.
Look for changes in entry price, PnL, and trade duration to monitor longer-term moves.
Day Blaze:
This table tracks day trading activity.It will update more frequently, reflecting intraday trends.
Scalp Surge:
This table is dedicated to scalping signals.Use it to see quick entry/exit data and rapid profit/loss changes.
The History column (if enabled) gives you a snapshot of the most recent trade (e.g., "E:123.45 X:124.00 Up Win").
Use allerts:
The indicator includes alert condition for new trade entries(both long and short)for each trading style.
Summary:
Triad Trade Matrix provides an robust,multi-dimensional view of your trading performance across swing trading, day trading, and scalping.
Best to be used whith my other indicators
True low high
Vma Ext_Adv_CustomTbl
This indicator is ideal for traders who wish to monitor multiple trading styles simultaneously, with a clear, technical, and real-time display of performance metrics.
Happy Trading!

Next level scolilay swing timerThe "Next Level Scolilay Swing Timer" is an advanced TradingView indicator designed to help traders navigate trends, reversals, and swing opportunities with ease. It's built around several key concepts like ATR filtering, ZigZag analysis, and momentum-based trend detection, making it a powerful tool for identifying market direction and key trading opportunities.
One of the standout features is its ability to filter candles using the Average True Range (ATR). This ensures that the indicator focuses on meaningful price movements rather than noise. You can tweak the ATR settings to suit your trading style, deciding how much historical data to consider or even turning the filter off completely if you prefer.
The script also integrates a ZigZag algorithm to detect pivot points, which it uses to evaluate swings in price action. This feature comes with customizable settings for depth and sensitivity, allowing you to adjust how the script reacts to price fluctuations. By analyzing these swings, the indicator identifies key highs and lows, which play a big role in determining whether the market is trending up or down.
When it comes to trends, the script is smart and flexible. It doesn't just look for higher highs or lower lows; it also considers momentum and retracement levels to decide if a trend is gaining strength or reversing. For example, it uses one-third retracement logic to spot sudden shifts in market direction, which can be critical for catching reversals early. You can also enable features like fast trend switching, which reacts to single-candle events that might signal a trend break.
Visualization is another area where this script shines. It marks uptrends and downtrends directly on the chart with clear labels, so you can instantly see when a new trend starts. Pink arrows appear above candles to signal potential downtrends, while yellow arrows below candles indicate possible uptrends. These signals combine multiple layers of analysis, like swing validation, ATR filtering, and trend confirmation, to give you reliable insights.
What makes the Swing Timer especially useful is its flexibility. Whether you’re a trend trader looking to ride major market moves, a swing trader focused on pivot points, or someone hunting for reversals, you can customize the settings to fit your needs. You can adjust everything from ZigZag and ATR parameters to how trends are labeled and filtered. The result is a tool that adapts to your trading style while still providing clear and actionable signals.
In short, this script brings together a range of advanced trading concepts into one user-friendly package. It’s perfect for traders who want to see market trends clearly, identify opportunities with confidence, and stay ahead of sudden reversals—all without getting bogged down in unnecessary complexity.

PIP Algorithm
# **Script Overview (For Non-Coders)**
1. **Purpose**
- The script tries to capture the essential “shape” of price movement by selecting a limited number of “key points” (anchors) from the latest bars.
- After selecting these anchors, it draws straight lines between them, effectively simplifying the price chart into a smaller set of points without losing major swings.
2. **How It Works, Step by Step**
1. We look back a certain number of bars (e.g., 50).
2. We start by drawing a straight line from the **oldest** bar in that range to the **newest** bar—just two points.
3. Next, we find the bar whose price is *farthest away* from that straight line. That becomes a new anchor point.
4. We “snap” (pin) the line to go exactly through that new anchor. Then we re-draw (re-interpolate) the entire line from the first anchor to the last, in segments.
5. We repeat the process (adding more anchors) until we reach the desired number of points. Each time, we choose the biggest gap between our line and the actual price, then re-draw the entire shape.
6. Finally, we connect these anchors on the chart with red lines, visually simplifying the price curve.
3. **Why It’s Useful**
- It highlights the most *important* bends or swings in the price over the chosen window.
- Instead of plotting every single bar, it condenses the information down to the “key turning points.”
4. **Key Takeaway**
- You’ll see a small number of red line segments connecting the **most significant** points in the price data.
- This is especially helpful if you want a simplified view of recent price action without minor fluctuations.
## **Detailed Logic Explanation**
# **Script Breakdown (For Coders)**
//@version=5
indicator(title="PIP Algorithm", overlay=true)
// 1. Inputs
length = input.int(50, title="Lookback Length")
num_points = input.int(5, title="Number of PIP Points (≥ 3)")
// 2. Helper Functions
// ---------------------------------------------------------------------
// reInterpSubrange(...):
// Given two “anchor” indices in `linesArr`, linearly interpolate
// the array values in between so that the subrange forms a straight line
// from linesArr to linesArr .
reInterpSubrange(linesArr, segmentLeft, segmentRight) =>
float leftVal = array.get(linesArr, segmentLeft)
float rightVal = array.get(linesArr, segmentRight)
int segmentLen = segmentRight - segmentLeft
if segmentLen > 1
for i = segmentLeft + 1 to segmentRight - 1
float ratio = (i - segmentLeft) / segmentLen
float interpVal = leftVal + (rightVal - leftVal) * ratio
array.set(linesArr, i, interpVal)
// reInterpolateAllSegments(...):
// For the entire “linesArr,” re-interpolate each subrange between
// consecutive breakpoints in `lineBreaksArr`.
// This ensures the line is globally correct after each new anchor insertion.
reInterpolateAllSegments(linesArr, lineBreaksArr) =>
array.sort(lineBreaksArr, order.asc)
for i = 0 to array.size(lineBreaksArr) - 2
int leftEdge = array.get(lineBreaksArr, i)
int rightEdge = array.get(lineBreaksArr, i + 1)
reInterpSubrange(linesArr, leftEdge, rightEdge)
// getMaxDistanceIndex(...):
// Return the index (bar) that is farthest from the current “linesArr.”
// We skip any indices already in `lineBreaksArr`.
getMaxDistanceIndex(linesArr, closeArr, lineBreaksArr) =>
float maxDist = -1.0
int maxIdx = -1
int sizeData = array.size(linesArr)
for i = 1 to sizeData - 2
bool isBreak = false
for b = 0 to array.size(lineBreaksArr) - 1
if i == array.get(lineBreaksArr, b)
isBreak := true
break
if not isBreak
float dist = math.abs(array.get(linesArr, i) - array.get(closeArr, i))
if dist > maxDist
maxDist := dist
maxIdx := i
maxIdx
// snapAndReinterpolate(...):
// "Snap" a chosen index to its actual close price, then re-interpolate the entire line again.
snapAndReinterpolate(linesArr, closeArr, lineBreaksArr, idxToSnap) =>
if idxToSnap >= 0
float snapVal = array.get(closeArr, idxToSnap)
array.set(linesArr, idxToSnap, snapVal)
reInterpolateAllSegments(linesArr, lineBreaksArr)
// 3. Global Arrays and Flags
// ---------------------------------------------------------------------
// We store final data globally, then use them outside the barstate.islast scope to draw lines.
var float finalCloseData = array.new_float()
var float finalLines = array.new_float()
var int finalLineBreaks = array.new_int()
var bool didCompute = false
var line pipLines = array.new_line()
// 4. Main Logic (Runs Once at the End of the Current Bar)
// ---------------------------------------------------------------------
if barstate.islast
// A) Prepare closeData in forward order (index 0 = oldest bar, index length-1 = newest)
float closeData = array.new_float()
for i = 0 to length - 1
array.push(closeData, close )
// B) Initialize linesArr with a simple linear interpolation from the first to the last point
float linesArr = array.new_float()
float firstClose = array.get(closeData, 0)
float lastClose = array.get(closeData, length - 1)
for i = 0 to length - 1
float ratio = (length > 1) ? (i / float(length - 1)) : 0.0
float val = firstClose + (lastClose - firstClose) * ratio
array.push(linesArr, val)
// C) Initialize lineBreaks with two anchors: 0 (oldest) and length-1 (newest)
int lineBreaks = array.new_int()
array.push(lineBreaks, 0)
array.push(lineBreaks, length - 1)
// D) Iteratively insert new breakpoints, always re-interpolating globally
int iterationsNeeded = math.max(num_points - 2, 0)
for _iteration = 1 to iterationsNeeded
// 1) Re-interpolate entire shape, so it's globally up to date
reInterpolateAllSegments(linesArr, lineBreaks)
// 2) Find the bar with the largest vertical distance to this line
int maxDistIdx = getMaxDistanceIndex(linesArr, closeData, lineBreaks)
if maxDistIdx == -1
break
// 3) Insert that bar index into lineBreaks and snap it
array.push(lineBreaks, maxDistIdx)
array.sort(lineBreaks, order.asc)
snapAndReinterpolate(linesArr, closeData, lineBreaks, maxDistIdx)
// E) Save results into global arrays for line drawing outside barstate.islast
array.clear(finalCloseData)
array.clear(finalLines)
array.clear(finalLineBreaks)
for i = 0 to array.size(closeData) - 1
array.push(finalCloseData, array.get(closeData, i))
array.push(finalLines, array.get(linesArr, i))
for b = 0 to array.size(lineBreaks) - 1
array.push(finalLineBreaks, array.get(lineBreaks, b))
didCompute := true
// 5. Drawing the Lines in Global Scope
// ---------------------------------------------------------------------
// We cannot create lines inside barstate.islast, so we do it outside.
array.clear(pipLines)
if didCompute
// Connect each pair of anchors with red lines
if array.size(finalLineBreaks) > 1
for i = 0 to array.size(finalLineBreaks) - 2
int idxLeft = array.get(finalLineBreaks, i)
int idxRight = array.get(finalLineBreaks, i + 1)
float x1 = bar_index - (length - 1) + idxLeft
float x2 = bar_index - (length - 1) + idxRight
float y1 = array.get(finalCloseData, idxLeft)
float y2 = array.get(finalCloseData, idxRight)
line ln = line.new(x1, y1, x2, y2, extend=extend.none)
line.set_color(ln, color.red)
line.set_width(ln, 2)
array.push(pipLines, ln)
1. **Data Collection**
- We collect the **most recent** `length` bars in `closeData`. Index 0 is the oldest bar in that window, index `length-1` is the newest bar.
2. **Initial Straight Line**
- We create an array called `linesArr` that starts as a simple linear interpolation from `closeData ` (the oldest bar’s close) to `closeData ` (the newest bar’s close).
3. **Line Breaks**
- We store “anchor points” in `lineBreaks`, initially ` `. These are the start and end of our segment.
4. **Global Re-Interpolation**
- Each time we want to add a new anchor, we **re-draw** (linear interpolation) for *every* subrange ` [lineBreaks , lineBreaks ]`, ensuring we have a globally consistent line.
- This avoids the “local subrange only” approach, which can cause clustering near existing anchors.
5. **Finding the Largest Distance**
- After re-drawing, we compute the vertical distance for each bar `i` that isn’t already a line break. The bar with the biggest distance from the line is chosen as the next anchor (`maxDistIdx`).
6. **Snapping and Re-Interpolate**
- We “snap” that bar’s line value to the actual close, i.e. `linesArr = closeData `. Then we globally re-draw all segments again.
7. **Repeat**
- We repeat these insertions until we have the desired number of points (`num_points`).
8. **Drawing**
- Finally, we connect each consecutive pair of anchor points (`lineBreaks`) with a `line.new(...)` call, coloring them red.
- We offset the line’s `x` coordinate so that the anchor at index 0 lines up with `bar_index - (length - 1)`, and the anchor at index `length-1` lines up with `bar_index` (the current bar).
**Result**:
You get a simplified representation of the price with a small set of line segments capturing the largest “jumps” or swings. By re-drawing the entire line after each insertion, the anchors tend to distribute more *evenly* across the data, mitigating the issue where anchors bunch up near each other.
Enjoy experimenting with different `length` and `num_points` to see how the simplified lines change!

Valid Pullbacks and Trend by kpt. GonzoThis script helps identify valid pullbacks. Based on the marked pullbacks, it can draw both internal and external structure trendlines.
A pullback is marked with a small triangle above or below the candle that created the local high or low.
A new local high is marked with a red triangle above the candle if at least one subsequent candle has a low lower than the low of the candle that created the new local high.
A new local low is marked with a green triangle below the candle if at least one subsequent candle has a high higher than the high of the candle that created the new local low.
Based on the marked local highs and lows, the internal structure trendline is created by simply connecting all highs and lows with a line.
The external structure is drawn in a similar way, but only highs and lows that have broken the previous structure are connected. This helps focus on important pivots and better understand the market structure.
Essa's Indicator 2.0Essa's Indicator V2: Beginner's Guide
This custom TradingView indicator has been designed to help you identify key trading opportunities based on session highs/lows, volatility, and moving averages. Below is a breakdown of the main features:
1. Exponential Moving Averages (EMAs)
Fast EMA (Blue Line): Tracks the short-term market trend (default: 9-period EMA).
Slow EMA (Red Line): Tracks the longer-term market trend (default: 21-period EMA).
You can turn on/off the EMAs using the "Show EMAs" option in the settings.
EMAs help smooth out price action and give a clearer picture of trends. A crossover of the fast EMA above the slow EMA can signal an upward trend, while the reverse may indicate a downward trend.
2. Session Highs and Lows
The indicator tracks price highs and lows for three major trading sessions:
London Session (Red): Highlighted in red. Active between 08:00 and 17:00 (LDN timezone) or 03:00 and 12:00 (NY timezone).
New York Session (Blue): Highlighted in blue. Active between 12:00 and 21:00 (LDN timezone) or 07:00 and 16:00 (NY timezone).
Asia Session (Yellow): Highlighted in yellow. Active between 22:00 and 08:00 (LDN timezone) or 18:00 and 03:00 (NY timezone).
Highs and lows for each session are plotted on the chart as lines. Breakouts from these levels can signal important trading opportunities:
London High/Low: Red lines.
New York High/Low: Blue lines.
Asia High/Low: Yellow lines.
The background color also changes depending on the active session:
London: Light red background.
New York: Light blue background.
Asia: Light yellow background.
3. Breakout Alerts
You can set alerts when the price breaks above or below session highs/lows:
Break Above London High: Alert triggered when the price crosses the London session high.
Break Below London Low: Alert triggered when the price falls below the London session low.
Similar alerts exist for the New York and Asia sessions as well.
4. Volatility-Adjusted EMA
The EMAs in this indicator are adjusted based on volatility (ATR - Average True Range). This allows the EMAs to respond to market conditions more dynamically, giving you more accurate trend readings in volatile markets.
5. ZigZag Feature (Optional)
You can enable the ZigZag feature to help visualize the price action's highs and lows:
ZigZag Lines: Highlight major peaks and troughs in price movements, helping you spot trends more easily.
This is helpful for identifying reversals or trend continuations.
6. Fractal Markers
This indicator uses fractals to mark potential turning points in the market:
Green Triangles (Above the Price): Indicate up fractals (potential reversal points where the price could move upwards).
Red Triangles (Below the Price): Indicate down fractals (potential reversal points where the price could move downwards).
Fractals can be a helpful confirmation tool when identifying entry and exit points.
7. Custom Timezone Options
You can choose between London (LDN) and New York (NY) timezones in the settings to adapt the session times to your trading location. This ensures the session high/low markers are displayed correctly for your trading region.
By default, the New York (NY) timezone is enabled for FXCM charts in the UK.
For BTC charts, you will need to switch to the appropriate time zone manually.
Thanks
Essa

[UST] Protein+Support/Resistance Script: A Comprehensive Overview
Thanks to Pmgjiv for providing the foundation to this improved Version.
In the world of trading, having a robust support and resistance analysis tool can make a significant difference in decision-making and overall strategy. Let's delve into the enhancements made to the support/resistance script and how each component contributes to a trader's arsenal:
Changes and improvements made for the script to help Traders make better rational decisions in their Trading:
1. Multiple Timeframes:
Integrating multiple timeframes into the analysis provides a multi-dimensional view of the market. Traders can now assess price action across different time horizons simultaneously. This feature allows for a deeper understanding of market dynamics and helps in identifying significant support and resistance levels across various timeframes.
2. Timeframe Labels Inside Zones:
By including timeframe labels within the zones, traders can easily identify the origin of each support or resistance level. This contextual information enhances clarity and facilitates more informed decision-making, especially when navigating through multiple timeframes.
3. Visual Zone Update:
Visual updates on zones enable traders to track changes in support and resistance levels in real-time. This dynamic feature enhances the analytical process by providing immediate insights into evolving market conditions, thereby enabling traders to adapt their strategies accordingly.
4. Zones Hit:
Understanding the frequency and intensity of zone hits offers valuable insights into the strength and relevance of support and resistance levels. Traders can gauge the significance of each zone based on its historical interaction with price, thereby gaining a deeper understanding of market sentiment and potential trading opportunities.
5. Option to Turn off Current Timeframe:
The ability to toggle off the current timeframe streamlines chart analysis by focusing only on the most critical support and resistance zones. This decluttering feature helps traders prioritize key levels, reducing cognitive overload and enhancing decision-making efficiency.
Explanation of Additional Functions:
a. Lookback:
The 'lookback' parameter allows traders to customize the age of support and resistance zones based on their trading style and preferences. By adjusting the lookback setting, traders can choose whether to prioritize recent price action or consider historical data, thus tailoring the analysis to their specific trading strategies.
b. Swinglength:
Swinglength determines the sensitivity of the support and resistance zones. By modifying this parameter, traders can control how aggressively the script identifies pivot points. A higher swinglength value results in smoother, more stable zones, whereas a lower value increases sensitivity, capturing smaller price movements.
c. ZigZag Indicator:
The ZigZag indicator plays a pivotal role in identifying significant price reversals. Its period setting determines the number of price bars considered before confirming a pivot point. Traders can utilize this indicator to identify key turning points in the market, aiding in the identification of robust support and resistance levels.
Impact of Sensitivity on Zones:
Adjusting the sensitivity of the ZigZag indicator directly influences the identification and delineation of support and resistance zones. Higher sensitivity levels result in fewer but more robust zones, capturing significant price movements. Conversely, lower sensitivity levels yield more zones, accommodating smaller price fluctuations but potentially introducing noise into the analysis.
d. S/R Range:
The ability to adjust the width of support and resistance zones allows traders to customize the breadth of key areas on a chart. Choosing a wider range encompasses a broader spectrum of prices, thereby identifying more comprehensive support and resistance levels. This flexibility enables traders to adapt their analysis to different market conditions and trading strategies.
Utilization in Trading:
Comprehensive Analysis: By incorporating multiple timeframes, traders gain a holistic view of market dynamics, enabling them to identify high-probability trading opportunities across various horizons.
Contextual Understanding: Timeframe labels within zones provide context, helping traders understand the significance of each level in relation to different timeframes and market conditions.
Real-time Adaptability: Visual zone updates facilitate real-time analysis, allowing traders to adjust their strategies promptly in response to changing market conditions.
Informed Decision-making: By considering zone hits, traders can assess the strength and relevance of support and resistance levels, enhancing their ability to make informed trading decisions.
Customized Analysis: Adjustable parameters such as lookback, swinglength, and sensitivity empower traders to tailor the analysis to their individual trading styles and preferences, enhancing precision and effectiveness.
In summary, these enhancements to the support/resistance script provide traders with a powerful toolkit for analyzing market dynamics, identifying key levels, and executing well-informed trading strategies across various timeframes and market conditions.

Elliott's Quadratic Momentum - Strategy [presentTrading]█ Introduction and How It Is Different
The "Elliott's Quadratic Momentum - Strategy" is a unique and innovative approach in the realm of technical trading. This strategy is a fusion of multiple SuperTrend indicators combined with an Elliott Wave-like pattern analysis, offering a comprehensive and dynamic trading tool. It stands apart from conventional strategies by incorporating multiple layers of trend analysis, thereby providing a more robust and nuanced view of market movements.
*Although the script doesn't explicitly analyze Elliott Wave patterns, it employs a wave-like approach by considering multiple SuperTrend indicators. Elliott Wave theory is based on the premise that markets move in predictable wave patterns. While this script doesn't identify specific Elliott Wave structures like impulsive and corrective waves, the sequential checking of trend conditions across multiple SuperTrend indicators mimics a wave-like progression.
BTC 8hr Long/Short Performance
Local Detail
█ Strategy, How It Works: Detailed Explanation
The core of this strategy lies in its multi-tiered approach:
1. Multiple SuperTrend Indicators:
The strategy employs four different SuperTrend indicators, each with unique ATR lengths and multipliers. These indicators offer various perspectives on market trends, ranging from short to long-term views.
By analyzing the convergence of these indicators, the strategy can pinpoint robust entry signals for both long and short positions.
2. Elliott Wave-like Pattern Recognition:
While not directly applying Elliott Wave theory, the strategy takes inspiration from its pattern recognition approach. It looks for alignments in market movements that resemble the characteristic waves of Elliott's theory.
This pattern recognition aids in confirming the signals provided by the SuperTrend indicators, adding an extra layer of validation to the trading signals.
3. Comprehensive Market Analysis:
By combining multiple indicators and pattern analysis, the strategy offers a holistic view of the market. This allows for capturing potential trend reversals and significant market moves early.
█ Trade Direction
The strategy is designed with flexibility in mind, allowing traders to select their preferred trading direction – Long, Short, or Both. This adaptability is key for traders looking to tailor their approach to different market conditions or personal trading styles. The strategy automatically adjusts its logic based on the chosen direction, ensuring that traders are always aligned with their strategic objectives.
█ Usage
To utilize the "Elliott's Quadratic Momentum - Strategy" effectively:
Traders should first determine their trading direction and adjust the SuperTrend settings according to their market analysis and risk appetite.
The strategy is versatile and can be applied across various time frames and asset classes, making it suitable for a wide range of trading scenarios.
It's particularly effective in trending markets, where the alignment of multiple SuperTrend indicators can provide strong trade signals.
█ Default Settings
Trading Direction: Configurable (Long, Short, Both)
SuperTrend Settings:
SuperTrend 1: ATR Length 7, Multiplier 4.0
SuperTrend 2: ATR Length 14, Multiplier 3.618
SuperTrend 3: ATR Length 21, Multiplier 3.5
SuperTrend 4: ATR Length 28, Multiplier 3.382
Additional Settings: Gradient effect for trend visualization, customizable color schemes for upward and downward trends.

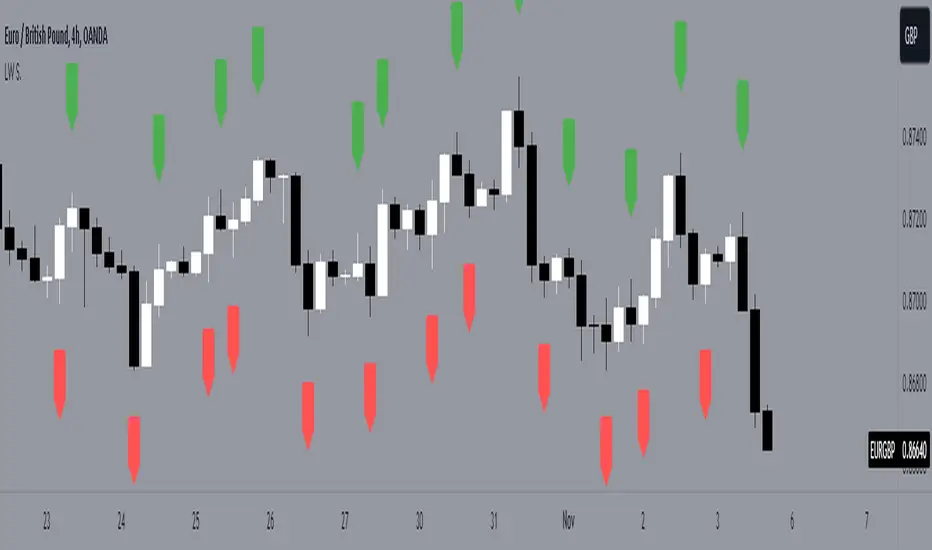
LW StructureThis easy and intuitive tool can be helpful to capture market trends.
This indicator marks the max and the min generated from the price with labels. The green labels are for the max peak and the red label for the min peak. This tool is inspired to the Larry Williams technique to easily catch the trend basing on the decreasing maximums and increasing mininums of the market structure.
Drawing inspiration from the Larry Williams approach, the LW Structure Indicator simplifies the process of recognizing trend patterns through the lens of market structure dynamics .
Historical Pattern Matcher [Trendoscope]Do you believe in patterns and think price movements are more likely to follow historical patterns? If yes, this is an indicator for you.
🎲 Concept
The patterns in this script are not a named or known pattern. But, it can be any pattern that happen to repeat again and again over a period of time.
The indicator collects the following information over a period of time.
Collects all possible patterns for specified number of pivots based on relation between each pivot prices. (Default 6)
Keeps track of all the possible patterns for the given pivots and number of occurrences of such patterns over a period of time.
Collects the movement of next pivot (in terms of retracement ratio) after the pattern has formed for each occurrence.
Keeps track of the last occurrence of each pattern collected
And the indicator presents on chart following information
Current Pattern drawing based on last confirmed pivot.
Current Pattern drawing based on current unconfirmed pivot in the opposite direction.
Projection range based on historical retracement ratio for both patterns
Detailed info on last occurrence and overall occurrences.
Last occurrence of both confirmed and unconfirmed pivot patterns.
Please note that, if the patterns have not been repeated over a period, then it will not be shown on the screen. Hence, it is perfectly normal to not see any projection. This can happen when the current pattern has not been repeated any time before.
🎲 Details
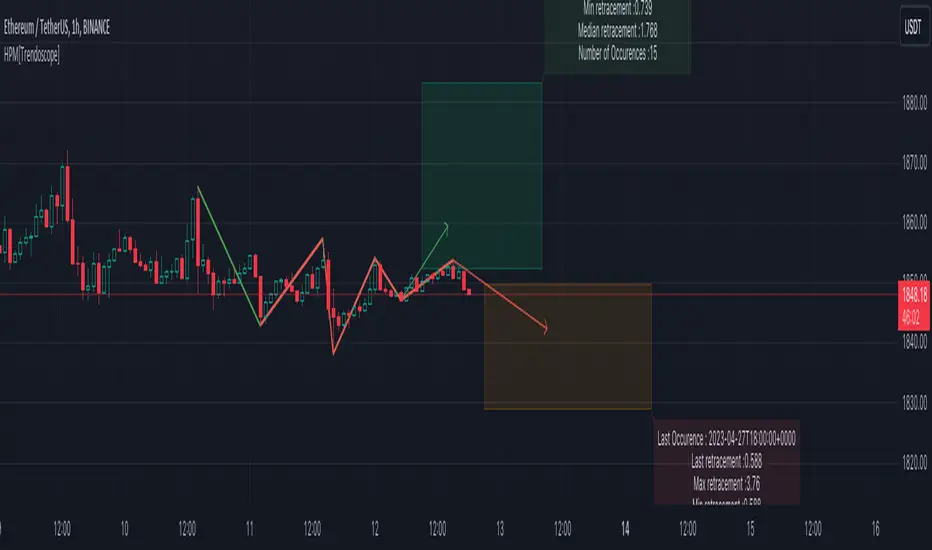
When you load the indicator on the chart, you may see the following patterns and projections.
You may also notice, in the pattern details, information about the last occurrence of the pattern. If you scroll on your chart to the left to the given data and time, you can observe how the past occurrence of the pattern has formed and the price movement past that point.
For example, last occurrence of pattern based on confirmed pivot happened on 02-Jun-2023 00:00 UTC time
And last occurrence of pattern based on unconfirmed pivot happened on 27-Apr-2023 22:00 UTC time
🎲 Settings
Settings are minimal, and here is the meaning of them.
Most important setting here is the number of pivots forming the pattern.
🎲 Caution
The indicator is designed to present the projection based on historical occurrences of similar price pattern. This does not necessarily mean the patterns are supposed to be bullish or bearish. But, it will certainly give users an idea of what happened when similar price action presented historically.
Note to developers This script makes use of new pine script feature - maps
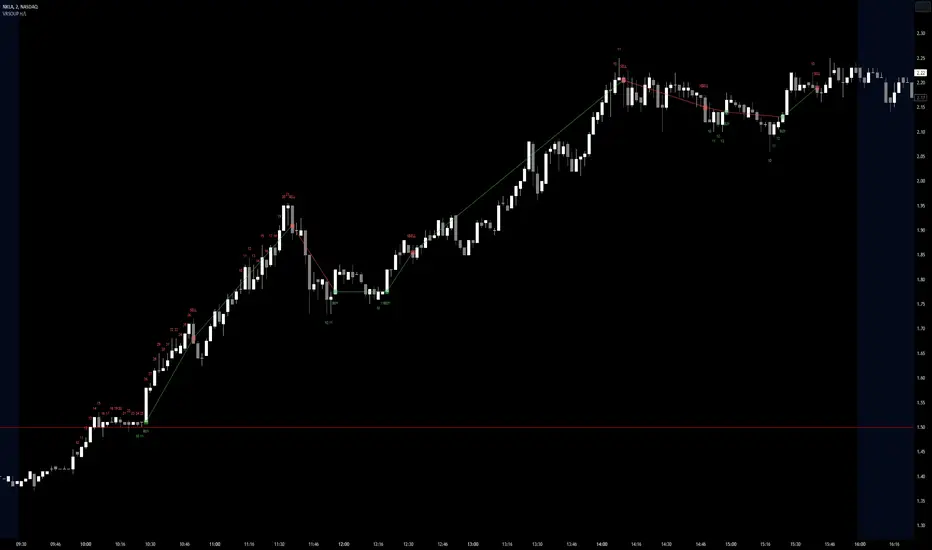
Visible Range Streaks of Unbroken Prior Highs/Lows [vnhilton](OVERVIEW)
This indicator keeps track of the number of unbroken prior highs/lows (unbroken being no price closes above/below the prior high/low). Great for entries and take profits. The indicator calculates on visible bars for convenience when looking back into the history without having to use bar replay, which those on the TradingView free plan cannot use intraday bar replay, so the visible range is a perfect work-around. The 2 minute chart above shows NASDAQ:NKLA on Thursday 13th July, 2023, with a significant level of $1.5 leading to a breakout. Streaks lower than 10 were hidden in the chart.
(FEATURES)
- Custom minimum streak size to start displaying plots (the smaller the size the more signals)
- Ability to show/hide numbers (that keep count of unbroken streaks), text signals (for when a streak is broken), break shapes (where the prior high/low was broken), and Zig Zag (lines between break shapes)
- Customisable Zig Zag line width, style, and colours (1 colour for a positive gradient line, and another for a negative gradient line)
- Customisable text signal text
- Customisable numbers, text signal, break shape, number label & text signal label colours
- Customisable number label, text signal label and break shape styles and sizes (number and text signal label share the same size)
PatternLibrary "Pattern"
Pattern object definitions and functions. Easily draw and keep track of patterns, legs, and points.
Supported pattern types (as of Version 1):
Type Leg validation # legs
"xabcd" Direction 3 or 4 (point D not required)
"zigzag" Direction >= 2
"free" None >= 2
erase_label(this)
Delete the point label
Parameters:
this : Point
Returns: Void
draw_label(this, position, clr, transp, txt_clr, txt, tooltip, size)
Draw the point label
Parameters:
this : Point
position
clr
transp
txt_clr
txt
tooltip
size
Returns: line
leg_init(a, b, prev, next, line)
Initialize a pattern leg
Parameters:
a : Point A (required)
b : Point B (required)
prev : Previous leg
next : Next leg
line : Line
Returns: New instance of leg object
erase(this)
Delete the pattern leg
Parameters:
this : Leg
Returns: Void
erase(this)
Parameters:
this
draw(this, clr, style, transp, width)
Draw the pattern leg
Parameters:
this : Leg
clr : Color
style : Style ("solid", "dotted", "dashed", "arrowleft", "arrowright")
transp : Transparency
width : Width
Returns: line
draw(this, clr, style, transp, width)
Parameters:
this
clr
style
transp
width
leg_getLineTerms(this)
Get the slope and y-intercept of a leg
Parameters:
this : Leg
Returns:
leg_getPrice(this, index)
Get the price (Y) at a given bar index (X) within the leg
Parameters:
this : Leg
index : Bar index
Returns: Price (float)
pattern_init(legs, tp, name, subType, pid)
Initialize a pattern object from a given set of legs
Parameters:
legs : Array of pattern legs (required)
tp : Pattern type ("zigzag", "xabcd", or "free". dft = "free")
name : Pattern name
subType : Pattern subtype
pid : Pattern Identifier string
Returns: New instance of pattern object, if one was successfully created
pattern_init(points, tp, name, subType, pid)
Initialize a pattern object from a given set of points
Parameters:
points
tp : Pattern type ("zigzag", "xabcd", or "free". dft = "free")
name : Pattern name
subType : Pattern subtype
pid : Pattern Identifier string
Returns: New instance of pattern object, if one was successfully created
point
A point on the chart (x,y)
Fields:
x : Bar index (x coordinate)
y
label
leg
A pattern leg (point A to point B)
Fields:
a : Point A
b
deltaX
deltaY
prev
next
retrace
line
pattern
A pattern (set of at least 2 connected legs)
Fields:
legs
type
subType
name
pid
Divergence Backtester - V2Further attempts to study divergence impact on price in shorter terms.
Previous study can be found here:
In this script, we are trying to gather the stats based on last two pivot state together. For example, Individual table of Pivot High Projection is as explained below:
But, by looking at the bigger picture, we can further estimate following things regarding the current unconfirmed pivot and the new pivot which is yet to be formed.

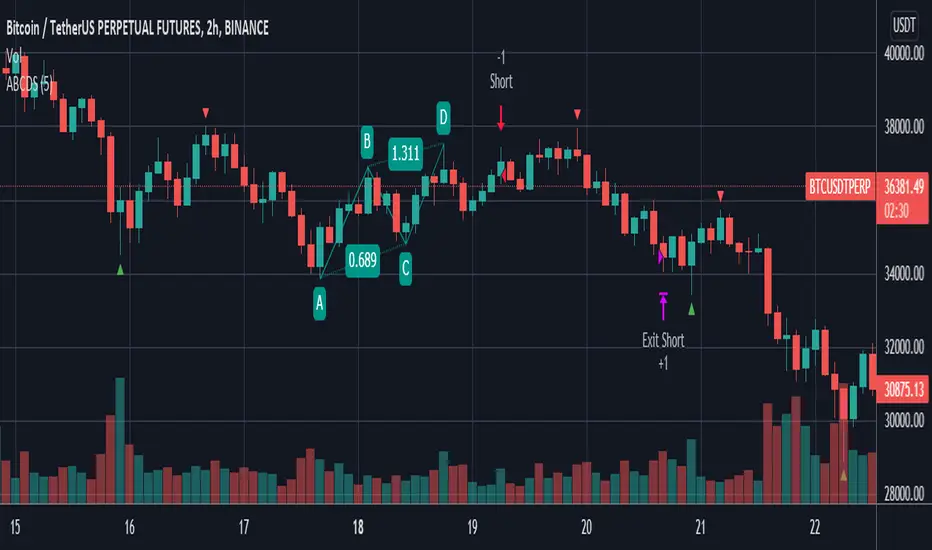
ABCD StrategyOne from many harmonic pattern that consists of two equivalent price legs. The ABCD pattern that helps traders predict when the price is about to change direction.
Tracing And Calculation
This code using pivot high and pivot low built-in method and calculate with Fibonacci Retracement.
Limitation
To find ABCD pattern is very difficult, just coming up a few from thousand candle. That why this code using little bit tolerance ratio to get more pattern.
Manual Harmonic Patterns - With interactive inputsThis script is a drawing tool which allows users to draw XABCD on the chart and script will tell whether there is any harmonic patterns on the drawings made. The script is based on interactive inputs and requires users to chose XABCD points.
Please note
This is not a scanner and it will not scan historical bars for harmonic patterns. This needs to be used rather as drawing tool instead.
Script will not check if selected pivots are correct. It assumes users to know how to select the right XABCD based on pivot high/lows. Bullish pattern will have X, B and D as pivot lows and A,C as pivot highs. Similarly bearish patterns will have X, B, D as pivot highs and A, C as pivot lows.
Script will not check for overflow conditions. For example, if price crosses, XB or BD line, then pattern is considered to be invalid. But, this check cannot be made in this script and we require users to be aware of this condition and select input accordingly.
Order of inputs should be in ascending order. X pivot should come before A and then, B, C, D and F. This again is users responsibility to select pivots in right order.
What happens after selecting XABCD?
If selected pattern is valid harmonic pattern, it will
Draw XABCD lines and labels
Fill harmonic triangles
Show PRZ box which shoes the name of valid patterns.
If it is not valid harmonic pattern, then users will see blank XABCD line without any PRZ or filled harmonic triangles.
Example:
1. When it is valid pattern
2. When it is not valid pattern

Martyv Auto Fib Retracement with Logarithmic SupportSimple & easy auto-fib levels. Took the out-of-the-box version provided by TradingView and added Logarithmic support and a nicer palette, and made the controls a bit nicer to use (in my opinion lol). Enjoy.

Swing Failure Pattern Inquisitor SFP Inquisitor
v0.2a
coded by Bogdan Vaida
Code for Swing High, Swing Low and Swing Failure Pattern.
Note that we're still in the alpha version, bugs may appear.
Note that the number you set in your Swing History variable
will also be the minimum delay you see until the apples appear.
This is because we're checking the forward "history" too.
The SFP will only check for these conditions:
- high above Swing History high and close below it
- low below Swing History high and close above it
In some cases you may see an apple before the SFP that "doesn't fit"
with the SFP conditions. That's because that apple was drawn later and
the SFP actually appeared because of the previous apple .
20 candles later.
Legend:
🍏 - swing high
🍎 - swing low
🧺 - candle where the last swing was driven from
🍌 - swing failure pattern
🍎🍌 - hungry scenario: swing low but also a SFP compared to the last swing

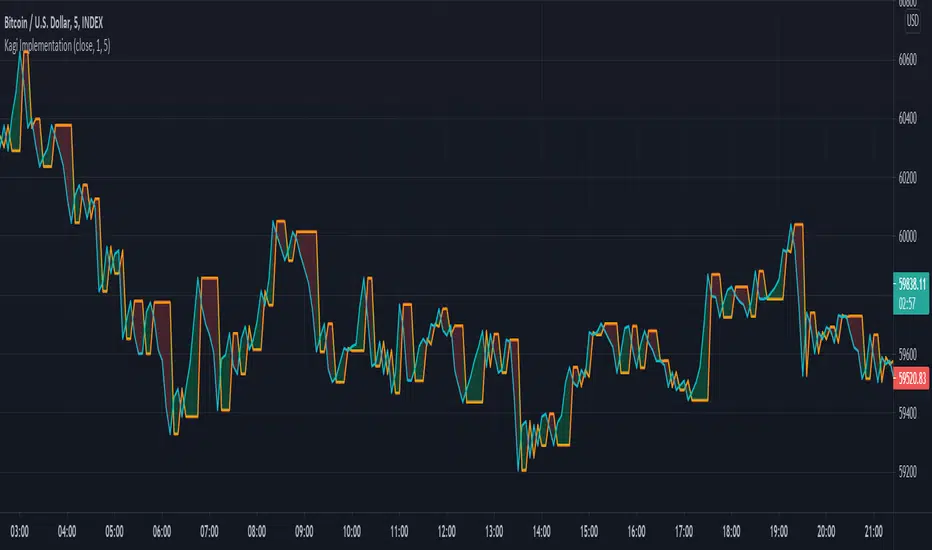
Kagi Implementation (+ATR)My Own Kagi Indicator Implementation!
I couldn't find anywhere on the internet a simple implementation of the Kagi indicator (apart from a seemingly complicated JavaScript implementation).
So I decided to implement it myself and test it against the built-in Kagi indicator calculated by the built-in security function - They ended up exactly the same! (You can see my orange plot completely covers the security's purple plot)
My calculations are based on this article from a site called "euroland", the article is called "Kagi Chart" (I can't post the link because of TradingView restrictions)
Bonus: The built-in kagi indicator uses only Fixed Amount Reversal Size. One that is interested in an ATR Reversal Size can modify the calculation a bit (see script's comments) to easily create and use it.
Some interesting info about the security function I discovered while doing this script:
After I implemented it I noticed that my calculations are the same except the fact that all my values are delayed by 1 bar (relative to the security's indicator). After some research I discovered that the security function uses future data in it's calculation and therefore it cannot be trusted for testing live-trading strategies, unless it is given the appropriate parameters (see script for example).
Have fun trading and don't lose money!
Divergence for Many Indicators v4Hello Traders,
Here is my new year gift for the community, Digergence for Many Indicators v4 . I tried to make it modular and readable as much as I can. Thanks to Pine Team for improving Pine Platform all the time!
How it works?
- On each candle it checks divergences between current and any of last 16 Pivot Points for the indicators.
- it search divergence on choisen indicators => RSI , MACD , MACD Histogram, Stochastic , CCI , Momentum, OBV, VWMACD, CMF and any External Indicator !
- it checks following divergences for 16 pivot points that is in last 100 bars for each Indicator.
--> Regular Positive Digergences
--> Regular Negative Digergences
--> Hidden Positive Digergences
--> Hidden Negative Digergences
- for positive divergences first it checks if closing price is higher than last closing price and indicator value is higher than perious value, then start searching divergence
- for negative divergences first it checks if closing price is lower than last closing price and indicator value is lower than perious value, then start searching divergence
Some Options:
Pivot Period: you set Pivot Period as you wish. you can see Pivot Points using "Show Pivot Points" option
Source for Pivot Points: you can use Close or High/Low as source
Divergence Type: you can choose Divergence type to be shown => "Regular", "Hidden", "Regular/Hidden"
Show Indicator Names: you have different options to show indicator names => "Full", "First Letter", "Don't Show"
Show Divergence Number: option to see number of indicators which has Divergence
Show Only Last Divergence : if you enable this option then it shows only last Positive and Negative Divergences
you can include any External Indicator to see if there is divergence
- enable "Check External Indicator"
- and then choose External indicator name in the list, "External Indicator"
- External indicator name is shown as Extrn
- related external indicator must be added before enabling this option
Coloring, line width and line style options for different type of divergences.
Following Alerts added:
- Positive Regular Divergence Detected
- Negative Regular Divergence Detected
- Positive Hidden Divergence Detected
- Negative Hidden Divergence Detected
Now lets see some examples:
Hidden Divergences:
Regular and Hidden Divergences together:
Showing first letters of indicators:
You can see only the number of indicators which has divergence:
You can see only divergence lines without indicators names and numbers:
option to used different label/line/text colors:
You have option to see only last divergences:
You can change Pivot Period, in following example Pivot Period = 15:
You can use Close or High/Low as Source for Divergence
You can include external indicators and get divergences on it:
Wish you all a happy new year!
Enjoy!
