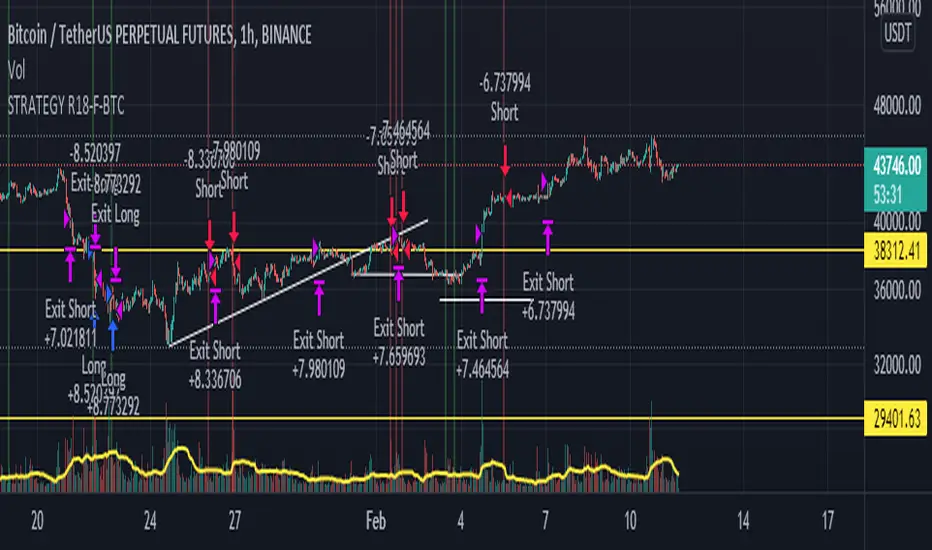
STRATEGY R18-F-BTCHi, I'm @SenatorVonShaft
Just finished the strategy "STRATEGY R18-F-BTC" for trading on #bitcoin and other cryptocurrencies.
As any strategy on TradingView, R18 opens Long/Short positions (with no leverage) on certain price points for assets in the chart. But I intentionally make this strategy for Bitcoin . Strategy is effective with 1h chart and it has %36 winning trade ratio for #bitcoin trade. As strategy uses approximately 1/3 ratio of SL/TP levels, gross profit for 1 year backtest is above %200 (I mean above 3x for only BTC )
Strategy is built on combination of:
- MACD
- RSI
- FIBONACCI levels
- BTCUSDT price itself as indicator (for different crypto assets and BTCUSDTPERP trading. You can select different assets you like for indicator (it's BTCUSDT:Binance by default))
I fine-tuned all levels of indicators above accordingly (it has more than 10 variables that effects strategy itself).
You can find out your own strategy levels by adjusting long/short tp&sl variables as well as initial capital ratio variable.
Reverse option open reverse positions of the strategy
Recherche dans les scripts pour "中芯国际技术面分析指标(如MACD、RSI、布林带)"
Atrend by OTSAtrend is a indiactor used to identify long and short term trends it uses MACD, RSI, ATR, and a DEMA along with some pieces from supertrend, the indicator works good on 1-4 hour time frame

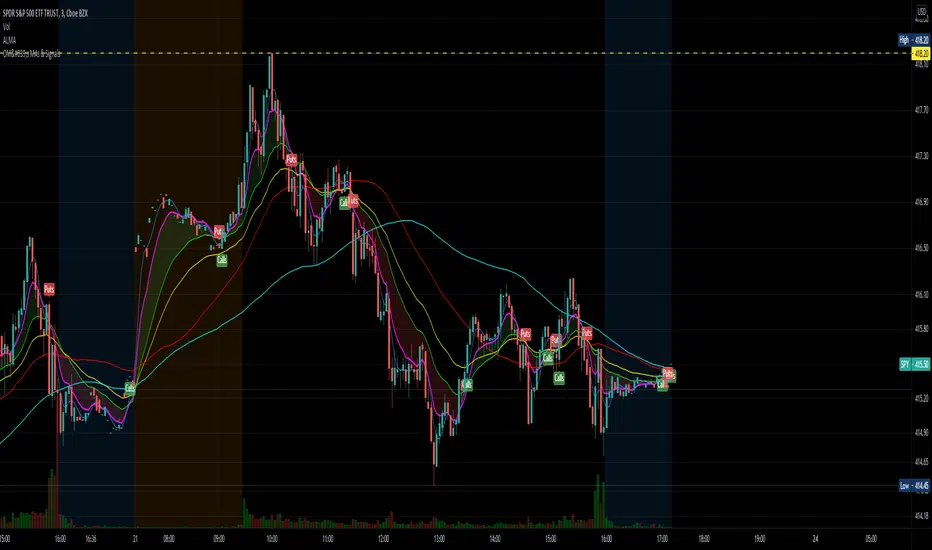
OptionsMillionaire SPY Moving Averages and Signalsby ColeJustice
OptionsMillionaire's SPY Options trading system is based mainly on these indicators:
- 8 EMA*
- 21 EMA*
- 100 SMA*
- 200 SMA*
- MACD
- RSI
- Squeeze Momentum
(*provided by this indicator)
and follows these rules:
|
| 1) I never fight the trend. If its green, i buy calls. If its red, i buy puts. I will only buy puts on a green day if there is a overall change in market trend. Inversely, calls on a red day
| 2) Price action is my #1 indicator. I wait for it to confirm my thesis before i enter a trade
| 3) I only trade SPY Options
| 4) My baseline is to choose a call/put that has a DTE (Date To Expiration) 6-7 days out, with a strike $2-$3 away. I adjust that to fit my current appetite for volatility. i virtually never play same day DTE's.
| 5) I set a 10% stop, but usually exit at 8% before my stop triggers depending on current situation
| 6) I utilize about 10-20% of my Portfolio for one trade. Sometimes more. Rarely less.
| 7) I never hold overnight in these market conditions.
| 8) I shoot for 10-20% for gains. Depending on market conditions.
| 9) Always look for confirmations in your indicators.
| 10) I never force a trade. No trade is a good trade too if the entry just isn't there.
| 11) Patience always pays off. A great set-up can form in minutes or seconds. I never regret being patient to enter. I nearly always regret rushing into a trade.
|
This indicator combines the moving averages into a single unit to simplify one part of the indicator usage rules: the 8 EMA / 21 EMA Cross. . The 8 crossing over the 21 is a Bullish signal, while the 8 crossing under the 21 is a Bearish signal. This indicator places flags at these crossover/under points, as well as shading the area between the 8 and 21 EMAs to help visualize the strength of the trend; green during a Bullish cross, and red during a Bearish cross.
A new addition to this strategy is the Hull Moving Average, or HMA. This script defaults to an HMA of 20 and shows alerts when candles close above or below the plot in the form of green and red candle backgrounds. This alert is best used in conjunction with the main crossovers and should be considered an addition level of confidence rather than providing trade entry/exits directly. This indicator is more flexible and you should feel free to adjust the period if you find a different value works better within your own personal trading style.
Each individual element of this indicator can be modified or toggled, providing maximum customization. While you should strive to become comfortable with the default settings, these options are provided in case you feel the need to adjust for your own style (or if testing on tickers other than SPY, for example).
Goodluch, and happy trading!
Simple strategy IndicatorHello, this is my Indicator, based on my MACD+RSI+Stoch trading strategy
You can use it by your own and try to apply it on any market
Please, adjust any parameters and don't forget to leave a feedback and comments

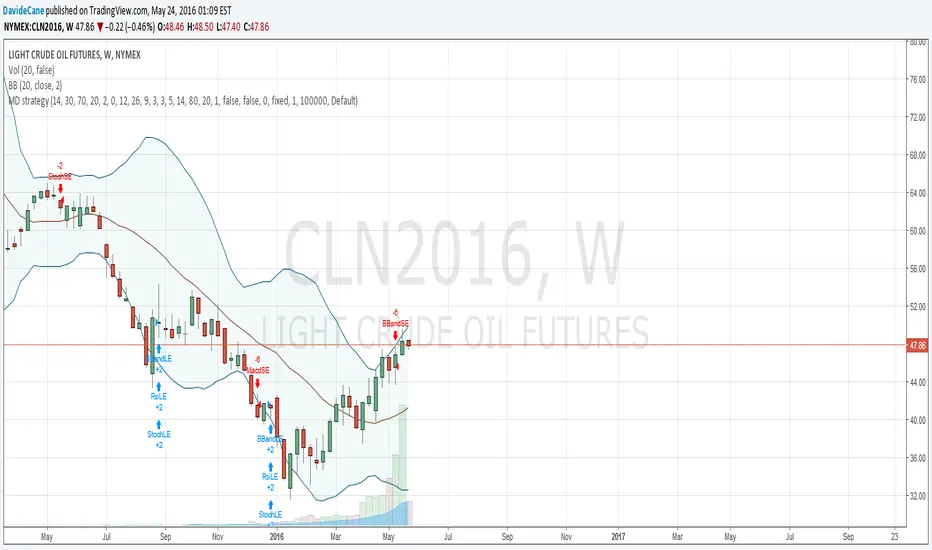
Multi-Oscillator Divergence StrategyNote: This is a modified version of TradingView's built-in "Divergence Indicator" and applied in "Strategy" format to show back testing results
It finds bullish and bearish divergence in a selection of well known MA formulas: MACD, RSI, STOCH, DETRENDED PRICE OSCILLATOR, MOMENTUM.
I've found good results even on 1 minute charts!
In this example the chart backtest is utilizing the detrended price oscillator (DPO)
There are multiple variables, so the ability to find good back test can sometimes be "time consuming"
And please note that if you increase "Pivot LookBack Right" variable too high, then you will increase chance of repaint. Keep this variable as low as possible
I've also drawn my own solutions on the chart (red and green trend lines) to find good take profit and safe stop loss. In order to study this properly you need the own the chart. Scripts don't give you this option.
See private chart publication link to "own" the chart for yourself. Simply click on the "Share" button (it's the megaphone icon) and click on "Make it Mine"
I've found the best approach is to create 5 copies of indicator on 1 chart and have each running with different MA formula. This will give you a majority consensus type environment.
I will post study with alert conditions next
Good luck and enjoy!

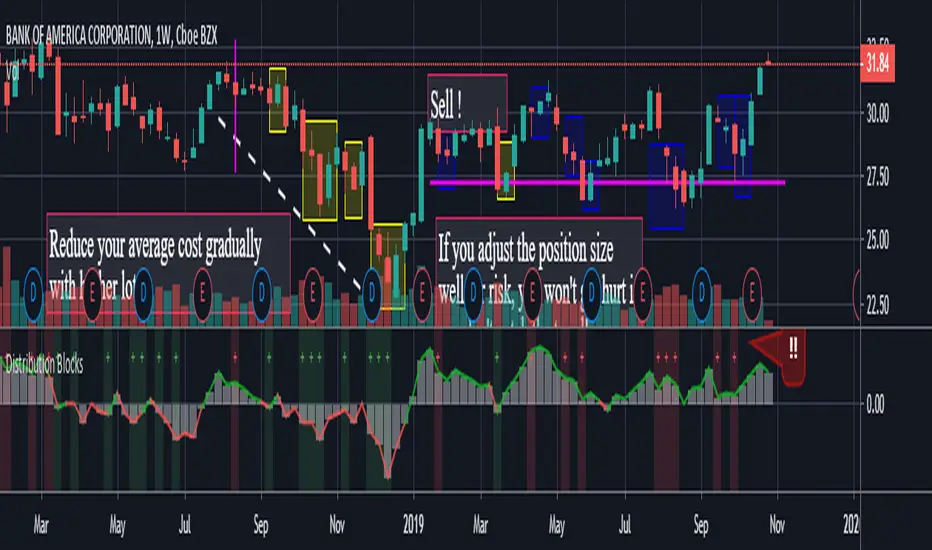
Distribution BlocksThis idea has been created by the combination of the two existing systems as a result of my efforts to create a distributional buying and selling guide that has plagued my head for a long time.
1st idea is Accumulation / Distribution Line :
2nd idea is Distribution Day :
These two ideas, the intellectual assistance of professional brokers, and my observations of cot data played a role in the formation of this idea.
Let's start.
No matter how often we divide our risk, both our minds are not comfortable and our capital may end at any moment, and if we do not use professional systems, our chances of success are 50 percent.
If we take this system as an aid to our classic systems, we can determine the amount of risk with those predictions and gradually trade.
If we don't use leverage and we have a little predictive ability, our chances of success go above 50 percent.
But for the first time, we can keep our first lot very low and increase the number of positions in the same order of orders (example: buy and buy and buy).
If we keep the first amount low, the folds won't hurt us.
When we catch up with the trend, purchases with larger position sizes than lower prices lower our average price, so that we can make a good profit when the rising trend starts.
By accepting the zone changes as the reset point just like in the martingale system, we enter the folds in the new zone with our first lot weight.
Although we cannot catch the trend, we determine the stoploss level by adding the first point we entered or the first point we entered and the commission cost.
In fact, this method is the method of buying and selling very large traders and producers, banks, pro-brokers, hedge funds and in other words the new popular phrase "whales".
Because if he trades otherwise, he cannot find buyers because his goods are too big.
I like the comfort of mind in this way.
Finally, your methods separating the negative and positive regions (macd, rsi, interpretation observation etc.)
the stronger you are, the higher your success rate.
I think the Accumulation Distribution method is very successful, but it can be adjusted for the period.
I can't wait to integrate my relativity system on this.
And when my deep learning series is over, I will integrate them on ANN series and share them publicly.
To start with, I can say briefly.
If your capital is 100:
(first lot + (increase multiplier * first lot) + (increase multiplier * increase multiplier * first lot) + .....) = 100
I tell you that you can have the same position in this series 10 - 15 times,
this will help you decide how small a position size is to be used as the starting rate and choose a low increment multiplier!
I think that this idea cannot be converted into strategy, because when our expectations come true, we may want to free all positions and start again.And I think that's better.
And in sudden movements and developments we take action with different expectations.
I'm going to talk about this script's calculations and profits on educational ideas.
Regards , Noldo.


40 DOMINANT ALTCOINS BINANCEThis indicator is a combination of 40 different altcoins which are found on Binance exchange.
I have listed all Binance altcoins in the order of the oldest listed and the newest.
Due to limitations on TV for calling only 40 securities at the same time, I have limited myself with adding only the oldest ones (9+ months) and some 8+ to make up at least 40 for more data.
I have excluded BTC, BCC, ETH, USDT, BNB from list as these are the trading pairs.
I have some updates in mind and will try to add more options in coming months
Regularly updating 40 altcoins list by sorting them by market cap and available historical data from Binance
Adding Bitfinex, Bittrex and other exchanges separetly, as there is only 40 security call limit
Adding ETH; USDT pairs for all above exchanges.
You can add any indicator to this indicator - such as MACD, RSI, EMA and so on to help you analyse it more deeper
When you load this indicator, it takes about 1 min wait as it takes and calculates a lot of data. After it is loaded, it works perfectly.
Currently there is only 40 oldest altcoins to gather enough data, but as time passes, I will change some of them to create better picture of alt coins.
Please report any problems and give feedback.
Any idea of improvement is welcome and I will try my best.
Please support me an consider to give a small tip to addresses bellow. It would greatly help me to free more time for improvements as I am working to support family and my time is limited for markets.
ETH: 0xac290B4A721f5ef75b0971F1102e01E1942A4578
BTC: 39p3rKuJYKGqph1Qs35yEfNWoPvpUJBBcy
This will greatly help me to keep update this indicator and give me more time to analyse and sort out all altcoins my their market cap, volume and influence.

_CM_COT Commercial Net Interest_V1Overview.
-This is the Beginning of a Educational Series from Jake Bernstein to the TradingView Community.
-Many Traders use the COT Data Incorrectly.
-Jake Discovered if You Look at the Net Commercials and Take Note When Commercials net Buying is Either At All Time Highs, Or Net Buying = Longest Period of Buying Look for an Extreme Move To the Upside.
-In The Future We Will Show Precise Entry Signals…But a Basic Entry Signal Is When Commercials Go From Net Long to Net Short.
-Full Credit in Methodology goes to Jake Bernstein at www.Trade-Futures.com and www.2Chimps.net
Thought Process:
-Commercials Represent Large (Typically Billion Dollar) Companies.
-Take Note - When Commercials Are Buying at Record High
-Take Note - When Commercials Are Buying For Record Long Periods of Time
***Note…Commercials Can Buy For Extended Periods Dollar Cost Averaging…
***Basic Entry Listed In Overview.
***More Precise Entries Will Be Introduced Soon.
Indicator Shows Net Commercials
-Full Credit goes to Greeny for Creating Original Code. I only made slight modifications.
Modifications include
-Took Off Net Long and Short Individual Plots
-Added Optional Background Highlighting when Commercials Switch from Long to Short
-Added Optional Alert Capability If Commercials Go From Net Long to Short
-Ability to Show INVERSE - This makes it Easier for some Traders to See…Since the Signals look similar to MacD/RSI Type Indicators.
***Additional Indicators and Updates Coming Soon
***Link To Upper Indicator:
