GIRISH indicatorHello traders,
This indicator is the enhancement to my previous indicator (RSI+OBV). There is combined RSI and OBV with DMI. This new indicator is combination of RSI and OBV with VWAP . I have been using this indicator for intraday trades in NIFTY & BANKNIFTY .
The white line indicates the movement of VWAP wrt current price. There default range for this has been defined as -40 to 40 .
Entry for long: When white line goes below -40, we need to wait for green background. Entry has to be taken when green background appears. If price goes below the entry point, averaging can be done once. Price will surely go long and give us good profit.
Entry for short: When white line goes above 40 , we need to wait for red background (if darker red comes, it is better) . Entry has to be taken when red background appears. If price goes above the entry point, averaging can be done once. Price will surely go down and give us good profit on short side.
PS: Please do back testing in chart before taking trades.
Recherche dans les scripts pour "信达股份40周年"

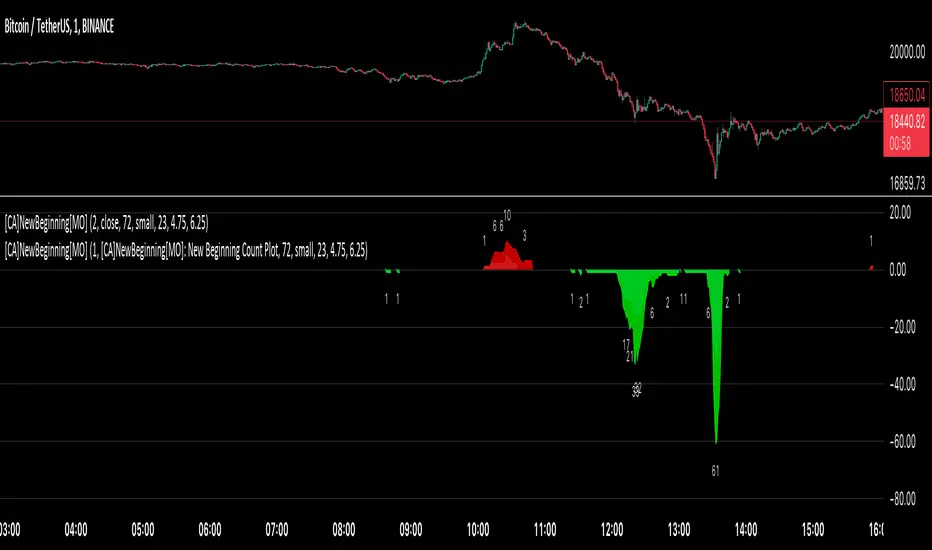
[ChasinAlts] A New Beginning[MO]Hello Tradeurs, firstly let me say this… Please do not think that this dump is over (so I want to gift you one of the best gifts I CAN gift you at the PERFECT TIME...which is now) but I believe it to be the final one before a New Beginning is upon us. I hope that anybody that sees this within the next day or so listens to me when I tell you this… Follow the instructions below, IF ANYTHING, just to set the alert to be notify you so you can see why I’m about to tell you everything that I’m about to tell you. That being that this indicator is pure magic…..BUT you must stay in your lane when using it (ie. ultimately, understand its use case) and most importantly, how many people you expose it to. The good thing about it is it produces very few alerts. In fact, it was built SOLELY to find the very tips of MAJOR dumps/pumps (with its current default settings). I honestly cannot remember where I acquired the code so if anyone recognizes it please direct me to the source so I can give a shoutout. In the past it has been so astonishingly accurate that I didn’t want to publish it but I've just been...in the mood I suppose recently.
Now…it is SPECIFICALLY meant for the 1min TF. I’ll say it again… It is meant for ONE MINUTE CHARTS…it was built for 1min charts, it will only work as well as I’m describing to you on the…you guessed it…ONE MINUTE CHART (again, with the default settings how they are, that is). If any of you use it for this present dump (November 8, 2022) and want to thank me for it or speak very highly about it or give it a bunch of likes… DO NOT!!! I will reword this so you fully comprehend my urgency on this matter. I do not want this indicator getting out for every Joe Schmoe (or stupid YouTuber) to use and spread because the manipulators will see to it that it will no longer work. Things that will happen that will cause it to gain the popularity that I do not want it to have are the following:
1) You "like" the indicator in TradingView to show appreciation/that your using it so that it will show up in your indicators list (to get past this you need to select all of the text of the script on the indicator's page and copy and paste it into the “Pine Editor”. Then select "save" and name it as you wish. Now, it is in your indicator list under the name that you saved it as.
2) You *favorite* the indicator in TradingView
3) You leave comments in the comments section on the indicators page in TradingView (I really do love hearing comments about anything regarding my indicators(positive or negative..though I haven't gotten any negative yet SO BRING IT ON), even though I don’t get too many of them, so if you are grateful (or hateful) PLEASE message me privately (and really I truly truly do appreciate getting comments/messages so if it has benefited you make sure to message me as I might have more for those that do express their gratitude) and tell me anything that you want to tell me or ask me anything that you wanna ask me there).
One major thing that will help to suppress its popularity will be that if anybody goes back on historical charts to see its accuracy they most likely will not be able to go far back enough on the 1min TF to be able to Witness its efficacy so I'm banking on that helping to keep a lid on things.
The settings used (as well as the TF used) really should not be changed if using it for its intended purpose. On little dumps that last for a few hours os so will produce points somewhere in the 40 to 60 range at the dumps/pumps peak. Each coin is worth one point and there are 40 coins per set and 2 sets (that you will have to link together) and when the under the hood indicator is triggered for that coin it will add a point to the score. With the settings how they are and on the 1min TF(if I hadn't mentioned it yet. lol) a good point alert threshold to use to catch the apex of heavy pumps/dumps would be between 70 to 80 points(80 is max). Ultimately is the users choice to input the alert threshold of points in the indicators settings(default is 72). If you’re trying to nail the very bottom of a hard pump/dump, DO NOT fall for times where it peaks at 50 to 60. You’re looking for 70 or above.
*** This is the most important thing to do as you will not receive an alert if you do not do this correctly. You have to add the indicator two times to the chart. One of the indicators needs to be under “Coin Set 1“ and the other under “Coin Set 2“. Now, in “Set 1“ you need to go to the setting entitled “Select New Beginning Count Plot from drop-down“ and you need to open the drop-down and select the plot entitled “A New Beginning Count Plot”. This will link both the indicators and since there are 40 coins per iteration of the script, when you link them it could give you a max of 80 points total at the very peak of a very strong dump...which will obviously be rare. You CAN use only one copy of the script (but need to change the alert setting to a MAX of 40) but in my experience it's best to use both of them and to link them. It gives you a more well-rounded outcome. Good luck my people and always remember...Much love...Much Love. May the force be with your trades. -ChasinAlts out.
Time█ OVERVIEW
This library is a Pine Script™ programmer’s tool containing a variety of time related functions to calculate or measure time, or format time into string variables.
█ CONCEPTS
`formattedTime()`, `formattedDate()` and `formattedDay()`
Pine Script™, like many other programming languages, uses timestamps in UNIX format, expressed as the number of milliseconds elapsed since 00:00:00 UTC, 1 January 1970. These three functions convert a UNIX timestamp to a formatted string for human consumption.
These are examples of ways you can call the functions, and the ensuing results:
CODE RESULT
formattedTime(timenow) >>> "00:40:35"
formattedTime(timenow, "short") >>> "12:40 AM"
formattedTime(timenow, "full") >>> "12:40:35 AM UTC"
formattedTime(1000 * 60 * 60 * 3.5, "HH:mm") >>> "03:30"
formattedDate(timenow, "short") >>> "4/30/22"
formattedDate(timenow, "medium") >>> "Apr 30, 2022"
formattedDate(timenow, "full") >>> "Saturday, April 30, 2022"
formattedDay(timenow, "E") >>> "Sat"
formattedDay(timenow, "dd.MM.yy") >>> "30.04.22"
formattedDay(timenow, "yyyy.MM.dd G 'at' hh:mm:ss z") >>> "2022.04.30 AD at 12:40:35 UTC"
These functions use str.format() and some of the special formatting codes it allows for. Pine Script™ documentation does not yet contain complete specifications on these codes, but in the meantime you can find some information in the The Java™ Tutorials and in Java documentation of its MessageFormat class . Note that str.format() implements only a subset of the MessageFormat features in Java.
`secondsSince()`
The introduction of varip variables in Pine Script™ has made it possible to track the time for which a condition is true when a script is executing on a realtime bar. One obvious use case that comes to mind is to enable trades to exit only when the exit condition has been true for a period of time, whether that period is shorter that the chart's timeframe, or spans across multiple realtime bars.
For more information on this function and varip please see our Using `varip` variables publication.
`timeFrom( )`
When plotting lines , boxes , and labels one often needs to calculate an offset for past or future end points relative to the time a condition or point occurs in history. Using xloc.bar_index is often the easiest solution, but some situations require the use of xloc.bar_time . We introduce `timeFrom()` to assist in calculating time-based offsets. The function calculates a timestamp using a negative (into the past) or positive (into the future) offset from the current bar's starting or closing time, or from the current time of day. The offset can be expressed in units of chart timeframe, or in seconds, minutes, hours, days, months or years. This function was ported from our Time Offset Calculation Framework .
`formattedNoOfPeriods()` and `secondsToTfString()`
Our final two offerings aim to confront two remaining issues:
How much time is represented in a given timestamp?
How can I produce a "simple string" timeframe usable with request.security() from a timeframe expressed in seconds?
`formattedNoOfPeriods()` converts a time value in ms to a quantity of time units. This is useful for calculating a difference in time between 2 points and converting to a desired number of units of time. If no unit is supplied, the function automatically chooses a unit based on a predetermined time step.
`secondsToTfString()` converts an input time in seconds to a target timeframe string in timeframe.period string format. This is useful for implementing stepped timeframes relative to the chart time, or calculating multiples of a given chart timeframe. Results from this function are in simple form, which means they are useable as `timeframe` arguments in functions like request.security() .
█ NOTES
Although the example code is commented in detail, the size of the library justifies some further explanation as many concepts are demonstrated. Key points are as follows:
• Pivot points are used to draw lines from. `timeFrom( )` calculates the length of the lines in the specified unit of time.
By default the script uses 20 units of the charts timeframe. Example: a 1hr chart has arrows 20 hours in length.
• At the point of the arrows `formattedNoOfPeriods()` calculates the line length in the specified unit of time from the input menu.
If “Use Input Time” is disabled, a unit of time is automatically assigned.
• At each pivot point a label with a formatted date or time is placed with one of the three formatting helper functions to display the time or date the pivot occurred.
• A label on the last bar showcases `secondsSince()` . The label goes through three stages of detection for a timed alert.
If the difference between the high and the open in ticks exceeds the input value, a timer starts and will turn the label red once the input time is exceeded to simulate a time-delayed alert.
• In the bottom right of the screen `secondsToTfString()` posts the chart timeframe in a table. This can be multiplied from the input menu.
Look first. Then leap.
█ FUNCTIONS
formattedTime(timeInMs, format)
Converts a UNIX timestamp (in milliseconds) to a formatted time string.
Parameters:
timeInMs : (series float) Timestamp to be formatted.
format : (series string) Format for the time. Optional. The default value is "HH:mm:ss".
Returns: (string) A string containing the formatted time.
formattedDate(timeInMs, format)
Converts a UNIX timestamp (in milliseconds) to a formatted date string.
Parameters:
timeInMs : (series float) Timestamp to be formatted.
format : (series string) Format for the date. Optional. The default value is "yyyy-MM-dd".
Returns: (string) A string containing the formatted date.
formattedDay(timeInMs, format)
Converts a UNIX timestamp (in milliseconds) to the name of the day of the week.
Parameters:
timeInMs : (series float) Timestamp to be formatted.
format : (series string) Format for the day of the week. Optional. The default value is "EEEE" (complete day name).
Returns: (string) A string containing the day of the week.
secondsSince(cond, resetCond)
The duration in milliseconds that a condition has been true.
Parameters:
cond : (series bool) Condition to time.
resetCond : (series bool) When `true`, the duration resets.
Returns: The duration in seconds for which `cond` is continuously true.
timeFrom(from, qty, units)
Calculates a +/- time offset in variable units from the current bar's time or from the current time.
Parameters:
from : (series string) Starting time from where the offset is calculated: "bar" to start from the bar's starting time, "close" to start from the bar's closing time, "now" to start from the current time.
qty : (series int) The +/- qty of units of offset required. A "series float" can be used but it will be cast to a "series int".
units : (series string) String containing one of the seven allowed time units: "chart" (chart's timeframe), "seconds", "minutes", "hours", "days", "months", "years".
Returns: (int) The resultant time offset `from` the `qty` of time in the specified `units`.
formattedNoOfPeriods(ms, unit)
Converts a time value in ms to a quantity of time units.
Parameters:
ms : (series int) Value of time to be formatted.
unit : (series string) The target unit of time measurement. Options are "seconds", "minutes", "hours", "days", "weeks", "months". If not used one will be automatically assigned.
Returns: (string) A formatted string from the number of `ms` in the specified `unit` of time measurement
secondsToTfString(tfInSeconds, mult)
Convert an input time in seconds to target string TF in `timeframe.period` string format.
Parameters:
tfInSeconds : (simple int) a timeframe in seconds to convert to a string.
mult : (simple float) Multiple of `tfInSeconds` to be calculated. Optional. 1 (no multiplier) is default.
Returns: (string) The `tfInSeconds` in `timeframe.period` format usable with `request.security()`.

Runners & Laggers (scanner)Firstly, seems to me this may only work with crypto but I know nothing about the other sectors so i could be wrong. I was trying to think up a good way to find moving coins(other than by volume bc theres holes in the results when using it this way). Thought this was an interesting concept so decided to publish it as I've seen no others like it (though i did not extensively search for it. We need to start with a little Tradingview(TV) common knowledge. When there is no update of trades/volume in a candle TV does not print the candle. So when looking at (let's say) a 1 second chart, if the coin being observed by the user has no update from a trade in the time of that 1 sec candle it is skipped over. This means that a coin with a ton of volume might fill an entire 60 seconds with 60 candles and conversely with a low volume coin there could be as little as 0 1-second candles. BUT even for normally low volume coins, when a pump is beginning with the coin it could literally go from 0 1-second candles within a minute to 60 1-second candles within the next minute. ***NOTE: This DOES NOT show ANY information if the coin is going up or down but rather that a LOT more trading volume is occurring than normal.*** What this script does is scans (via request.security feature) up to 40 coins at a time and counts how many candles are printed within a user set timespan calculated in minute. 1 candle print per incremented timeframe that the chart is on. ie. if the chart is a 1 min chart it counts how many 1 min candles are printed. So, (as is in the captured image for the script) if you wanted to count how many 5 second candles are printed for each coin in 1 min then you would have to put the charts timeframe on 5sec and the setting titled 'Window of TIME(in minutes) to count bars' as 1.0 (which bc it's in minutes 1.0m = 60sec and bc 60s / 5s = 12 there would be 12 possible values that each coin can be at depending on how many bars are counted within that 1min/60sec. *** I will update to show an image of what I'm talking about here. Now, the exchange I'm scanning here is Kucoin's Margin Coins. There are 170 something coins total but I removed a few i didn't care for to make it a round 40 coins per set (there being 4 sets of 40 coins total=160 coins being scanned). To scan all 4 sets the indicator must be added 4 times to the chart and a different 'set' selected for each iteration of the script on the chart. Free users can only scan 3 at the most. All others can scan all 4 sets. In the script you can change the exchange and coins as necessary. If there done so and there are not 40 coins total just put '' '' in the extra coins spots that are not filled and the script will skip over these blankly filled spots. The suffix (traded pair) for the tickerID on all Kucoin's Margin Coin's is USDT so that's what i have inputted in the main function on line 46 (will need to be changed if that differs from the coins you want to scan. Next in the line of settings is 'Window of TIME(in minutes) to count bars' which has already been discussed. Following that is the setting "Table Shows" which the results are all in a table and the table will present the coins that have either "Passed" or "Failed" depending on which you choose. The next setting determines what passes or fails. If there are 12 possible rows for the coins to be in (as described above) then this setting is the "Pass/Fail Cutoff" level. So if you want to show all the coins that are in rows 11 and 12 (as in the image at top) then 11 should be selected here. At this point you will see all the coins that have a lot of volume in them. Finding coin names in the table that are usually not with a ton of volume will present your present movers. NOTE: coins like BTC and ETH will almost always be in these levels so it does not indicate anything different from the norm of these coins. Last setting is the ability to show the table on the main window or not. Hope you enjoy and find use in it. BTW this screener format is the same as the others I have published. If you like, check those out too. If you find difficulty using then refer to those as well as they have additional info in them on how to use the scanner and its format. Lastly, in the script is the ability to print the plots and labels but I commented them out bc its really just a jumbled mess. In the commented out sections there is a Random Color Function (provided by @hewhomustnotbenamed which was developed on the basis of Function-HSL-color by @RicardoSantos. All right, peace brothers....and sisters.
**** Also, I see how the "levels" could be confusing so I will put them into a % format soon (probably not today) so that the "Pass/Fail Cutoff" can be in % format so that if "passed" is chosen and 50% is chosen (in the new setting that will be changed) then it'll show you all the coins that have more than 50% of the bars printed within the time window chosen. Goodluck in all your trading adventures. ChasinAlts out.

[kai]Futility RatioAn indicator that measures movement inefficiency
Inefficient movement, that is, the range market becomes a high number, the limit is reached at about 60 and a trend occurs
When the range breaks and a trend occurs, the inefficiency drops to about 40 and many trends end.
The full-scale trend goes down further and goes down to about 25, which is evaluated as an efficient movement, the limit is reached and the trend ends.
As for how to use this Inge, the direction of the trend needs to be considered in other ways.
Create a position when you reach 60
Position closed or contrarian at 40 or 25
I assume the usage
動きの非効率性を測定するインジケーターです
非効率な動きをするつまりレンジ相場は高い数字になって、60程度で限界が訪れてトレンドが発生します
レンジがブレイクしトレンドが発生すると40程度まで非効率性は下がりって多くのトレンドは終了します
本格的なトレンドはさらに下がっていって効率的な動きと評価される25程度まで下がって限界が訪れてトレンドが終了します
このインジの使い方はトレンドの方向は他の方法で考える必要がありますが
60まで上がったときにポジション作成
40又は25でポジションクローズ又は逆張り
という使い方を想定しています

Multiple Screeners with AlertsI already published few version of my custom screeners. Unfortunately, because of TradingView's security function call limit you can't use more than 40 stocks in 1 screener.
Fortunately, you can compute multiple values in your function and screen few indicators at once.
In this script I show how you can compute 5 indicators at the same time for 40 instruments. I display then in different labels.
Every label consist of list of instruments satisfying current indicator conditions and a value for it. It can be absolute value as for RSI or -1/1 representing Bullish/Bearish event.
Also you can create 1 alert with result of all screeners inside.
In this example I took 5 indicators with following conditions:
RSI - "RSI < 30" or "RSI > 70"
TSI - "TSI < -30" or "RSI >30"
ADX - "ADX > 40"
MACD - "MACD Bullish Cross" or "MACD Bearish Cross" (1 and -1 in screener)
AO - "AO Crosses 0 UP" or "AO Crosses 0 DOWN" (1 and -1 in screener)
Params
- bars_apart - this parameter define how may bars apart you labels are on your chart. If you see labels overlapping, increase this number.
- Parameters for all used indicators
- 40 symbol inputs for instruments you want to use in this screener
Alerts
You can create an alert from it easily by selecting screener name from the list and then selecting "Any alert() function call".
No additional configuration is required, message and alert on close is generated in the code.
You should better change default name for your alert. Sometimes because of big amount of inputs you might receive an error.
Disclaimer
Please remember that past performance may not be indicative of future results.
Due to various factors, including changing market conditions, the strategy may no longer perform as good as in historical backtesting.
This post and the script don’t provide any financial advice.

RSI_SpeedUp_Volume measures the speed of purchases.If the RSI indicator shows the dominance of purchases over sales, it is interesting to know the speed of purchases. We calculate the speed using the wt indicator. We compute WT (RSI,len). Setting and designation of indicator RSI_SpeedUP. The RSI lines you are looking for are shown in smooth lines. The speed is shown by stepped lines.
In the indicator RSI and speed are calculated in two ways. The first method-calculations are made from the closing price.
The second way is from the volume price. Volume price is the closing price multiplied by volume. Basic settings of the RSI_SpeedUp-V indicator (1,24,9,40,14). What they mean?
RSI is calculated for two periods 24 and 9. The first parameter in the setting is "1", that the display of lines will be from the first period = 24. If the parameter is "2", the lines will be displayed from the second period = 9.
If the parameter is "3", the display will be simultaneously from both periods.
The fourth parameter " 40 " shows the width of the green and pink areas.
The fifth parameter " 14 " is the period with which the wt rate is calculated(rsi,14).
By default, the indicator window displays only the rates from the simple price and the volume price. In order to enable the display of RSI lines, press the "vkl RSI"button.
The blue line is RSI (close). Blue line-RSI (close*volume). Stepped green-speed from simple price wt(rsi (close)). Step brown line-speed from the volume price wt(rsi (close*volume)).
How to use. The volume price starts to react to the trend change earlier. Long before the reversal, it changes its direction. Comparison with the simple price speed line gives additional information about the market mood.
Good luck with your trading.
--------------------------
Если индикатор RSI показывает доминирование покупок над продажами, то интересно знать скорость покупок. Скорость мы вычисляем с помощью индикатора WT. Мы вычисляем WT ( RSI,len). Настройки и обозначения индикатора RSI_SpeedUP. Искомые линии RSI показаны гладкими линиями. Скорость показана ступенчатыми линиями.
В индикаторе RSI и скорость вычисляются двумя способами. Первый способ - вычисления производятся от цены закрытия. Второй способ от объемной цены. Объемная цена это цена закрытия умноженная на объем. Базовые настройки индикатора RSI_SpeedUp-V (1,24,9,40,14). Что они означают?
RSI вычисляется для двух периодов 24 и 9. Первый параметр в настройке "1" , что отображение линий будет от первого периода = 24. Если параметр "2", то отображение линий будет от второго периода = 9. Если параметр "3", то отображение будет одновременно от обоих периодов.
Четвертый параметр "40" показывает ширину области зеленой и розовой.
Пятый параметр "14" это период с которым вычисляется скорость wt(rsi,14).
По умолчанию в окне индикатора отображаются только скорости от простой цены и от объемной цены. Для того чтобы включить отображение линий RSI надо нажать кнопочку "vkl RSI".
Синяя линия - RSI (close). Голубая линия - RSI (close*volume). Ступенчатая зеленая - скорость от простой цены wt(rsi(close)). Ступенчатая коричневая линия - скорость от объемной цены wt(rsi(close*volume)).
Как пользоваться. Объемная цена раньше начинает реагировать на изменение тенденции. Задолго до разворота она изменяет своё направление. Сравнение с линией скорости простой цены дает дополнительную информацию о настроении рынка.
Успехов Вам в торговле.

Aroon Single Line This indicator converts double lined Aroon indicator into a single line oscillator.
It is simply obtained by subtracting Aroon down from Aroon Up.
*If Oscillator points 100 value, it means there is a Strong Uptrend.
*If Oscillator points values between 100 and 40, it means there is an uptrend.
*If Oscillator points values between 20 and -20, it means no trend, it is sideways.But, when it is sideways; generally, oscillator makes FLAT LINES
between 20 and -20 values. 0 value is pointed out when the trend is downward as well, which means aroon up=aroon down.
*If Oscillator points values between -40 and -100, it means there is a downtrend.
*If Oscillator points -100 value, it means there is a Strong downtrend.
(20, 40) and (-20, -40) intervals are not mentioned, because; generally these are transition values and hard to comment, it will be more certain to
wait till values are between or at the reference values given.

SR & POI Indicator//@version=5
indicator(title='SR & POI Indicator', overlay=true, max_boxes_count=500, max_lines_count=500, max_labels_count=500)
//============================================================================
// SUPPLY/DEMAND & POI SETTINGS
//============================================================================
swing_length = input.int(10, title = 'Swing High/Low Length', group = 'Supply/Demand Settings', minval = 1, maxval = 50)
history_of_demand_to_keep = input.int(20, title = 'History To Keep', group = 'Supply/Demand Settings', minval = 5, maxval = 50)
box_width = input.float(2.5, title = 'Supply/Demand Box Width', group = 'Supply/Demand Settings', minval = 1, maxval = 10, step = 0.5)
show_price_action_labels = input.bool(false, title = 'Show Price Action Labels', group = 'Supply/Demand Visual Settings')
supply_color = input.color(color.new(#EDEDED,70), title = 'Supply', group = 'Supply/Demand Visual Settings', inline = '3')
supply_outline_color = input.color(color.new(color.white,75), title = 'Outline', group = 'Supply/Demand Visual Settings', inline = '3')
demand_color = input.color(color.new(#00FFFF,70), title = 'Demand', group = 'Supply/Demand Visual Settings', inline = '4')
demand_outline_color = input.color(color.new(color.white,75), title = 'Outline', group = 'Supply/Demand Visual Settings', inline = '4')
bos_label_color = input.color(color.white, title = 'BOS Label', group = 'Supply/Demand Visual Settings')
poi_label_color = input.color(color.white, title = 'POI Label', group = 'Supply/Demand Visual Settings')
swing_type_color = input.color(color.black, title = 'Price Action Label', group = 'Supply/Demand Visual Settings')
//============================================================================
// SR SETTINGS
//============================================================================
enableSR = input(true, "SR On/Off", group="SR Settings")
colorSup = input(#00DBFF, "Support Color", group="SR Settings")
colorRes = input(#E91E63, "Resistance Color", group="SR Settings")
strengthSR = input.int(2, "S/R Strength", 1, group="SR Settings")
lineStyle = input.string("Dotted", "Line Style", , group="SR Settings")
lineWidth = input.int(2, "S/R Line Width", 1, group="SR Settings")
useZones = input(true, "Zones On/Off", group="SR Settings")
useHLZones = input(true, "High Low Zones On/Off", group="SR Settings")
zoneWidth = input.int(2, "Zone Width %", 0, tooltip="it's calculated using % of the distance between highest/lowest in last 300 bars", group="SR Settings")
expandSR = input(true, "Expand SR", group="SR Settings")
//============================================================================
// SUPPLY/DEMAND FUNCTIONS
//============================================================================
// Function to add new and remove last in array
f_array_add_pop(array, new_value_to_add) =>
array.unshift(array, new_value_to_add)
array.pop(array)
// Function for swing H & L labels
f_sh_sl_labels(array, swing_type) =>
var string label_text = na
if swing_type == 1
if array.get(array, 0) >= array.get(array, 1)
label_text := 'HH'
else
label_text := 'LH'
label.new(bar_index - swing_length, array.get(array,0), text = label_text, style=label.style_label_down, textcolor = swing_type_color, color = color.new(swing_type_color, 100), size = size.tiny)
else if swing_type == -1
if array.get(array, 0) >= array.get(array, 1)
label_text := 'HL'
else
label_text := 'LL'
label.new(bar_index - swing_length, array.get(array,0), text = label_text, style=label.style_label_up, textcolor = swing_type_color, color = color.new(swing_type_color, 100), size = size.tiny)
// Function to check overlapping
f_check_overlapping(new_poi, box_array, atr) =>
atr_threshold = atr * 2
okay_to_draw = true
for i = 0 to array.size(box_array) - 1
top = box.get_top(array.get(box_array, i))
bottom = box.get_bottom(array.get(box_array, i))
poi = (top + bottom) / 2
upper_boundary = poi + atr_threshold
lower_boundary = poi - atr_threshold
if new_poi >= lower_boundary and new_poi <= upper_boundary
okay_to_draw := false
break
else
okay_to_draw := true
okay_to_draw
// Function to draw supply or demand zone
f_supply_demand(value_array, bn_array, box_array, label_array, box_type, atr) =>
atr_buffer = atr * (box_width / 10)
box_left = array.get(bn_array, 0)
box_right = bar_index
var float box_top = 0.00
var float box_bottom = 0.00
var float poi = 0.00
if box_type == 1
box_top := array.get(value_array, 0)
box_bottom := box_top - atr_buffer
poi := (box_top + box_bottom) / 2
else if box_type == -1
box_bottom := array.get(value_array, 0)
box_top := box_bottom + atr_buffer
poi := (box_top + box_bottom) / 2
okay_to_draw = f_check_overlapping(poi, box_array, atr)
if box_type == 1 and okay_to_draw
box.delete( array.get(box_array, array.size(box_array) - 1) )
f_array_add_pop(box_array, box.new( left = box_left, top = box_top, right = box_right, bottom = box_bottom, border_color = supply_outline_color,
bgcolor = supply_color, extend = extend.right, text = 'SUPPLY', text_halign = text.align_center, text_valign = text.align_center, text_color = poi_label_color, text_size = size.small, xloc = xloc.bar_index))
box.delete( array.get(label_array, array.size(label_array) - 1) )
f_array_add_pop(label_array, box.new( left = box_left, top = poi, right = box_right, bottom = poi, border_color = color.new(poi_label_color,90),
bgcolor = color.new(poi_label_color,90), extend = extend.right, text = 'POI', text_halign = text.align_left, text_valign = text.align_center, text_color = poi_label_color, text_size = size.small, xloc = xloc.bar_index))
else if box_type == -1 and okay_to_draw
box.delete( array.get(box_array, array.size(box_array) - 1) )
f_array_add_pop(box_array, box.new( left = box_left, top = box_top, right = box_right, bottom = box_bottom, border_color = demand_outline_color,
bgcolor = demand_color, extend = extend.right, text = 'DEMAND', text_halign = text.align_center, text_valign = text.align_center, text_color = poi_label_color, text_size = size.small, xloc = xloc.bar_index))
box.delete( array.get(label_array, array.size(label_array) - 1) )
f_array_add_pop(label_array, box.new( left = box_left, top = poi, right = box_right, bottom = poi, border_color = color.new(poi_label_color,90),
bgcolor = color.new(poi_label_color,90), extend = extend.right, text = 'POI', text_halign = text.align_left, text_valign = text.align_center, text_color = poi_label_color, text_size = size.small, xloc = xloc.bar_index))
// Function to change supply/demand to BOS if broken
f_sd_to_bos(box_array, bos_array, label_array, zone_type) =>
if zone_type == 1
for i = 0 to array.size(box_array) - 1
level_to_break = box.get_top(array.get(box_array,i))
if close >= level_to_break
copied_box = box.copy(array.get(box_array,i))
f_array_add_pop(bos_array, copied_box)
mid = (box.get_top(array.get(box_array,i)) + box.get_bottom(array.get(box_array,i))) / 2
box.set_top(array.get(bos_array,0), mid)
box.set_bottom(array.get(bos_array,0), mid)
box.set_extend( array.get(bos_array,0), extend.none)
box.set_right( array.get(bos_array,0), bar_index)
box.set_text( array.get(bos_array,0), 'BOS' )
box.set_text_color( array.get(bos_array,0), bos_label_color)
box.set_text_size( array.get(bos_array,0), size.small)
box.set_text_halign( array.get(bos_array,0), text.align_center)
box.set_text_valign( array.get(bos_array,0), text.align_center)
box.delete(array.get(box_array, i))
box.delete(array.get(label_array, i))
if zone_type == -1
for i = 0 to array.size(box_array) - 1
level_to_break = box.get_bottom(array.get(box_array,i))
if close <= level_to_break
copied_box = box.copy(array.get(box_array,i))
f_array_add_pop(bos_array, copied_box)
mid = (box.get_top(array.get(box_array,i)) + box.get_bottom(array.get(box_array,i))) / 2
box.set_top(array.get(bos_array,0), mid)
box.set_bottom(array.get(bos_array,0), mid)
box.set_extend( array.get(bos_array,0), extend.none)
box.set_right( array.get(bos_array,0), bar_index)
box.set_text( array.get(bos_array,0), 'BOS' )
box.set_text_color( array.get(bos_array,0), bos_label_color)
box.set_text_size( array.get(bos_array,0), size.small)
box.set_text_halign( array.get(bos_array,0), text.align_center)
box.set_text_valign( array.get(bos_array,0), text.align_center)
box.delete(array.get(box_array, i))
box.delete(array.get(label_array, i))
// Function to extend box endpoint
f_extend_box_endpoint(box_array) =>
for i = 0 to array.size(box_array) - 1
box.set_right(array.get(box_array, i), bar_index + 100)
//============================================================================
// SR FUNCTIONS
//============================================================================
percWidth(len, perc) => (ta.highest(len) - ta.lowest(len)) * perc / 100
//============================================================================
// SUPPLY/DEMAND CALCULATIONS
//============================================================================
atr = ta.atr(50)
swing_high = ta.pivothigh(high, swing_length, swing_length)
swing_low = ta.pivotlow(low, swing_length, swing_length)
var swing_high_values = array.new_float(5,0.00)
var swing_low_values = array.new_float(5,0.00)
var swing_high_bns = array.new_int(5,0)
var swing_low_bns = array.new_int(5,0)
var current_supply_box = array.new_box(history_of_demand_to_keep, na)
var current_demand_box = array.new_box(history_of_demand_to_keep, na)
var current_supply_poi = array.new_box(history_of_demand_to_keep, na)
var current_demand_poi = array.new_box(history_of_demand_to_keep, na)
var supply_bos = array.new_box(5, na)
var demand_bos = array.new_box(5, na)
// New swing high
if not na(swing_high)
f_array_add_pop(swing_high_values, swing_high)
f_array_add_pop(swing_high_bns, bar_index )
if show_price_action_labels
f_sh_sl_labels(swing_high_values, 1)
f_supply_demand(swing_high_values, swing_high_bns, current_supply_box, current_supply_poi, 1, atr)
// New swing low
else if not na(swing_low)
f_array_add_pop(swing_low_values, swing_low)
f_array_add_pop(swing_low_bns, bar_index )
if show_price_action_labels
f_sh_sl_labels(swing_low_values, -1)
f_supply_demand(swing_low_values, swing_low_bns, current_demand_box, current_demand_poi, -1, atr)
f_sd_to_bos(current_supply_box, supply_bos, current_supply_poi, 1)
f_sd_to_bos(current_demand_box, demand_bos, current_demand_poi, -1)
f_extend_box_endpoint(current_supply_box)
f_extend_box_endpoint(current_demand_box)
//============================================================================
// SR CALCULATIONS & PLOTTING
//============================================================================
rb = 10
prd = 284
ChannelW = 10
label_loc = 55
style = lineStyle == "Solid" ? line.style_solid : lineStyle == "Dotted" ? line.style_dotted : line.style_dashed
ph = ta.pivothigh(rb, rb)
pl = ta.pivotlow (rb, rb)
sr_levels = array.new_float(21, na)
prdhighest = ta.highest(prd)
prdlowest = ta.lowest(prd)
cwidth = percWidth(prd, ChannelW)
zonePerc = percWidth(300, zoneWidth)
aas = array.new_bool(41, true)
u1 = 0.0, u1 := nz(u1 )
d1 = 0.0, d1 := nz(d1 )
highestph = 0.0, highestph := highestph
lowestpl = 0.0, lowestpl := lowestpl
var sr_levs = array.new_float(21, na)
label hlabel = na, label.delete(hlabel )
label llabel = na, label.delete(llabel )
var sr_lines = array.new_line(21, na)
var sr_linesH = array.new_line(21, na)
var sr_linesL = array.new_line(21, na)
var sr_linesF = array.new_linefill(21, na)
var sr_labels = array.new_label(21, na)
if ph or pl
for x = 0 to array.size(sr_levels) - 1
array.set(sr_levels, x, na)
highestph := prdlowest
lowestpl := prdhighest
countpp = 0
for x = 0 to prd
if na(close )
break
if not na(ph ) or not na(pl )
highestph := math.max(highestph, nz(ph , prdlowest), nz(pl , prdlowest))
lowestpl := math.min(lowestpl, nz(ph , prdhighest), nz(pl , prdhighest))
countpp += 1
if countpp > 40
break
if array.get(aas, countpp)
upl = (ph ? high : low ) + cwidth
dnl = (ph ? high : low ) - cwidth
u1 := countpp == 1 ? upl : u1
d1 := countpp == 1 ? dnl : d1
tmp = array.new_bool(41, true)
cnt = 0
tpoint = 0
for xx = 0 to prd
if na(close )
break
if not na(ph ) or not na(pl )
chg = false
cnt += 1
if cnt > 40
break
if array.get(aas, cnt)
if not na(ph )
if high <= upl and high >= dnl
tpoint += 1
chg := true
if not na(pl )
if low <= upl and low >= dnl
tpoint += 1
chg := true
if chg and cnt < 41
array.set(tmp, cnt, false)
if tpoint >= strengthSR
for g = 0 to 40 by 1
if not array.get(tmp, g)
array.set(aas, g, false)
if ph and countpp < 21
array.set(sr_levels, countpp, high )
if pl and countpp < 21
array.set(sr_levels, countpp, low )
// Plot SR
var line highest_ = na, line.delete(highest_)
var line lowest_ = na, line.delete(lowest_)
var line highest_fill1 = na, line.delete(highest_fill1)
var line highest_fill2 = na, line.delete(highest_fill2)
var line lowest_fill1 = na, line.delete(lowest_fill1)
var line lowest_fill2 = na, line.delete(lowest_fill2)
hi_col = close >= highestph ? colorSup : colorRes
lo_col = close >= lowestpl ? colorSup : colorRes
if enableSR
highest_ := line.new(bar_index - 311, highestph, bar_index, highestph, xloc.bar_index, expandSR ? extend.both : extend.right, hi_col, style, lineWidth)
lowest_ := line.new(bar_index - 311, lowestpl , bar_index, lowestpl , xloc.bar_index, expandSR ? extend.both : extend.right, lo_col, style, lineWidth)
if useHLZones
highest_fill1 := line.new(bar_index - 311, highestph + zonePerc, bar_index, highestph + zonePerc, xloc.bar_index, expandSR ? extend.both : extend.right, na)
highest_fill2 := line.new(bar_index - 311, highestph - zonePerc, bar_index, highestph - zonePerc, xloc.bar_index, expandSR ? extend.both : extend.right, na)
lowest_fill1 := line.new(bar_index - 311, lowestpl + zonePerc , bar_index, lowestpl + zonePerc , xloc.bar_index, expandSR ? extend.both : extend.right, na)
lowest_fill2 := line.new(bar_index - 311, lowestpl - zonePerc , bar_index, lowestpl - zonePerc , xloc.bar_index, expandSR ? extend.both : extend.right, na)
linefill.new(highest_fill1, highest_fill2, color.new(hi_col, 80))
linefill.new(lowest_fill1 , lowest_fill2 , color.new(lo_col, 80))
if ph or pl
for x = 0 to array.size(sr_lines) - 1
array.set(sr_levs, x, array.get(sr_levels, x))
for x = 0 to array.size(sr_lines) - 1
line.delete(array.get(sr_lines, x))
line.delete(array.get(sr_linesH, x))
line.delete(array.get(sr_linesL, x))
linefill.delete(array.get(sr_linesF, x))
if array.get(sr_levs, x) and enableSR
line_col = close >= array.get(sr_levs, x) ? colorSup : colorRes
array.set(sr_lines, x, line.new(bar_index - 355, array.get(sr_levs, x), bar_index, array.get(sr_levs, x), xloc.bar_index, expandSR ? extend.both : extend.right, line_col, style, lineWidth))
if useZones
array.set(sr_linesH, x, line.new(bar_index - 355, array.get(sr_levs, x) + zonePerc, bar_index, array.get(sr_levs, x) + zonePerc, xloc.bar_index, expandSR ? extend.both : extend.right, na))
array.set(sr_linesL, x, line.new(bar_index - 355, array.get(sr_levs, x) - zonePerc, bar_index, array.get(sr_levs, x) - zonePerc, xloc.bar_index, expandSR ? extend.both : extend.right, na))
array.set(sr_linesF, x, linefill.new(array.get(sr_linesH, x), array.get(sr_linesL, x), color.new(line_col, 80)))
for x = 0 to array.size(sr_labels) - 1
label.delete(array.get(sr_labels, x))
if array.get(sr_levs, x) and enableSR
lab_loc = close >= array.get(sr_levs, x) ? label.style_label_up : label.style_label_down
lab_col = close >= array.get(sr_levs, x) ? colorSup : colorRes
array.set(sr_labels, x, label.new(bar_index + label_loc, array.get(sr_levs, x), str.tostring(math.round_to_mintick(array.get(sr_levs, x))), color=lab_col , textcolor=#000000, style=lab_loc))
hlabel := enableSR ? label.new(bar_index + label_loc + math.round(math.sign(label_loc)) * 20, highestph, "High Level : " + str.tostring(highestph), color=hi_col, textcolor=#000000, style=label.style_label_down) : na
llabel := enableSR ? label.new(bar_index + label_loc + math.round(math.sign(label_loc)) * 20, lowestpl , "Low Level : " + str.tostring(lowestpl) , color=lo_col, textcolor=#000000, style=label.style_label_up ) : na

VMDM - Volume, Momentum & Divergence Master [BullByte]VMDM - Volume, Momentum and Divergence Master
Educational Multi-Layer Market Structure Analysis System
Multi-factor divergence engine that scores RSI momentum, volume pressure, and institutional footprints into one non-repainting confluence rating (0-100).
WHAT THIS INDICATOR IS
VMDM is an educational indicator designed to teach traders how to recognize high-probability reversal and continuation patterns by analyzing four independent market dimensions simultaneously. Instead of relying on a single indicator that may produce frequent false signals, VMDM creates a confluence-based scoring system that weights multiple confirmation factors, helping you understand which setups have stronger technical backing and which are lower quality.
This is NOT a trading system or signal generator. It is a learning tool that visualizes complex market structure concepts in an accessible format for both coders and non-coders.
THE PROBLEM IT SOLVES
Most traders face these common challenges:
Challenge 1 - Indicator Overload: Running RSI, volume analysis, and divergence detection separately creates chart clutter and conflicting signals. You waste time cross-referencing multiple windows trying to determine if all factors align.
Challenge 2 - False Divergences: Standard divergence indicators trigger on every minor pivot, creating noise. Many divergences fail because they lack supporting evidence from volume or market structure.
Challenge 3 - Missed Context: A bullish RSI divergence means nothing if it occurs during weak volume or in the middle of strong distribution. Context determines quality.
Challenge 4 - Repainting Confusion: Many divergence scripts repaint, showing perfect historical signals that never actually triggered in real-time, leading to false confidence.
Challenge 5 - Institutional Pattern Recognition: Absorption zones, stop hunts, and exhaustion patterns are taught in trading education but difficult to identify systematically without manual analysis.
VMDM addresses all five challenges by combining complementary analytical layers into one transparent, non-repainting, confluence-weighted system with visual clarity.
WHY THIS SPECIFIC COMBINATION - MASHUP JUSTIFICATION
This indicator is NOT a random mashup of popular indicators. Each of the four layers serves a specific analytical purpose and together they create a complete market structure assessment framework.
THE FOUR ANALYTICAL LAYERS
LAYER 1 - RSI MOMENTUM DIVERGENCE (Trend Exhaustion Detection)
Purpose: Identifies when price momentum is weakening before price itself reverses.
Why RSI: The Relative Strength Index measures momentum on a bounded 0-100 scale, making divergence detection mathematically consistent across all assets and timeframes. Unlike raw price oscillators, RSI normalizes momentum regardless of volatility regime.
How It Contributes: Divergence between price pivots and RSI pivots reveals early momentum exhaustion. A lower price low with a higher RSI low (bullish regular divergence) signals sellers are losing strength even as price makes new lows. This is the PRIMARY signal generator in VMDM.
Limitation If Used Alone: RSI divergence by itself produces many false signals because momentum can remain weak during continued trends. It needs confirmation from volume and structural evidence.
LAYER 2 - VOLUME PRESSURE ANALYSIS (Buying vs Selling Intensity)
Purpose: Quantifies whether the current bar's volume reflects buying pressure or selling pressure based on where price closed within the bar's range.
Methodology: Instead of just measuring volume size, VMDM calculates WHERE in the bar range the close occurred. A close near the high on high volume indicates strong buying absorption. A close near the low indicates selling pressure. The calculation accounts for wick size (wicks reduce pressure quality) and uses percentile ranking over a lookback period to normalize pressure strength on a 0-100 scale.
Formula Concept:
Buy Pressure = Volume × (Close - Low) / (High - Low) × Wick Quality Factor
Sell Pressure = Volume × (High - Close) / (High - Low) × Wick Quality Factor
Net Pressure = Buy Pressure - Sell Pressure
Pressure Strength = Percentile Rank of Net Pressure over lookback period
Why Percentile Ranking: Absolute volume varies by asset and session. Percentile ranking makes 85th percentile pressure on low-volume crypto comparable to 85th percentile pressure on high-volume forex.
How It Contributes: When a bullish divergence occurs at a pivot low AND pressure strength is above 60 (strong buying), this adds 25 confluence points. It confirms that the divergence is occurring during actual accumulation, not just weak selling.
Limitation If Used Alone: Pressure analysis shows current bar intensity but cannot identify trend exhaustion or reversal timing. High buying pressure can exist during a strong uptrend with no reversal imminent.
LAYER 3 - BEHAVIORAL FOOTPRINT PATTERNS (Volume Anomaly Detection)
CRITICAL DISCLAIMER: The terms "institutional footprint," "absorption," "stop hunt," and "exhaustion" used in this indicator are EDUCATIONAL LABELS for specific price and volume behavioral patterns. These patterns are detected through technical analysis of publicly available price, volume, and bar structure data. This indicator does NOT have access to actual institutional order flow, market maker data, broker stop-loss locations, or any non-public data source. These pattern names are used because they are common terminology in trading education to describe these technical behaviors. The analysis is interpretive and based on observable price action, not privileged information.
Purpose: Detect volume anomalies and price patterns that historically correlate with potential reversal zones or trend continuation failure.
Pattern Type 1 - Absorption (Labeled as "ACCUMULATION" or "DISTRIBUTION")
Detection Criteria: Volume is more than 2x the moving average AND bar range is less than 50 percent of the average bar range.
Interpretation: High volume compressed into a tight range suggests large participants are absorbing supply (accumulation) or distribution (distribution) without allowing price to move significantly. This often precedes directional moves once absorption completes.
Visual: Colored box zone highlighting the absorption area.
Pattern Type 2 - Stop Hunt (Labeled as "BULL HUNT" or "BEAR HUNT")
Detection Criteria: Price penetrates a recent 10-bar high or low by a small margin (0.2 percent), then closes back inside the range on above-average volume (1.5x+).
Interpretation: Price briefly spikes beyond recent structure (likely triggering stop losses placed just beyond obvious levels) then reverses. This is a classic false breakout pattern often seen before reversals.
Visual: Label at the wick extreme showing hunt direction.
Pattern Type 3 - Exhaustion (Labeled as "SELL EXHAUST" or "BUY EXHAUST")
Detection Criteria: Lower wick is more than 2.5x the body size with volume above 1.8x average and RSI below 35 (sell exhaustion), OR upper wick more than 2.5x body size with volume above 1.8x average and RSI above 65 (buy exhaustion).
Interpretation: Large wicks with high volume and extreme RSI suggest aggressive buying or selling was met with equally aggressive rejection. This exhaustion often marks short-term extremes.
Visual: Label showing exhaustion type.
How These Contribute: When a divergence forms at a pivot AND one of these behavioral patterns is active, the confluence score increases by 20 points. This confirms the divergence is occurring during structural anomaly activity, not just normal price flow.
Limitation If Used Alone: These patterns can occur mid-trend and do not indicate direction without momentum context. Absorption in a strong uptrend may just be continuation accumulation.
LAYER 4 - CONFLUENCE SCORING MATRIX (Quality Weighting System)
Purpose: Translate all detected conditions into a single 0-100 quality score so you can objectively compare setups.
Scoring Breakdown:
Divergence Present: +30 points (primary signal)
Pressure Confirmation: +25 points (volume supports direction)
Behavioral Footprint Active: +20 points (structural anomaly present)
RSI Extreme: +15 points (RSI below 30 or above 70 at pivot)
Volume Spike: +10 points (current volume above 1.5x average)
Maximum Possible Score: 100 points
Why These Weights: The weights reflect reliability hierarchy based on backtesting observation. Divergence is the core signal (30 points), but without volume confirmation (25 points) many fail. Behavioral patterns add meaningful context (20 points). RSI extremes and volume spikes are secondary confirmations (15 and 10 points).
Quality Tiers:
90-100: TEXTBOOK (all factors aligned)
75-89: HIGH QUALITY (strong confluence)
60-74: VALID (meets minimum threshold)
Below 60: DEVELOPING (not displayed unless threshold lowered)
How It Contributes: The confluence score allows you to filter noise. You can set your minimum quality threshold in settings. Higher thresholds (75+) show fewer but higher-quality patterns. Lower thresholds (50-60) show more patterns but include lower-confidence setups. This teaches you to distinguish strong setups from weak ones.
Limitation: Confluence scoring is historical observation-based, not predictive guarantee. A 95-point setup can still fail. The score represents technical alignment, not future certainty.
WHY THIS COMBINATION WORKS TOGETHER
Each layer addresses a limitation in the others:
RSI Divergence identifies WHEN momentum is exhausting (timing)
Volume Pressure confirms WHETHER the exhaustion is accompanied by opposite-side accumulation (confirmation)
Behavioral Footprint shows IF structural anomalies support the reversal hypothesis (context)
Confluence Scoring weights ALL factors into an objective quality metric (filtering)
Using only RSI divergence gives you timing without confirmation. Using only volume pressure gives you intensity without directional context. Using only pattern detection gives you anomalies without trend exhaustion context. Using all four together creates a complete analytical framework where each layer compensates for the others' weaknesses.
This is not a mashup for the sake of combining indicators. It is a structured analytical system where each component has a defined role in a multi-dimensional market assessment process.
HOW TO READ THE INDICATOR - VISUAL ELEMENTS GUIDE
VMDM displays up to five visual layer types. You can enable or disable each layer independently in settings under "Visual Layers."
VISUAL LAYER 1 - MARKET STRUCTURE (Pivot Points and Lines)
What You See:
Small labels at swing highs and lows marked "PH" (Pivot High) and "PL" (Pivot Low) with horizontal dashed lines extending right from each pivot.
What It Means:
These are CONFIRMED pivots, not real-time. A pivot low appears AFTER the required right-side confirmation bars pass (default 3 bars). This creates a delay but prevents repainting. The pivot only appears once it is mathematically confirmed.
The horizontal lines represent support (from pivot lows) and resistance (from pivot highs) levels where price previously found significant rejection.
Color Coding:
Green label and line: Pivot Low (potential support)
Red label and line: Pivot High (potential resistance)
How To Use:
These pivots are the foundation for divergence detection. Divergence is only calculated between confirmed pivots, ensuring all signals are non-repainting. The lines help you see historical structure levels.
VISUAL LAYER 2 - PRESSURE ZONES (Background Color)
What You See:
Subtle background color shading on bars - light green or light red tint.
What It Means:
This visualizes volume pressure strength in real-time.
Color Coding:
Light Green Background: Pressure Strength above 70 (strong buying pressure - price closing near highs on volume)
Light Red Background: Pressure Strength below 30 (strong selling pressure - price closing near lows on volume)
No Color: Neutral pressure (pressure between 30-70)
How To Use:
When a bullish divergence pattern appears during green pressure zones, it suggests the divergence is forming during accumulation. When a bearish divergence appears during red zones, distribution is occurring. Pressure zones help you filter divergences - those forming in supportive pressure environments have higher probability.
VISUAL LAYER 3 - DIVERGENCE LINES (Dotted Connectors)
What You See:
Dotted lines connecting two pivot points (either two pivot lows or two pivot highs).
What It Means:
A divergence has been detected between those two pivots. The line connects the price pivots where RSI showed opposite behavior.
Color Coding:
Bright Green Line: Bullish divergence (regular or hidden)
Bright Red Line: Bearish divergence (regular or hidden)
How To Use:
The divergence line appears ONLY after the second pivot is confirmed (delayed by right-side confirmation bars). This is intentional to prevent repainting. When you see the line appear, it means:
For Bullish Regular Divergence:
Price made a lower low (second pivot lower than first)
RSI made a higher low (RSI at second pivot higher than first)
Interpretation: Downtrend losing momentum
For Bullish Hidden Divergence:
Price made a higher low (second pivot higher than first)
RSI made a lower low (RSI at second pivot lower than first)
Interpretation: Uptrend continuation likely (pullback within uptrend)
For Bearish Regular Divergence:
Price made a higher high (second pivot higher than first)
RSI made a lower high (RSI at second pivot lower than first)
Interpretation: Uptrend losing momentum
For Bearish Hidden Divergence:
Price made a lower high (second pivot lower than first)
RSI made a higher high (RSI at second pivot higher than first)
Interpretation: Downtrend continuation likely (bounce within downtrend)
If "Show Consolidated Analysis Label" is disabled, a small label will appear on the divergence line showing the divergence type abbreviation.
VISUAL LAYER 4 - BEHAVIORAL FOOTPRINT MARKERS
What You See:
Boxes, labels, and markers at specific bars showing pattern detection.
ABSORPTION ZONES (Boxes):
Colored rectangular boxes spanning one or more bars.
Purple Box: Accumulation absorption zone (high volume, tight range, bullish close)
Red Box: Distribution absorption zone (high volume, tight range, bearish close)
If absorption continues for multiple consecutive bars, the box extends and a counter appears in the label showing how many bars the absorption lasted.
What It Means: Large volume is being absorbed without significant price movement. This often precedes directional breakouts once the absorption phase completes.
STOP HUNT MARKERS (Labels):
Small labels below or above wicks labeled "BULL HUNT" or "BEAR HUNT" (may show bar count if consecutive).
What It Means:
BULL HUNT : Price spiked below recent lows then reversed back up on volume - likely triggered sell stops before reversing
BEAR HUNT : Price spiked above recent highs then reversed back down on volume - likely triggered buy stops before reversing
EXHAUSTION MARKERS (Labels):
Labels showing "SELL EXHAUST" or "BUY EXHAUST."
What It Means:
SELL EXHAUST : Large lower wick with high volume and low RSI - aggressive selling met with strong rejection
BUY EXHAUST : Large upper wick with high volume and high RSI - aggressive buying met with strong rejection
How To Use:
These markers help you identify WHERE structural anomalies occurred. When a divergence signal appears AT THE SAME TIME as one of these patterns, the confluence score increases. You are looking for alignment - divergence + behavioral pattern + pressure confirmation = high-quality setup.
VISUAL LAYER 5 - CONSOLIDATED ANALYSIS LABEL (Main Pattern Signal)
What You See:
A large label appearing at pivot points (or in real-time mode, at current bar) containing full pattern analysis.
Label Appearance:
Depending on your "Use Compact Label Format" setting:
COMPACT MODE (Single Line):
Example: "BULLISH REGULAR | Q:HIGH QUALITY C:82"
Breakdown:
BULLISH REGULAR: Divergence type detected
Q:HIGH QUALITY: Pattern quality tier
C:82: Confluence score (82 out of 100)
FULL MODE (Multi-Line Detailed):
Example:
PATTERN DETECTED
-------------------
BULLISH REGULAR
Quality: HIGH QUALITY
Price: Lower Low
Momentum: Higher Low
Signal: Weakening Downtrend
CONFLUENCE: 82/100
-------------------
Divergence: 30
Pressure: 25
Institutional: 20
RSI Extreme: 0
Volume: 10
Breakdown:
Top section: Pattern type and quality
Middle section: Divergence explanation (what price did vs what RSI did)
Bottom section: Confluence score with itemized breakdown showing which factors contributed
Label Position:
In Confirmed modes: Label appears AT the pivot point (delayed by confirmation bars)
In Real-time mode: Label appears at current bar as conditions develop
Label Color:
Gold: Textbook quality (90+ confluence)
Green: High quality (75-89 confluence)
Blue: Valid quality (60-74 confluence)
How To Use:
This is your primary decision-making label. When it appears:
Check the divergence type (regular divergences are reversal signals, hidden divergences are continuation signals)
Review the quality tier (textbook and high quality have better historical win rates)
Examine the confluence breakdown to see which factors are present and which are missing
Look at the chart context (trend, support/resistance, timeframe)
Use this information to assess whether the setup aligns with your strategy
The label does NOT tell you to buy or sell. It tells you a technical pattern has formed and provides the quality assessment. Your trading decision must incorporate risk management, market context, and your strategy rules.
UNDERSTANDING THE THREE DETECTION MODES
VMDM offers three signal detection modes in settings to accommodate different trading styles and learning objectives.
MODE 1: "Confluence Only (Real-Time)"
How It Works: Displays signals AS THEY DEVELOP on the current bar without waiting for pivot confirmation. The system calculates confluence score from pressure, volume, RSI extremes, and behavioral patterns. Divergence signals are NOT required in this mode.
Delay: ZERO - signals appear immediately.
Use Case: Real-time scanning for high-confluence zones without divergence requirement. Useful for intraday traders who want immediate alerts when multiple factors align.
Tradeoff: More frequent signals but includes setups without confirmed divergence. Higher false signal rate. Signals can change as the bar develops (not repainting in historical bars, but current bar updates).
Visual Behavior: Labels appear at the current bar. No divergence lines unless divergence happens to be present.
MODE 2: "Divergence + Confluence (Confirmed)" - DEFAULT RECOMMENDED
How It Works: Full system engagement. Signals appear ONLY when:
A pivot is confirmed (requires right-side confirmation bars to pass)
Divergence is detected between current pivot and previous pivot
Total confluence score meets or exceeds your minimum threshold
Delay: Equal to your "Pivot Right Bars" setting (default 3 bars). This means signals appear 3 bars AFTER the actual pivot formed.
Use Case: Highest-quality, non-repainting signals for swing traders and learners who want to study confirmed pattern completion.
Tradeoff: Delayed signals. You will not receive the signal until confirmation occurs. In fast-moving markets, price may have already moved significantly by the time the signal appears.
Visual Behavior: Labels appear at the historical pivot location (in the past). Divergence lines connect the two pivots. This is the most educational mode because it shows completed, confirmed patterns.
Non-Repainting Guarantee: Yes. Once a signal appears, it never disappears or changes.
MODE 3: "Divergence + Confluence (Relaxed)"
How It Works: Same as Confirmed mode but with adaptive thresholds. If confluence is very high (10 points above threshold), the signal may appear even if some factors are weak. If divergence is present but confluence is slightly below threshold (within 10 points), it may still appear.
Delay: Same as Confirmed mode (right-side confirmation bars).
Use Case: Slightly more signals than Confirmed mode for traders willing to accept near-threshold setups.
Tradeoff: More signals but lower average quality than Confirmed mode.
Visual Behavior: Same as Confirmed mode.
DASHBOARD GUIDE - READING THE METRICS
The dashboard appears in the corner of your chart (position selectable in settings) and provides real-time market state analysis.
You can choose between four dashboard detail levels in settings: Off, Compact, Optimized (default), Full.
DASHBOARD ROW EXPLANATIONS
ROW 1 - Header Information
Left: Current symbol and timeframe
Center: "VMDM "
Right: Version number
ROW 2 - Mode and Delay
Shows which detection mode you are using and the signal delay.
Example: "CONFIRMED | Delay: 3 bars"
This reminds you that signals in confirmed mode appear 3 bars after the pivot forms.
ROW 3 - Market Regime
Format: "TREND UP HV" or "RANGING NV"
First Part - Trend State:
TREND UP: 20 EMA above 50 EMA with strong separation
TREND DOWN: 20 EMA below 50 EMA with strong separation
RANGING: EMAs close together, low trend strength
TRANSITION: Between trending and ranging states
Second Part - Volatility State:
HV: High Volatility (current ATR more than 1.3x the 50-bar average ATR)
NV: Normal Volatility (current ATR between 0.7x and 1.3x average)
LV: Low Volatility (current ATR less than 0.7x average)
Third Column: Volatility ratio (example: "1.45x" means current ATR is 1.45 times normal)
How To Use: Regime context helps you interpret signals. Reversal divergences are more reliable in ranging or transitional regimes. Continuation divergences (hidden) are more reliable in trending regimes. High volatility means wider stops may be needed.
ROW 4 - Pressure
Shows current volume pressure state.
Format: "BUYING | ██████████░░░░░░░░░"
States:
BUYING : Pressure strength above 60 (closes near highs)
SELLING : Pressure strength below 40 (closes near lows)
NEUTRAL : Pressure strength between 40-60
Bar Visualization: Each block represents 10 percentile points. A full bar (10 filled blocks) = 100th percentile pressure.
Color: Green for buying, red for selling, gray for neutral.
How To Use: When pressure aligns with divergence direction (bullish divergence during buying pressure), confluence is stronger.
ROW 5 - Volume and RSI
Format: "1.8x | RSI 68 | OB"
First Value: Current volume ratio (1.8x = volume is 1.8 times the moving average)
Second Value: Current RSI reading
Third Value: RSI state
OB: Overbought (RSI above 70)
OS: Oversold (RSI below 30)
Blank: Neutral RSI
How To Use: Volume spikes (above 1.5x) during divergence formation add confluence. RSI extremes at pivots add confluence.
ROW 6 - Behavioral Footprint
Format: "BULL HUNT | 2 bars"
Shows the most recent behavioral pattern detected and how long ago.
States:
ACCUMULATION / DISTRIBUTION: Absorption detected
BULL HUNT / BEAR HUNT: Stop hunt detected
SELL EXHAUST / BUY EXHAUST: Exhaustion detected
SCANNING: No recent pattern
NOW: Pattern is active on current bar
How To Use: When footprint activity is recent (within 50 bars) or active now, it adds context to divergence signals forming in that area.
ROW 7 - Current Pattern
Shows the divergence type currently detected (if any).
Examples: "BULLISH REGULAR", "BEARISH HIDDEN", "Scanning..."
Quality: Shows pattern quality (TEXTBOOK, HIGH QUALITY, VALID)
How To Use: This tells you what type of signal is active. Regular divergences are reversal setups. Hidden divergences are continuation setups.
ROW 8 - Session Summary
Format: "14 events | A3 H8 E3"
First Value: Total institutional events this session
Breakdown:
A: Absorption events
H: Stop hunt events
E: Exhaustion events
How To Use: High event counts suggest an active, volatile session with frequent structural anomalies. Low counts suggest quiet, orderly price action.
ROW 9 - Confluence Score (Optimized/Full mode only)
Format: "78/100 | ████████░░"
Shows current real-time confluence score even if no pattern is confirmed yet.
How To Use: Watch this in real-time to see how close you are to pattern formation. When it exceeds your threshold and divergence forms, a signal will appear (after confirmation delay).
ROW 10 - Patterns Studied (Optimized/Full mode only)
Format: "47 patterns | 12 bars ago"
First Value: Total confirmed patterns detected since chart loaded
Second Value: How many bars since the last confirmed pattern appeared
How To Use: Helps you understand pattern frequency on your selected symbol and timeframe. If many bars have passed since last pattern, market may be trending without reversal opportunities.
ROW 11 - Bull/Bear Ratio (Optimized/Full mode only)
Format: "28:19 | BULL"
Shows count of bullish vs bearish patterns detected.
Balance:
BULL: More bullish patterns detected (suggests market has had more bullish reversals/continuations)
BEAR: More bearish patterns detected
BAL: Equal counts
How To Use: Extreme imbalances can indicate directional bias in the studied period. A heavily bullish ratio in a downtrend might suggest frequent failed rallies (bearish continuation). Context matters.
ROW 12 - Volume Ratio Detail (Optimized/Full mode only)
Shows current volume vs average volume in absolute terms.
Example: "1.4x | 45230 / 32300"
How To Use: Confirms whether current activity is above or below normal.
ROW 13 - Last Institutional Event (Full mode only)
Shows the most recent institutional pattern type and how many bars ago it occurred.
Example: "DISTRIBUTION | 23 bars"
How To Use: Tracks recency of last anomaly for context.
SETTINGS GUIDE - EVERY PARAMETER EXPLAINED
PERFORMANCE SECTION
Enable All Visuals (Master Toggle)
Default: ON
What It Does: Master kill switch for ALL visual elements (labels, lines, boxes, background colors, dashboard). When OFF, only plot outputs remain (invisible unless you open data window).
When To Change: Turn OFF on mobile devices, 1-second charts, or slow computers to improve performance. You can still receive alerts even with visuals disabled.
Impact: Dramatic performance improvement when OFF, but you lose all visual feedback.
Maximum Object History
Default: 50 | Range: 10-100
What It Does: Limits how many of each object type (labels, lines, boxes) are kept in memory. Older objects beyond this limit are deleted.
When To Change: Lower to 20-30 on fast timeframes (1-minute charts) to prevent slowdown. Increase to 100 on daily charts if you want more historical pattern visibility.
Impact: Lower values = better performance but less historical visibility. Higher values = more history visible but potential slowdown on fast timeframes.
Alert Cooldown (Bars)
Default: 5 | Range: 1-50
What It Does: Minimum number of bars that must pass before another alert of the same type can fire. Prevents alert spam when multiple patterns form in quick succession.
When To Change: Increase to 20+ on 1-minute charts to reduce noise. Decrease to 1-2 on daily charts if you want every pattern alerted.
Impact: Higher cooldown = fewer alerts. Lower cooldown = more alerts.
USER EXPERIENCE SECTION
Show Enhanced Tooltips
Default: ON
What It Does: Enables detailed hover-over tooltips on labels and visual elements.
When To Change: Turn OFF if you encounter Pine Script compilation errors related to tooltip arguments (rare, platform-specific issue).
Impact: Minimal. Just adds helpful hover text.
MARKET STRUCTURE DETECTION SECTION
Pivot Left Bars
Default: 3 | Range: 2-10
What It Does: Number of bars to the LEFT of the center bar that must be higher (for pivot low) or lower (for pivot high) than the center bar for a pivot to be valid.
Example: With value 3, a pivot low requires the center bar's low to be lower than the 3 bars to its left.
When To Change:
Increase to 5-7 on noisy timeframes (1-minute charts) to filter insignificant pivots
Decrease to 2 on slow timeframes (daily charts) to catch more pivots
Impact: Higher values = fewer, more significant pivots = fewer signals. Lower values = more frequent pivots = more signals but more noise.
Pivot Right Bars
Default: 3 | Range: 2-10
What It Does: Number of bars to the RIGHT of the center bar that must pass for confirmation. This creates the non-repainting delay.
Example: With value 3, a pivot is confirmed 3 bars AFTER it forms.
When To Change:
Increase to 5-7 for slower, more confirmed signals (better for swing trading)
Decrease to 2 for faster signals (better for intraday, but still non-repainting)
Impact: Higher values = longer delay but more reliable confirmation. Lower values = faster signals but less confirmation. This setting directly controls your signal delay in Confirmed and Relaxed modes.
Minimum Confluence Score
Default: 60 | Range: 40-95
What It Does: The threshold score required for a pattern to be displayed. Patterns with confluence scores below this threshold are not shown.
When To Change:
Increase to 75+ if you only want high-quality textbook setups (fewer signals)
Decrease to 50-55 if you want to see more developing patterns (more signals, lower average quality)
Impact: This is your primary signal filter. Higher threshold = fewer, higher-quality signals. Lower threshold = more signals but includes weaker setups. Recommended starting point is 60-65.
TECHNICAL PERIODS SECTION
RSI Period
Default: 14 | Range: 5-50
What It Does: Lookback period for RSI calculation.
When To Change:
Decrease to 9-10 for faster, more sensitive RSI that detects shorter-term momentum changes
Increase to 21-28 for slower, smoother RSI that filters noise
Impact: Lower values make RSI more volatile (more frequent extremes and divergences). Higher values make RSI smoother (fewer but more significant divergences). 14 is industry standard.
Volume Moving Average Period
Default: 20 | Range: 10-200
What It Does: Lookback period for calculating average volume. Current volume is compared to this average to determine volume ratio.
When To Change:
Decrease to 10-14 for shorter-term volume comparison (more sensitive to recent volume changes)
Increase to 50-100 for longer-term volume comparison (smoother, less sensitive)
Impact: Lower values make volume ratio more volatile. Higher values make it more stable. 20 is standard.
ATR Period
Default: 14 | Range: 5-100
What It Does: Lookback period for Average True Range calculation used for volatility measurement and label positioning.
When To Change: Rarely needs adjustment. Use 7-10 for faster volatility response, 21-28 for slower.
Impact: Affects volatility ratio calculation and visual label spacing. Minimal impact on signals.
Pressure Percentile Lookback
Default: 50 | Range: 10-300
What It Does: Lookback period for calculating volume pressure percentile ranking. Your current pressure is ranked against the pressure of the last X bars.
When To Change:
Decrease to 20-30 for shorter-term pressure context (more responsive to recent changes)
Increase to 100-200 for longer-term pressure context (smoother rankings)
Impact: Lower values make pressure strength more sensitive to recent bars. Higher values provide more stable, long-term pressure assessment. Capped at 300 for performance reasons.
SIGNAL DETECTION SECTION
Signal Detection Mode
Default: "Divergence + Confluence (Confirmed)"
Options:
Confluence Only (Real-time)
Divergence + Confluence (Confirmed)
Divergence + Confluence (Relaxed)
What It Does: Selects which detection logic mode to use (see "Understanding The Three Detection Modes" section above).
When To Change: Use Confirmed for learning and non-repainting signals. Use Real-time for live scanning without divergence requirement. Use Relaxed for slightly more signals than Confirmed.
Impact: Fundamentally changes when and how signals appear.
VISUAL LAYERS SECTION
All toggles default to ON. Each controls visibility of one visual layer:
Show Market Structure: Pivot markers and support/resistance lines
Show Pressure Zones: Background color shading
Show Divergence Lines: Dotted lines connecting pivots
Show Institutional Footprint Markers: Absorption boxes, hunt labels, exhaustion labels
Show Consolidated Analysis Label: Main pattern detection label
Use Compact Label Format
Default: OFF
What It Does: Switches consolidated label between single-line compact format and multi-line detailed format.
When To Change: Turn ON if you find full labels too large or distracting.
Impact: Visual clarity vs. information density tradeoff.
DASHBOARD SECTION
Dashboard Mode
Default: "Optimized"
Options: Off, Compact, Optimized, Full
What It Does: Controls how much information the dashboard displays.
Off: No dashboard
Compact: 8 rows (essential metrics only)
Optimized: 12 rows (recommended balance)
Full: 13 rows (every available metric)
Dashboard Position
Default: "Top Right"
Options: Top Right, Top Left, Bottom Right, Bottom Left
What It Does: Screen corner where dashboard appears.
HOW TO USE VMDM - PRACTICAL WORKFLOW
STEP 1 - INITIAL SETUP
Add VMDM to your chart
Select your detection mode (Confirmed recommended for learning)
Set your minimum confluence score (start with 60-65)
Adjust pivot parameters if needed (default 3/3 is good for most timeframes)
Enable the visual layers you want to see
STEP 2 - CHART ANALYSIS
Let the indicator load and analyze historical data
Review the patterns that appear historically
Examine the confluence scores - notice which patterns had higher scores
Observe which patterns occurred during supportive pressure zones
Notice the divergence line connections - understand what price vs RSI did
STEP 3 - PATTERN RECOGNITION LEARNING
When a consolidated analysis label appears:
Read the divergence type (regular or hidden, bullish or bearish)
Check the quality tier (textbook, high quality, or valid)
Review the confluence breakdown - which factors contributed
Look at the chart context - where is price relative to structure, trend, etc.
Observe the behavioral footprint markers nearby - do they support the pattern
STEP 4 - REAL-TIME MONITORING
Watch the dashboard for real-time regime and pressure state
Monitor the current confluence score in the dashboard
When it approaches your threshold, be alert for potential pattern formation
When a new pattern appears (after confirmation delay), evaluate it using the workflow above
Use your trading strategy rules to decide if the setup aligns with your criteria
STEP 5 - POST-PATTERN OBSERVATION
After a pattern appears:
Mark the level on your chart
Observe what price does after the pattern completes
Did price respect the reversal/continuation signal
What was the confluence score of patterns that worked vs. those that failed
Learn which quality tiers and confluence levels produce better results on your specific symbol and timeframe
RECOMMENDED TIMEFRAMES AND ASSET CLASSES
VMDM is timeframe-agnostic and works on any asset with volume data. However, optimal performance varies:
BEST TIMEFRAMES
15-Minute to 1-Hour: Ideal balance of signal frequency and reliability. Pivot confirmation delay is acceptable. Sufficient volume data for pressure analysis.
4-Hour to Daily: Excellent for swing trading. Very high-quality signals. Lower frequency but higher significance. Recommended for learning because patterns are clearer.
1-Minute to 5-Minute: Works but requires adjustment. Increase pivot bars to 5-7 for filtering. Decrease max object history to 30 for performance. Expect more noise.
Weekly/Monthly: Works but very infrequent signals. Increase confluence threshold to 70+ to ensure only major patterns appear.
BEST ASSET CLASSES
Forex Majors: Excellent volume data and clear trends. Pressure analysis works well.
Crypto (Major Pairs): Good volume data. High volatility makes divergences more pronounced. Works very well.
Stock Indices (SPY, QQQ, etc.): Excellent. Clean price action and reliable volume.
Individual Stocks: Works well on high-volume stocks. Low-volume stocks may produce unreliable pressure readings.
Commodities (Gold, Oil, etc.): Works well. Clear trends and reactions.
WHAT THIS INDICATOR CANNOT DO - LIMITATIONS
LIMITATION 1 - It Does Not Predict The Future
VMDM identifies when technical conditions align historically associated with potential reversals or continuations. It does not predict what will happen next. A textbook 95-confluence pattern can still fail if fundamental events, news, or larger timeframe structure override the setup.
LIMITATION 2 - Confirmation Delay Means You Miss Early Entry
In Confirmed and Relaxed modes, the non-repainting design means you receive signals AFTER the pivot is confirmed. Price may have already moved significantly by the time you receive the signal. This is the tradeoff for non-repainting reliability. You can use Real-time mode for faster signals but sacrifice divergence confirmation.
LIMITATION 3 - It Does Not Tell You Position Sizing or Risk Management
VMDM provides technical pattern analysis. It does not calculate stop loss levels, take profit targets, or position sizing. You must apply your own risk management rules. Never risk more than you can afford to lose based on a technical signal.
LIMITATION 4 - Volume Pressure Analysis Requires Reliable Volume Data
On assets with thin volume or unreliable volume reporting, pressure analysis may be inaccurate. Stick to major liquid assets with consistent volume data.
LIMITATION 5 - It Cannot Detect Fundamental Events
VMDM is purely technical. It cannot predict earnings reports, central bank decisions, geopolitical events, or other fundamental catalysts that can override technical patterns.
LIMITATION 6 - Divergence Requires Two Pivots
The indicator cannot detect divergence until at least two pivots of the same type have formed. In strong trends without pullbacks, you may go long periods without signals.
LIMITATION 7 - Institutional Pattern Names Are Interpretive
The behavioral footprint patterns are named using common trading education terminology, but they are detected through technical analysis, not actual institutional data access. The patterns are interpretations based on price and volume behavior.
CONCEPT FOUNDATION - WHY THIS APPROACH WORKS
MARKET PRINCIPLE 1 - Momentum Divergence Precedes Price Reversal
Price is the final output of market forces, but momentum (the rate of change in those forces) shifts first. When price makes a new low but the momentum behind that move is weaker (higher RSI low), it signals that sellers are losing strength even though they temporarily pushed price lower. This precedes reversal. This is a fundamental principle in technical analysis taught by Charles Dow, widely observed in market behavior.
MARKET PRINCIPLE 2 - Volume Reveals Conviction
Price can move on low volume (low conviction) or high volume (high conviction). When price makes a new low on declining volume while RSI shows improving momentum, it suggests the new low is not confirmed by participant conviction. Adding volume pressure analysis to momentum divergence adds a confirmation layer that filters false divergences.
MARKET PRINCIPLE 3 - Anomalies Mark Structural Extremes
When volume spikes significantly but range contracts (absorption), or when price spikes beyond structure then reverses (stop hunt), or when aggressive moves are met with large-wick rejection (exhaustion), these anomalies often mark short-term extremes. Combining these structural observations with momentum analysis creates context.
MARKET PRINCIPLE 4 - Confluence Improves Probability
No single technical factor is reliable in isolation. RSI divergence alone fails frequently. Volume analysis alone cannot time entries. Combining multiple independent factors into a weighted system increases the probability that observed patterns have structural significance rather than random noise.
THE EDUCATIONAL VALUE
By visualizing all four layers simultaneously and breaking down the confluence scoring transparently, VMDM teaches you to think in terms of multi-dimensional analysis rather than single-indicator reliance. Over time, you will learn to recognize these patterns manually and understand which combinations produce better results on your traded assets.
INSTITUTIONAL TERMINOLOGY - IMPORTANT CLARIFICATION
This indicator uses the following terms that are common in trading education:
Institutional Footprint
Absorption (Accumulation / Distribution)
Stop Hunt
Exhaustion
CRITICAL DISCLAIMER:
These terms are EDUCATIONAL LABELS for specific price action and volume behavior patterns detected through technical analysis of publicly available chart data (open, high, low, close, volume). This indicator does NOT have access to:
Actual institutional order flow or order book data
Market maker positions or intentions
Broker stop-loss databases
Non-public trading data
Proprietary institutional information
The patterns labeled as "institutional footprint" are interpretations based on observable price and volume behavior that educational trading literature often associates with potential large-participant activity. The detection is algorithmic pattern recognition, not privileged data access.
When this indicator identifies "absorption," it means it detected high volume within a small range - a condition that MAY indicate large orders being filled but is not confirmation of actual institutional participation.
When it identifies a "stop hunt," it means price briefly penetrated a structural level then reversed - a pattern that MAY have triggered stop losses but is not confirmation that stops were specifically targeted.
When it identifies "exhaustion," it means high volume with large rejection wicks - a pattern that MAY indicate aggressive participation meeting strong opposition but is not confirmation of institutional involvement.
These are technical analysis interpretations, not factual statements about market participant identity or intent.
DISCLAIMER AND RISK WARNING
EDUCATIONAL PURPOSE ONLY
This indicator is designed as an educational tool to help traders learn to recognize technical patterns, understand multi-factor analysis, and practice systematic market observation. It is NOT a trading system, signal service, or financial advice.
NO PERFORMANCE GUARANTEE
Past pattern behavior does not guarantee future results. A pattern that historically preceded price movement in one direction may fail in the future due to changing market conditions, fundamental events, or random variance. Confluence scores reflect historical technical alignment, not future certainty.
TRADING INVOLVES SUBSTANTIAL RISK
Trading financial instruments involves substantial risk of loss. You can lose more than your initial investment. Never trade with money you cannot afford to lose. Always use proper risk management including stop losses, position sizing, and portfolio diversification.
NO PREDICTIVE CLAIMS
This indicator does NOT predict future price movement. It identifies when technical conditions align in patterns that historically have been associated with potential reversals or continuations. Market behavior is probabilistic, not deterministic.
BACKTESTING LIMITATIONS
If you backtest trading strategies using this indicator, ensure you account for:
Realistic commission costs
Realistic slippage (difference between signal price and actual fill price)
Sufficient sample size (minimum 100 trades for statistical relevance)
Reasonable position sizing (risking no more than 1-2 percent of account per trade)
The confirmation delay inherent in the indicator (you cannot enter at the exact pivot in Confirmed mode)
Backtests that do not account for these factors will produce unrealistic results.
AUTHOR LIABILITY
The author (BullByte) is not responsible for any trading losses incurred using this indicator. By using this indicator, you acknowledge that all trading decisions are your sole responsibility and that you understand the risks involved.
NOT FINANCIAL ADVICE
Nothing in this indicator, its code, its description, or its visual outputs constitutes financial, investment, or trading advice. Consult a licensed financial advisor before making investment decisions.
FREQUENTLY ASKED QUESTIONS
Q: Why do signals appear in the past, not at the current bar
A: In Confirmed and Relaxed modes, signals appear at confirmed pivots, which requires waiting for right-side confirmation bars (default 3). This creates a delay but prevents repainting. Use Real-time mode if you want current-bar signals without pivot confirmation.
Q: Can I use this for automated trading
A: You can create alert-based automation, but understand that Confirmed mode signals appear AFTER the pivot with delay, so your entry will not be at the pivot price. Real-time mode signals can change as the current bar develops. Automation requires careful consideration of these factors.
Q: How do I know which confluence score to use
A: Start with 60. Observe which patterns work on your symbol/timeframe. If too many false signals, increase to 70-75. If too few signals, decrease to 55. Quality vs. quantity tradeoff.
Q: Do regular divergences mean I should enter a reversal trade immediately
A: No. Regular divergences indicate momentum exhaustion, which is a WARNING sign that trend may reverse, not a confirmation that it will. Use confluence score, market context, support/resistance, and your strategy rules to make entry decisions. Many divergences fail.
Q: What's the difference between regular and hidden divergence
A: Regular divergence = price and momentum move in opposite directions at extremes = potential reversal signal. Hidden divergence = price and momentum move in opposite directions during pullbacks = potential continuation signal. Hidden divergence suggests the pullback is just a correction within the larger trend.
Q: Why does the pressure zone color sometimes conflict with the divergence direction
A: Pressure is real-time current bar analysis. Divergence is confirmed pivot analysis from the past. They measure different things at different times. A bullish divergence confirmed 3 bars ago might appear during current selling pressure. This is normal.
Q: Can I use this on stocks without volume data
A: No. Volume is required for pressure analysis and behavioral pattern detection. Use only on assets with reliable volume reporting.
Q: How often should I expect signals
A: Depends on timeframe and settings. Daily charts might produce 5-10 signals per month. 1-hour charts might produce 20-30. 15-minute charts might produce 50-100. Adjust confluence threshold to control frequency.
Q: Can I modify the code
A: Yes, this is open source. You can modify for personal use. If you publish a modified version, please credit the original and ensure your publication meets TradingView guidelines.
Q: What if I disagree with a pattern's confluence score
A: The scoring weights are based on general observations and may not suit your specific strategy or asset. You can modify the code to adjust weights if you have data-driven reasons to do so.
Final Notes
VMDM - Volume, Momentum and Divergence Master is an educational multi-layer market analysis system designed to teach systematic pattern recognition through transparent, confluence-weighted signal detection. By combining RSI momentum divergence, volume pressure quantification, behavioral footprint pattern recognition, and quality scoring into a unified framework, it provides a comprehensive learning environment for understanding market structure.
Use this tool to develop your analytical skills, understand how multiple technical factors interact, and learn to distinguish high-quality setups from noise. Remember that technical analysis is probabilistic, not predictive. No indicator replaces proper education, risk management, and trading discipline.
Trade responsibly. Learn continuously. Risk only what you can afford to lose.
-BullByte

Volume Pressure OscillatorThe Volume Pressure Oscillator (VPO) is a momentum-based indicator that measures the directional pressure of cumulative volume delta (CVD) combined with price efficiency. It oscillates between 0 and 100, with readings above 50 indicating net buying pressure and readings below 50 indicating net selling pressure.
The indicator is designed to identify the strength and sustainability of volume-driven trends while remaining responsive during consolidation periods.
How the Indicator Works
The VPO analyzes volume flow by examining price action at lower timeframes to build a Cumulative Volume Delta (CVD). For each chart bar, the indicator looks at intrabar price movements to classify volume as either buying volume or selling volume. These classifications are accumulated into a running total that tracks net directional volume.
The indicator then measures the momentum of this CVD over both short-term and longer-term periods, providing responsiveness to recent changes while maintaining awareness of the broader trend. These momentum readings are normalized using percentile ranking, which creates a stable 0-100 scale that works consistently across different instruments and market conditions.
A key feature is the extreme zone persistence mechanism. When the indicator enters extreme zones (above 80 or below 20), it maintains elevated readings as long as volume pressure continues in the same direction. This allows the VPO to stay in extreme zones during strong trends rather than quickly reverting to neutral, making it useful for identifying sustained volume pressure rather than just temporary spikes.
What Makes This Indicator Different
While many indicators measure volume or volume delta, the VPO specifically measures how aggressively CVD is currently changing and whether that pressure is being sustained. It's the difference between knowing "more volume has accumulated on the buy side" versus "buying pressure is intensifying right now and shows signs of continuation."
1. Focus on CVD Momentum, Not CVD Levels
Most CVD indicators display the cumulative volume delta as a line that trends up or down indefinitely. The VPO is fundamentally different - it measures the slope of CVD rather than the absolute level. This transforms CVD from an unbounded cumulative metric into a bounded 0-100 oscillator that shows the intensity and direction of current volume pressure, not just the historical accumulation.
2. Designed to Stay in Extremes During Trends
Unlike traditional oscillators that treat extreme readings (above 80 or below 20) as overbought/oversold reversal signals, the VPO is engineered to oscillate within extreme zones during strong trends. When sustained buying or selling pressure exists, the indicator remains elevated (e.g., 80-95 or 5-20) rather than quickly reverting to neutral. This makes it useful for trend continuation identification rather than exclusively for reversal trading.
3. Percentile-Based Normalization
The VPO uses percentile ranking over a lookback window, which provides consistent behavior across different instruments, timeframes, and volatility regimes without constant recalibration.
4. Dual-Timeframe Momentum Synthesis
The indicator simultaneously considers short-term CVD momentum (responsive to recent changes) and longer-term CVD momentum (tracking trend direction), weighted and combined with a slow-moving trend bias. This multi-timeframe approach helps it stay responsive in ranging markets while maintaining context during trends.
How to Use the Indicator
Understanding the Zones:
80-100 (Strong Buying Pressure): CVD momentum is strongly positive. In trending markets, the indicator oscillates within this zone rather than immediately reverting to neutral. This suggests sustained accumulation and trend continuation probability.
60-80 (Moderate Buying): Positive volume pressure but not extreme. Suitable for identifying pullback entry opportunities within uptrends.
40-60 (Neutral Zone): Volume pressure is balanced or unclear. No strong directional edge from volume. Often seen during consolidation or trend transitions.
20-40 (Moderate Selling): Negative volume pressure developing. May indicate distribution or downtrend continuation setups.
0-20 (Strong Selling Pressure): CVD momentum is strongly negative. During downtrends, sustained readings in this zone suggest continued distribution and downside follow-through probability.
Practical Applications:
Trend Confirmation: When price makes new highs/lows, check if VPO confirms with similarly elevated readings. Divergences (price making new highs while VPO fails to reach prior highs) may indicate weakening momentum.
Range Trading: During consolidation, the VPO typically oscillates between 30-70. Readings toward the low end of the range (30-40) may present accumulation opportunities, while readings at the high end (60-70) may indicate distribution zones.
Extreme Persistence: If VPO reaches 90+ or drops below 10, this indicates exceptional volume pressure. Rather than fading these extremes immediately, monitor whether the indicator stays elevated. Sustained extreme readings suggest strong trend continuation potential.
Context with Price Action: The VPO is most effective when combined with price action or other orderflow indicators. Use the indicator to gauge whether volume is confirming or contradicting.
What the Indicator Does NOT Do:
It does not provide specific entry or exit signals
It does not predict future price direction
It does not guarantee profitable trades
It should not be used as a standalone trading system
Settings Explanation
Momentum Period (Default: 14)
This parameter controls the lookback period for CVD rate-of-change calculations.
Lower values (5-10): Make the indicator more responsive to recent volume changes. Useful for shorter-term trading and more active oscillation. May produce more whipsaws in choppy markets.
Default value (14): Provides balanced responsiveness while filtering out most noise. Suitable for swing trading and daily timeframe analysis.
Higher values (20-50): Create smoother readings and focus on longer-term volume trends. Better for position trading and reducing false signals, but with slower reaction to genuine changes in volume pressure.
Important Notes:
This indicator requires intrabar data to function properly. On some instruments or timeframes where lower timeframe data is not available, the indicator may not display.
The indicator uses request.security_lower_tf() which has a limit of intrabars. On higher timeframes, this provides extensive history, but on very low timeframes (<1-minute charts), the indicator may only cover limited historical bars.
Volume data quality varies by exchange and instrument. The indicator's effectiveness depends on accurate volume reporting from the data feed.

Dr. Barbara Star: Dual Strategies Combined [Merged] - geminiDr. Barbara Star: Dual Strategy Suite (Merged)
Overview
This script integrates two distinct but complementary trading methodologies developed by Dr. Barbara Star: "Capture Direction & Momentum" and "Profit with Dual Oscillators & Bands." While both strategies utilize price channels to filter noise, they approach entry and exit timing from different angles—one focusing on momentum shifts (Stochastic/EMA) and the other on cyclical price deviations (DPO/Bollinger Bands).
This tool allows the user to run either strategy independently or combine them to find high-confluence setups where momentum and cyclical structure align.
Strategy A: Capture Direction & Momentum
Source: Capture Direction And Momentum
1. Purpose & Theory
The goal of this method is to filter out the "noise" of choppy markets and identify the specific point where price direction aligns with momentum strength. It moves away from trying to catch exact tops or bottoms and instead focuses on catching the "meat" of the trend (continuation).
2. Implementation
Structure (The Channel): A 13-period SMA of the Highs and Lows creates a "No Trade Zone". When price is inside this channel, the market is considered directionless.
Direction (5 EMA): A fast 5-period EMA acts as a directional trigger. When it breaks outside the SMA channel, it signals acceleration.
Momentum (Modified Stochastic): A Slow Stochastic (14,2) is used, but with a crucial modification: the overbought/oversold levels are shifted to 40 and 60 (instead of 20/80).
3. How to Use It
The "Trend Zones" (Background Colors):
Green Background (Bullish): The 5 EMA is above the channel AND the Stochastic is > 60. This is the "Go" zone.
Red Background (Bearish): The 5 EMA is below the channel AND the Stochastic is < 40.
Yellow Background: The "No Trade Zone." The price is consolidating, or the indicators disagree.
The Continuation Signal (Marked by "U" or "D"):
Why it matters: This is the most powerful setup in the system. It detects when price pulls back (retracement) but momentum remains strong.
The Signal: If the 5 EMA dips back into the SMA channel (weakness) but the Stochastic stays above 60 (strength), a blue "U" (Up) marker appears. This indicates the pullback is likely a buying opportunity, not a reversal. Conversely, a yellow "D" appears in downtrends if Stoch stays below 40.
Exits (Marked by "X"):
Signals to take profit when the 5 EMA closes back inside the channel and the Stochastic crosses back into the neutral 40–60 zone.
Strategy B: Dual Oscillators & Bands
Source: Profit With Dual Oscillators & Bands
1. Purpose & Theory
This strategy uses "Dual Bollinger Bands" to define the volatility structure of the trend and "Dual Detrended Price Oscillators" (DPO) to time the entries based on cycle shifts.
2. Implementation
Structure (Dual Bands):
Inner Bands (1 SD): These define the "Trend Channel." Strong trends tend to ride between the 1 SD and 3 SD bands.
Outer Bands (3 SD): These represent extremes (containing 99.5% of price action). Hits here often signal exhaustion.
Timing (Dual DPOs):
Long Oscillator (DPO 20): Identifies the broader trend direction (Positive = Bullish).
Short Oscillator (DPO 9): Identifies shorter-term timing and potential divergences.
3. How to Use It
Identifying the Trend State:
Strong Uptrend: Price holds above the Upper Inner Band (1 SD).
Strong Downtrend: Price holds below the Lower Inner Band (1 SD).
Transition/Neutral: Price is stuck between the Upper and Lower Inner bands.
Entry Signals (Triangles on Chart & Circles in Pane):
Aggressive Entry: When the fast DPO 9 crosses zero. This signals early momentum shifts.
Conservative Entry: Wait for the slow DPO 20 to cross zero, confirming the broader trend has shifted.
Visuals: The script plots triangles on the main chart when these cross. In the lower pane, a Blue Circle indicates a bullish cross and a Yellow Circle indicates a bearish cross.
Continuation Setup:
Similar to Strategy A, look for moments where the DPO 9 dips below zero (pullback) while the DPO 20 remains above zero (trend intact). This is often a reload opportunity.
Combined Mode: The "Power Couple"
When selecting "Both" in the settings, the indicator merges these tools for maximum confirmation:
Visual filtering: The lower pane automatically scales the DPO lines to fit inside the 0–100 Stochastic range (centering the DPO zero line at 50). This allows you to read both momentum and cycles in a single glance.
Confluence Trading:
Look for the Background to turn Green (Strategy A Trend) coincident with a Blue Triangle/Circle (Strategy B Momentum Cross).
Use the Inner Bollinger Bands (Strategy B) as your trailing stop-loss while riding the SMA Channel (Strategy A) trend.
Reference Settings
Strategy A: SMA Channel (13), EMA (5), Stochastic (14, 2, 40/60 levels).
Strategy B: Bollinger Bands (20 SMA, 1.0 & 3.0 deviations), DPO (9 & 20).
Sources: of the methodologies
1-Stocks & Commodities V. 32:7 (10-16): Profit With Dual Oscillators & Bands by Barbara Star, PhD
2-Stocks & Commodities V. 43:12 (8–12): Capture Direction And Momentum by Barbara Star, PhD

Match Finder [theUltimator5]Match Finder is the dating app of indicators. It takes your current ticker and finds the most compatible match over a recent time period. The match may not be Mr. right, but it is Mr. right now. It doesn't forecast future connection, but it tells you current compatibility for today.
Jokes aside, it is a pattern–comparison tool that was designed to find the ticker that tracks most closely to the one you are currently looking at. It scans a user-defined list of 40 tickers (pre-set to a bunch of liquid ETFs) and finds which one most closely matches the recent price action of the current chart over a fixed lookback window.
LOGIC BEHIND THE SCENES
For each bar, the script:
Takes the last N bars (Correlation Window Length) of the current symbol.
Takes the last N bars of each selected comparison ticker.
Calculates the Pearson correlation between the current symbol and each comparison ticker.
Identifies the single best-matching ticker (highest positive correlation, excluding the current symbol itself).
Rescales and overlays that matched segment on the chart so you can visually compare shapes.
Optionally shows a correlation table with all tickers and their correlation values.
The use case of this indicator is to help you see which symbol has recently moved most similarly to your current chart, and how that shape looks when overlaid in the same panel. It helps you see which sectors it may be following most closely to.
Here is an image with arrows showing the elements of this indicator that will be mostly explained later.
USER INPUTS
1. Correlation Window Length
Default: 30
Range: 10–500
This is the number of bars used to compare the current symbol against each ticker.
Important - Larger values produce more “global” shape comparison but increase computational load and may cause the indicator to timeout if the length is too long
2. Drawing Mode
Options:
Scale Only - Adjusts min and max of the plotted line segment to match the chart over the range
Scale & Rotate - Scales as above, but matches the first and last point to the close of the chart over the range. This effectively rotates the pattern to force it to track the chart to an extent.
3. Show Correlation Table
When enabled (disabled by default), shows a table in the bottom-right of the chart that displays the correlation values over the lookback range for all 40 tickers. The best fit ticker is highlighted.
4. Best Fit Line Color
Color used to draw the overlaid best-match segment (yellow by default).
5. Ticker inputs (1–40)
Default set to a broad universe of major ETFs (e.g., SPY, QQQ, IWM, sector and bond ETFs, commodities, etc.).
You can replace these with any symbols supported by your data feed (stocks, ETFs, indexes, etc.).
The script always excludes the current chart’s symbol from being considered as its own best match.
NOTE: THIS INDICATOR IS EXTREMELY MEMORY INTENSIVE AND MAY TAKE SEVERAL SECONDS TO LOAD. PLEASE BE PATIENT AND GIVE THE INDICATOR UP TO 20 SECONDS FOR THE DATA TO DISPLAY

Victoria Overlay - HTF 200 + VWAP + ATR Stop + MA TrioConsolidated road to minions
Buy Setup:
EMA1 crosses above SMA3.
RSI confirms above 50.
Volume increasing (confirming momentum).
Candle closes above SMA1 base.
Sell Setup:
EMA1 crosses below SMA3.
RSI drops below 50 or exits overbought.
Volume confirms (declining or reversing).
Candle closes below SMA1 base.
Tips:
Think of EMA1 as the scalper’s trigger.
SMA3 is your momentum check.
SMA1 (base) = short-term bias.
Avoid entries during low-volume chop.
Use for day trades or tight scalps; exits happen fast.
Overlay (Smoothed Heikin Ashi + Swing + VWAP + ATR Stop + 200-SMA)
Purpose: Multi-layer trend confirmation + clean structure.
Type: Swing alignment tool.
🟩 BUY / CALL Conditions
Green “Buy (Gated)” arrow appears.
Price is above VWAP, above 200-SMA, and above ATR stop.
ATR stop (green line) sits under price → support confirmed.
Heikin-Ashi candles are green/lime.
Bias label says “Above VWAP | Above 200 | Swing Up”.
🟥 SELL / PUT Conditions
Red “Sell (Gated)” arrow appears.
Price is below VWAP, below 200-SMA, and below ATR stop.
ATR stop (red line) sits above price → resistance confirmed.
Heikin-Ashi candles are red.
Bias label says “Below VWAP | Below 200 | Swing Down”.
Exit / Risk Control:
Close position when price crosses ATR stop.
If Heikin candles flip color, momentum is reversing.
Best Use Cases:
For next-day or multi-hour swing entries.
Use ATR Stop for dynamic stop loss.
Stay out when the bias label is mixed (e.g. “Above VWAP | Below 200 | Swing Down”).
Pro Tip:
On big news days, let VWAP reset post-open before acting on arrows — filters fake signals.
RSI Panel Pro (v6)
Purpose: Strength + exhaustion confirmation.
Type: Momentum filter.
Key Levels:
Overbought: 80+ → take profits soon.
Oversold: 20– → watch for bounce setups.
Bull regime: RSI above 60 = momentum strong.
Bear regime: RSI below 40 = weakness.
Buy / Entry Signals:
RSI crosses up from below 40 or 20.
RSI line is above RSI-EMA (gray line).
Higher timeframe RSI (if used) is also rising.
Trim / Exit:
RSI drops under 60 after being strong.
RSI crosses below its EMA.
Sell / Put Setup:
RSI fails at 60 or drops below 40.
RSI crosses under EMA after a bounce.
Tips:
Pair RSI panel with Victoria Overlay — only take gated buys when RSI confirms.
RSI < 40 but above 20 = “loading zone” for reversals.
RSI > 70 = overextended → wait for confirmation before entering.
Combined Execution Rules
Goal What to Watch Action
Entry (CALL) EMA1 > SMA3, Buy (Gated) arrow, RSI rising > 50 Buy call / open long
Entry (PUT) EMA1 < SMA3, Sell (Gated) arrow, RSI < 50 Buy put / open short
Exit Early Price crosses ATR stop or RSI flips under EMA Exit trade / protect gains
Trend Filter VWAP + 200-SMA alignment Only trade in that direction
Avoid Trades Conflicting bias label or low volume Stay flat
Pro Tips
VWAP → Intraday mean: above = bullish control, below = bearish control.
ATR Stop → Dynamic trailing stop: never widen it manually.
Smoothed Heikin-Ashi → filters noise: trend stays until color flips twice.
RSI Panel → confirms whether to hold through pullbacks.
If RSI and Overlay disagree — wait, not trade.

cd_correlation_analys_Cxcd_correlation_analys_Cx
General:
This indicator is designed for correlation analysis by classifying stocks (487 in total) and indices (14 in total) traded on Borsa İstanbul (BIST) on a sectoral basis.
Tradingview's sector classifications (20) have been strictly adhered to for sector grouping.
Depending on user preference, the analysis can be performed within sectors, between sectors, or manually (single asset).
Let me express my gratitude to the code author, @fikira, beforehand; you will find the reason for my thanks in the context.
Details:
First, let's briefly mention how this indicator could have been prepared using the classic method before going into details.
Classically, assets could be divided into groups of forty (40), and the analysis could be performed using the built-in function:
ta.correlation(source1, source2, length) → series float.
I chose sectoral classification because I believe there would be a higher probability of assets moving together, rather than using fixed-number classes.
In this case, 21 arrays were formed with the following number of elements:
(3, 11, 21, 60, 29, 20, 12, 3, 31, 5, 10, 11, 6, 48, 73, 62, 16, 19, 13, 34 and indices (14)).
However, you might have noticed that some arrays have more than 40 elements. This is exactly where @Fikira's indicator came to the rescue. When I examined their excellent indicator, I saw that it could process 120 assets in a single operation. (I believe this was the first limit overrun; thanks again.)
It was amazing to see that data for 3 pairs could be called in a single request using a special method.
You can find the details here:
When I adapted it for BIST, I found it sufficient to call data for 2 pairs instead of 3 in a single go. Since asset prices are regular and have 2 decimal places, I used a fixed multiplier of $10^8$ and a fixed decimal count of 2 in Fikira's formulas.
With this method, the (high, low, open, close) values became accessible for each asset.
The summary up to this point is that instead of the ready-made formula + groups of 40, I used variable-sized groups and the method I will detail now.
Correlation/harmony/co-movement between assets provides advantages to market participants. Coherent assets are expected to rise or fall simultaneously.
Therefore, to convert co-movement into a mathematical value, I defined the possible movements of the current candle relative to the previous candle bar over a certain period (user-defined). These are:
Up := high > high and low > low
Down := high < high and low < low
Inside := high <= high and low >= low
Outside := high >= high and low <= low and NOT Inside.
Ignore := high = low = open = close
If both assets performed the same movement, 1 was added to the tracking counter.
If (Up-Up), (Down-Down), (Inside-Inside), or (Outside-Outside), then counter := counter + 1.
If the period length is 100 and the counter is 75, it means there is 75% co-movement.
Corr = counter / period ($75/100$)
Average = ta.sma(Corr, 100) is obtained.
The highest coefficients recorded in the array are presented to the user in a table.
From the user menu options, the user can choose to compare:
• With assets in its own sector
• With assets in the selected sector
• By activating the confirmation box and manually entering a single asset for comparison.
Table display options can be adjusted from the Settings tab.
In the attached examples:
Results for AKBNK stock from the Finance sector compared with GARAN stock from the same sector:
Timeframe: Daily, Period: 50 => Harmony 76% (They performed the same movement in 38 out of 50 bars)
Comment: Opposite movements at swing high and low levels may indicate a change in the direction of the price flow (SMT).
Looking at ASELS from the Electronic Technology sector over the last 30 daily candles, they performed the same movements by 40% with XU100, 73.3% (22/30) with XUTEK (Technology Index), and 86.9% according to the averages.
Comment: It is more appropriate to follow ASELS stock with XUTEK (Technology index) instead of the general index (XU100). Opposite movements at swing high and low levels may indicate a change in the direction of the price flow (SMT).
Again, when ASELS stock is taken on H1 instead of daily, and the length is 100 instead of 30, the harmony rate is seen to be 87%.
Please share your thoughts and criticisms regarding the indicator, which I prepared with a bit of an educational purpose specifically for BIST.
Happy trading.

15-Min RSI Scalper [SwissAlgo]15-Min RSI Scalper
Tracks RSI Momentum Loss and Gain to Generate Signals
-------------------------------------------------------
WHAT THIS INDICATOR CALCULATES
This indicator attempts to identify RSI directional changes (RSI momentum) using a step-by-step "ladder" method. It reads RSI(14) from the next higher timeframe relative to your chart. On a 15-minute chart, it uses 1-hour RSI. On a 5-minute chart, it uses 15-minute RSI, and so on.
How the ladder logic works:
The indicator doesn't track RSI all the time. It only starts tracking when RSI crosses into potentially extreme territory (these are called "events" in the code):
For sell signals : when RSI crosses above a dynamic upper threshold (typically between 60-80, calculated as the 90th percentile of recent RSI)
For buy signals : when RSI crosses below a dynamic lower threshold (typically between 20-40, calculated as the 10th percentile of recent RSI)
Once tracking begins, RSI movement is divided into 2-point steps (boxes). The indicator counts how many boxes RSI climbs or falls.
A signal generates only when:
RSI reverses direction by at least 2 boxes (4 RSI points) from its extreme
RSI holds that reversal for 3 consecutive confirmed bars
Example: Dynamic threshold is at 68. RSI crosses above 68 → tracking starts. RSI climbs to 76 (4 boxes up). Then it drops back to 72 and stays below that level for 3 bars → sell signal prints. The buy signal works the same way in reverse.
-------------------------------------------------------
SIGNAL GENERATION METHODOLOGY
Sell Signal (Red Triangle)
RSI crosses above a dynamic start level (calculated as the 90th percentile of the last 1000 bars, constrained between 60-80)
Indicator tracks upward progression in 2-point boxes
RSI reverses and drops below a boundary 2 boxes below the highest box reached
RSI remains below that boundary for 3 confirmed bars
Red triangle plots above price
Reset condition: RSI returns below 50
Buy Signal (Green Triangle)
RSI crosses below a dynamic start level (10th percentile of last 1000 bars, constrained between 20-40)
Indicator tracks downward progression in 2-point boxes
RSI reverses and rises above a boundary 2 boxes above the lowest box reached
RSI remains above that boundary for 3 confirmed bars
Green triangle plots below price
Reset condition: RSI returns above 50
-------------------------------------------------------
TECHNICAL PARAMETERS
All parameters are hardcoded:
RSI Period: 14
Box Size: 2 RSI points
Reversal Threshold: 2 boxes (4 RSI points)
Confirmation Period: 3 bars
Reset Level: RSI 50
Sell Start Range: 60-80 (dynamic)
Buy Start Range: 20-40 (dynamic)
Lookback for Percentile: 1000 bars
Note: Since the code is open source, users can modify these hardcoded values directly in the script to adjust sensitivity. For example, increasing the confirmation period from 3 to 5 bars will produce fewer but more conservative signals. Decreasing the box size from 2 to 1 will make the indicator more responsive to smaller RSI movements.
-------------------------------------------------------
KEY FEATURES
Automatic Higher Timeframe RSI
When applied to a 15-minute chart, the indicator automatically reads 1-hour RSI data. This is the next standard timeframe above 15 minutes in the indicator's logic.
Dynamic Adaptive Start Levels
Sell signals use the 90th percentile of RSI over the last 1000 bars, constrained between 60-80. Buy signals use the 10th percentile, constrained between 20-40. These thresholds recalculate on each bar based on recent data.
Ladder Box System
RSI movements are tracked in 2-point boxes. The indicator requires a 2-box reversal followed by 3 consecutive bars maintaining that reversal before generating a signal.
Dual Signal Output
Red down-triangles plot above price when the sell signal conditions are met. Green up-triangles plot below the price when buy signal conditions are met.
-------------------------------------------------------
REPAINTING
This indicator does not repaint. All calculations use "barstate.isconfirmed" to ensure signals appear only on closed bars. The request.security() call uses lookahead=barmerge.lookahead_off to prevent forward-looking bias.
-------------------------------------------------------
INTENDED CHART TIMEFRAME
This indicator is designed for use on 15-minute charts. The visual reminder table at the top of the chart indicates this requirement.
On a 15-minute chart:
RSI data comes from the 1-hour timeframe
Signals reflect 1-hour momentum shifts
3-bar confirmation equals 45 minutes of price action
Using it on other timeframes will change the higher timeframe RSI source and may produce different behavior.
-------------------------------------------------------
WHAT THIS INDICATOR DOES NOT DO
Does not predict future price movements
Does not provide entry or exit advice
Does not guarantee profitable trades
Does not replace comprehensive technical analysis
Does not account for fundamental factors, news events, or market structure
Does not adapt to all market conditions equally
-------------------------------------------------------
EDUCATIONAL USE
This indicator demonstrates one approach to momentum reversal detection using:
Multi-timeframe analysis
Adaptive thresholds via percentile calculation
Step-wise momentum tracking
Multi-bar confirmation logic
It is designed as a technical study, not a trading system. Signals represent calculated conditions based on RSI behavior, not trade recommendations. Always do your own analysis before taking market positions.
-------------------------------------------------------
RISK DISCLOSURE
Trading involves substantial risk of loss. This indicator:
Is for educational and informational purposes only
Does not constitute financial, investment, or trading advice
Should not be used as the sole basis for trading decisions
Has not been tested across all market conditions
May produce false signals, late signals, or no signals in certain conditions
Past performance of any indicator does not predict future results. Users must conduct their own analysis and risk assessment before making trading decisions. Always use proper risk management, including stop losses and position sizing appropriate to your account and risk tolerance.
MIT LICENSE
This code is open source and provided as-is without warranties of any kind. You may use, modify, and distribute it freely under the MIT License.

Confluence Engine Confluence Engine is a practical, non-repainting decision aid that scores market conditions from −100…+100 by combining six proven modules: Trend, Momentum, Volatility, Volume, Structure, and an HTF confirmation. It’s designed for crypto, forex, indices, and stocks, and it fires entries only on confirmed bar closes.
What’s inside
Trend: EMA 20/50/200 alignment plus a Supertrend/KAMA toggle (you choose the baseline).
Momentum: RSI + MACD with confirmed-pivot divergence detection.
Volatility: ATR% and Bollinger Band width vs its average to favor expansion over chop.
Volume: OBV-style cumulative flow slope + volume surge vs SMA×multiplier.
Market Structure: Confirmed pivots, BOS (break of structure) and CHOCH (change of character).
HTF Filter: Closed higher-timeframe context via request.security(..., barmerge.gaps_on, barmerge.lookahead_off).
Why it does not repaint
Signals are computed and plotted on closed bars only.
Pivots/divergences use confirmed pivot points (no forward look).
HTF series are fetched with lookahead_off and use the last closed HTF bar in realtime.
No future bar references are used for entries or alerts.
How to use (3 steps)
Pick a timeframe pair: use a 4–6× HTF multiplier (5m→30m, 15m→1h, 1h→4h, 4h→1D, 1D→1W).
Trade with the HTF: take longs only when the HTF filter is bullish; shorts only when bearish.
Prefer expansion: act when BB width > its average and ATR% is elevated; skip most signals in compression.
Suggested presets (start here)
Crypto (BTC/ETH): 15m→1h, 1h→4h. stLen=10, stMult=3.0, bbLen=20, surgeMul=1.8–2.2, thresholds +40 / −40 (intraday can try +35 / −35).
Forex majors: 15m→1h, 1h→4h. stLen=10–14, stMult=2.5–3.0, surgeMul=1.5–1.8, thresholds +35 / −35 (swing: +45 / −45).
US equities (liquid): 5m→30m/1h, 15m→1h/2h. stMult=3.0–3.5, surgeMul=1.6–2.0, thresholds +45 / −45 to reduce chop.
Indices (ES/NQ): 5m→30m, 15m→1h. Defaults are fine; start at +40 / −40.
Gold/Oil: 15m→1h, 1h→4h. Thresholds +35 / −35, surgeMul=1.6–1.9.
Inputs (plain English)
Use Supertrend (off = KAMA): choose the trend baseline.
EMA Fast/Mid/Slow: 20/50/200 by default for classic stack.
RSI/MACD + divergence pivots: momentum and exhaustion context.
ATR Length & BB Length: volatility regime detection.
Volume SMA & Surge Multiplier: defines “meaningful” volume spikes.
Pivot left/right & “Confirm BOS/CHOCH on Close”: structure strictness.
Enable HTF & Higher Timeframe: confirms the lower timeframe direction.
Thresholds (+long / −short): when the score crosses these, you get signals.
Signals & alerts (IDs preserved)
Entry shapes plot at bar close when the score crosses thresholds.
Alerts you can enable:
CONFLUENCE LONG — long entry signal
CONFLUENCE SHORT — short entry signal
BULLISH BIAS — score turned positive
BEARISH BIAS — score turned negative
Best practices
Focus on signals with HTF agreement and volatility expansion; require volume participation (surge or rising OBV slope) for higher quality.
Raise thresholds (+45/−45 or +50/−50) to reduce whipsaws in choppy sessions.
Lower thresholds (+35/−35) only if you also require volatility/volume filters.
Performance & scope
Works across crypto/FX/equities/indices; no broker data or special feeds required.
No repainting by design; signals/alerts are computed on closed bars.
As with any tool, results vary by regime; always combine with risk management.
Disclosure
This script is for educational purposes only and is not financial advice. Trading involves risk. Test on historical data and paper trade before using live.

ADX MTF mura visionOverview
ADX MTF — mura vision measures trend strength and visualizes a higher-timeframe (HTF) ADX on any chart. The current-TF ADX is drawn as a line; the HTF ADX is rendered as “step” segments to reflect closed HTF bars without repainting. Optional soft fills highlight the 20–25 (trend forming) and 40–50 (strong trend) zones.
How it works
ADX (current TF) : Classic Wilder formulation using DI components and RMA smoothing.
HTF ADX : Requested via request.security(..., lookahead_off, gaps_off).
When a new HTF bar opens, the previous value is frozen as a horizontal segment.
The current HTF bar is shown as a live moving segment.
This staircase look is expected on lower timeframes.
Auto timeframe mapping
If “Auto” is selected, the HTF is derived from the chart TF:
<30m → 60m, 30–<240m → 240m, 240m–<1D → 1D, 1D → 1W, 1W/2W → 1M, ≥1M → same.
Inputs
DI Length and ADX Smoothing — core ADX parameters.
Higher Time Frame — Auto or a fixed TF.
Line colors/widths for current ADX and HTF ADX.
Fill zone 20–25 and Fill zone 40–50 — optional light background fills.
Number of HTF ADX Bars — limits stored HTF segments to control chart load.
Reading the indicator
ADX < 20: typically range-bound conditions; trend setups require extra caution.
20–25: trend emergence; breakouts and continuation structures gain validity.
40–50: strong trend; favor continuation and manage with trailing stops.
>60 and turning down: possible trend exhaustion or transition toward range.
Note: ADX measures strength, not direction. Combine with your directional filter (e.g., price vs. MA, +DI/−DI, structure/levels).
Non-repainting behavior
HTF values use lookahead_off; closed HTF bars are never revised.
The only moving piece is the live segment for the current HTF bar.
Best practices
Use HTF ADX as a regime filter; time entries with the current-TF ADX rising through your threshold.
Pair with ATR-based stops and a MA/structure filter for direction.
Consider higher thresholds on highly volatile altcoins.
Performance notes
The script draws line segments for HTF bars. If your chart becomes heavy, reduce “Number of HTF ADX Bars.”
Disclaimer
This script is for educational purposes only and does not constitute financial advice. Trading involves risk.

Martingale Strategy Simulator [BackQuant]Martingale Strategy Simulator
Purpose
This indicator lets you study how a martingale-style position sizing rule interacts with a simple long or short trading signal. It computes an equity curve from bar-to-bar returns, adapts position size after losing streaks, caps exposure at a user limit, and summarizes risk with portfolio metrics. An optional Monte Carlo module projects possible future equity paths from your realized daily returns.
What a martingale is
A martingale sizing rule increases stake after losses and resets after a win. In its classical form from gambling, you double the bet after each loss so that a single win recovers all prior losses plus one unit of profit. In markets there is no fixed “even-money” payout and returns are multiplicative, so an exact recovery guarantee does not exist. The core idea is unchanged:
Lose one leg → increase next position size
Lose again → increase again
Win → reset to the base size
The expectation of your strategy still depends on the signal’s edge. Sizing does not create positive expectancy on its own. A martingale raises variance and tail risk by concentrating more capital as a losing streak develops.
What it plots
Equity – simulated portfolio equity including compounding
Buy & Hold – equity from holding the chart symbol for context
Optional helpers – last trade outcome, current streak length, current allocation fraction
Optional diagnostics – daily portfolio return, rolling drawdown, metrics table
Optional Monte Carlo probability cone – p5, p16, p50, p84, p95 aggregate bands
Model assumptions
Bar-close execution with no slippage or commissions
Shorting allowed and frictionless
No margin interest, borrow fees, or position limits
No intrabar moves or gaps within a bar (returns are close-to-close)
Sizing applies to equity fraction only and is capped by your setting
All results are hypothetical and for education only.
How the simulator applies it
1) Directional signal
You pick a simple directional rule that produces +1 for long or −1 for short each bar. Options include 100 HMA slope, RSI above or below 50, EMA or SMA crosses, CCI and other oscillators, ATR move, BB basis, and more. The stance is evaluated bar by bar. When the stance flips, the current trade ends and the next one starts.
2) Sizing after losses and wins
Position size is a fraction of equity:
Initial allocation – the starting fraction, for example 0.15 means 15 percent of equity
Increase after loss – multiply the next allocation by your factor after a losing leg, for example 2.00 to double
Reset after win – return to the initial allocation
Max allocation cap – hard ceiling to prevent runaway growth
At a high level the size after k consecutive losses is
alloc(k) = min( cap , base × factor^k ) .
In practice the simulator changes size only when a leg ends and its PnL is known.
3) Equity update
Let r_t = close_t / close_{t-1} − 1 be the symbol’s bar return, d_{t−1} ∈ {+1, −1} the prior bar stance, and a_{t−1} the prior bar allocation fraction. The simulator compounds:
eq_t = eq_{t−1} × (1 + a_{t−1} × d_{t−1} × r_t) .
This is bar-based and avoids intrabar lookahead. Costs, slippage, and borrowing costs are not modeled.
Why traders experiment with martingale sizing
Mean-reversion contexts – if the signal often snaps back after a string of losses, adding size near the tail of a move can pull the average entry closer to the turn
Behavioral or microstructure edges – some rules have modest edge but frequent small whipsaws; size escalation may shorten time-to-recovery when the edge manifests
Exploration and stress testing – studying the relationship between streaks, caps, and drawdowns is instructive even if you do not deploy martingale sizing live
Why martingale is dangerous
Martingale concentrates capital when the strategy is performing worst. The main risks are structural, not cosmetic:
Loss streaks are inevitable – even with a 55 percent win rate you should expect multi-loss runs. The probability of at least one k-loss streak in N trades rises quickly with N.
Size explodes geometrically – with factor 2.0 and base 10 percent, the sequence is 10, 20, 40, 80, 100 (capped) after five losses. Without a strict cap, required size becomes infeasible.
No fixed payout – in gambling, one win at even odds resets PnL. In markets, there is no guaranteed bounce nor fixed profit multiple. Trends can extend and gaps can skip levels.
Correlation of losses – losses cluster in trends and in volatility bursts. A martingale tends to be largest just when volatility is highest.
Margin and liquidity constraints – leverage limits, margin calls, position limits, and widening spreads can force liquidation before a mean reversion occurs.
Fat tails and regime shifts – assumptions of independent, Gaussian returns can understate tail risk. Structural breaks can keep the signal wrong for much longer than expected.
The simulator exposes these dynamics in the equity curve, Max Drawdown, VaR and CVaR, and via Monte Carlo sketches of forward uncertainty.
Interpreting losing streaks with numbers
A rough intuition: if your per-trade win probability is p and loss probability is q=1−p , the chance of a specific run of k consecutive losses is q^k . Over many trades, the chance that at least one k-loss run occurs grows with the number of opportunities. As a sanity check:
If p=0.55 , then q=0.45 . A 6-loss run has probability q^6 ≈ 0.008 on any six-trade window. Across hundreds of trades, a 6 to 8-loss run is not rare.
If your size factor is 1.5 and your base is 10 percent, after 8 losses the requested size is 10% × 1.5^8 ≈ 25.6% . With factor 2.0 it would try to be 10% × 2^8 = 256% but your cap will stop it. The equity curve will still wear the compounded drawdown from the sequence that led to the cap.
This is why the cap setting is central. It does not remove tail risk, but it prevents the sizing rule from demanding impossible positions
Note: The p and q math is illustrative. In live data the win rate and distribution can drift over time, so real streaks can be longer or shorter than the simple q^k intuition suggests..
Using the simulator productively
Parameter studies
Start with conservative settings. Increase one element at a time and watch how the equity, Max Drawdown, and CVaR respond.
Initial allocation – lower base reduces volatility and drawdowns across the board
Increase factor – set modestly above 1.0 if you want the effect at all; doubling is aggressive
Max cap – the most important brake; many users keep it between 20 and 50 percent
Signal selection
Keep sizing fixed and rotate signals to see how streak patterns differ. Trend-following signals tend to produce long wrong-way streaks in choppy ranges. Mean-reversion signals do the opposite. Martingale sizing interacts very differently with each.
Diagnostics to watch
Use the built-in metrics to quantify risk:
Max Drawdown – worst peak-to-trough equity loss
Sharpe and Sortino – volatility and downside-adjusted return
VaR 95 percent and CVaR – tail risk measures from the realized distribution
Alpha and Beta – relationship to your chosen benchmark
If you would like to check out the original performance metrics script with multiple assets with a better explanation on all metrics please see
Monte Carlo exploration
When enabled, the forecast draws many synthetic paths from your realized daily returns:
Choose a horizon and a number of runs
Review the bands: p5 to p95 for a wide risk envelope; p16 to p84 for a narrower range; p50 as the median path
Use the table to read the expected return over the horizon and the tail outcomes
Remember it is a sketch based on your recent distribution, not a predictor
Concrete examples
Example A: Modest martingale
Base 10 percent, factor 1.25, cap 40 percent, RSI>50 signal. You will see small escalations on 2 to 4 loss runs and frequent resets. The equity curve usually remains smooth unless the signal enters a prolonged wrong-way regime. Max DD may rise moderately versus fixed sizing.
Example B: Aggressive martingale
Base 15 percent, factor 2.0, cap 60 percent, EMA cross signal. The curve can look stellar during favorable regimes, then a single extended streak pushes allocation to the cap, and a few more losses drive deep drawdown. CVaR and Max DD jump sharply. This is a textbook case of high tail risk.
Strengths
Bar-by-bar, transparent computation of equity from stance and size
Explicit handling of wins, losses, streaks, and caps
Portable signal inputs so you can A–B test ideas quickly
Risk diagnostics and forward uncertainty visualization in one place
Example, Rolling Max Drawdown
Limitations and important notes
Martingale sizing can escalate drawdowns rapidly. The cap limits position size but not the possibility of extended adverse runs.
No commissions, slippage, margin interest, borrow costs, or liquidity limits are modeled.
Signals are evaluated on closes. Real execution and fills will differ.
Monte Carlo assumes independent draws from your recent return distribution. Markets often have serial correlation, fat tails, and regime changes.
All results are hypothetical. Use this as an educational tool, not a production risk engine.
Practical tips
Prefer gentle factors such as 1.1 to 1.3. Doubling is usually excessive outside of toy examples.
Keep a strict cap. Many users cap between 20 and 40 percent of equity per leg.
Stress test with different start dates and subperiods. Long flat or trending regimes are where martingale weaknesses appear.
Compare to an anti-martingale (increase after wins, cut after losses) to understand the other side of the trade-off.
If you deploy sizing live, add external guardrails such as a daily loss cut, volatility filters, and a global max drawdown stop.
Settings recap
Backtest start date and initial capital
Initial allocation, increase-after-loss factor, max allocation cap
Signal source selector
Trading days per year and risk-free rate
Benchmark symbol for Alpha and Beta
UI toggles for equity, buy and hold, labels, metrics, PnL, and drawdown
Monte Carlo controls for enable, runs, horizon, and result table
Final thoughts
A martingale is not a free lunch. It is a way to tilt capital allocation toward losing streaks. If the signal has a real edge and mean reversion is common, careful and capped escalation can reduce time-to-recovery. If the signal lacks edge or regimes shift, the same rule can magnify losses at the worst possible moment. This simulator makes those trade-offs visible so you can calibrate parameters, understand tail risk, and decide whether the approach belongs anywhere in your research workflow.

Top Crypto Above 28-Day AverageDescription
The “Top Crypto Above 28-Day Average” (CRYPTOTW) script scans a selectable universe of up to 120 top-capitalization cryptocurrencies (divided into customizable 40-symbol batches), then plots the count of those trading above their own 28-period simple moving average. It helps you gauge broad market strength and identify which tokens are showing momentum relative to their recent trend.
Key Features
• Batch Selection: Choose among “Top40,” “Mid40,” or “Low40” market-cap groups, or set a custom batch size (up to 40 symbols) to keep within the API limit.
• Dynamic Plot: Displays a live line chart of how many cryptos are above their 28-day MA on each bar.
• Reference Lines: Automatic horizontal lines at 25%, 50%, and 75% of your batch to provide quick visual thresholds.
• Background Coloration: The chart background shifts green/yellow/red based on whether more than 70%, 50–70%, or under 50% of the batch is above the MA.
• Optional Table: On the final bar, show a sortable table of up to 28 tickers currently above their 28-day MA, including current price, percent above MA, and “Above” status color-coding.
• Alerts:
• Strong Batch Performance: Fires when >70% of the batch is above the MA.
• Weak Batch Performance: Fires when <10 cryptos (i.e. <25%) are above the MA.
Inputs
• Show Results Table (show_table): Toggle the detailed table on/off.
• Table Position (table_position): Select one of the four corners for your table overlay.
• Max Cryptos to Display (max_display): Limit the number of rows in the results table.
• Current Batch (current_batch): Pick “Top40,” “Mid40,” or “Low40.”
• Batch Size (batch_size): Define the number of symbols (1–40) you want to include from the chosen batch.
How to Use
1. Add the CRYPTOTW indicator to any chart.
2. Select your batch and size to focus on the segment of the crypto market you follow.
3. Watch the plotted line to see the proportion of tokens with bullish momentum.
4. (Optional) Enable the results table to see exactly which tokens are outperforming their 28-day average.
5. Set alerts to be notified when the batch either overheats (strong performance) or cools off significantly.
Why It Matters
By tracking the share of assets riding their 28-day trend, you gain a macro-level view of market breadth—crucial for spotting emerging rallies or early signs of broad weakness. Whether you’re swing-trading individual altcoins or assessing overall market mood, this tool distills complex data into an intuitive, actionable signal.

Momentum Trail Oscillator [AlgoAlpha]🟠 OVERVIEW
This script builds a Momentum Trail Oscillator designed to measure directional momentum strength and dynamically track shifts in trend bias using a combination of smoothed price change calculations and adaptive trailing bands. The oscillator aims to help traders visualize when momentum is expanding or contracting and to identify transitions between bullish and bearish conditions.
🟠 CONCEPTS
The core idea combines two methods. First, the script calculates a normalized momentum measure by smoothing price changes relative to their absolute values, which creates a bounded oscillator that highlights whether moves are directional or choppy. Second, it uses a trailing band mechanism inspired by volatility stops, where bands adapt to the oscillator’s volatility, adjusting the thresholds that define a shift in directional bias. This dual approach seeks to address both the magnitude and persistence of momentum, reducing false signals in ranging markets.
🟠 FEATURES
The momentum calculation applies Hull Moving Averages and double EMA smoothing to price changes, producing a smooth, responsive oscillator.
The trailing bands are derived by offsetting a weighted moving average of the oscillator by a multiple of recent momentum volatility. A directional state variable tracks whether the oscillator is above or below the bands, updating when the momentum crosses these dynamic thresholds.
Overbought and oversold zones are visually marked between fixed levels (+30/+40 and -30/-40), with color fills to highlight when momentum is in extreme areas. The script plots signals on both the oscillator pane and optionally overlays markers on the main price chart for clarity.
🟠 USAGE
To use the indicator, apply it to any symbol and timeframe. The “Oscillator Length” controls how sensitive the momentum line is to recent price changes—lower values react faster, higher values smooth out noise. The “Trail Multiplier” sets how far the adaptive bands sit from the oscillator mid-line, which affects how often trend state changes occur. When the momentum line rises into the upper filled area and then crosses back below +40, it signals potential overbought exhaustion. The opposite applies for the oversold zone below -40. The plotted trailing bands switch visibility depending on the current directional state: when momentum is trending up, the lower band acts as the active trailing stop, and when trending down, the upper band becomes active. Trend changes are marked with circular symbols when the direction variable flips, and optional overlay arrows appear on the price chart to highlight overbought or oversold reversals. Traders can combine these signals with their own price action or volume analysis to confirm entries or exits.

Market Matrix ViewThis technical indicator is designed to provide traders with a quick and integrated view of market dynamics by combining several popular indicators into a single tool. It's not a magic bullet, but a practical aid for analyzing buying/selling pressure, trends, volume, and divergences, saving you time in the decision-making process. Built for flexibility, the indicator adapts to various trading styles (scalping, swing, or long-term) and offers customizable settings to suit your needs.
🟡 Multi-Timeframe Trends
➤ This section displays the trend direction (bullish, bearish, or neutral) across 15-minute, 1-hour, 4-hour, and Daily timeframes, providing multi-timeframe market context. Timeframes lower than the one currently selected will show "N/A."
➤It utilizes fast and slow Exponential Moving Averages (EMAs) for each timeframe:
15m: Fast EMA 42, Slow EMA 170
1h: Fast EMA 40, Slow EMA 100
4h: Fast EMA 36, Slow EMA 107
Daily: Fast EMA 20, Slow EMA 60
🟡 Smart Flow & RVOL
➤ This section displays "Buying Pressure" or "Selling Pressure" signals based on indicator confluence, alongside volume activity ("High Activity," "Normal Activity," or "Low Activity").
➤ Smart Flow combines Chaikin Money Flow (CMF) and Money Flow Index (MFI) to detect buying/selling pressure. CMF measures money flow based on price position within the high-low range, while MFI analyzes money flow considering typical price and volume. A signal is generated only when both indicators simultaneously increase/decrease beyond an adjustable threshold ("Buy/Sell Sensitivity") and volume exceeds a Simple Moving Average (SMA) scaled by the "Volume Multiplier."
➤ RVOL (Relative Volume) calculates relative volume separately for bullish and bearish candles, comparing recent volume (fast SMA) with a reference volume (slow SMA). Thresholds are adjusted based on the selected mode.
🟡 ADX & RSI
This section displays trend strength ("Strong," "Moderate," or "Weak"), its direction ("Bullish" or "Bearish"), and the RSI momentum status ("Overbought," "Oversold," "Buy/Sell Momentum," or "Neutral").
➤ ADX (Average Directional Index) measures trend strength (above 40 = "Strong," 20–40 = "Moderate," below 20 = "Weak"). Direction is determined by comparing +DI (upward movement) with -DI (downward movement). Additionally, an arrow indicates whether the trend's strength is decreasing or increasing.
➤RSI (Relative Strength Index) evaluates price momentum. Extreme levels (above 80/85 = "Overbought," below 15/20 = "Oversold") and intermediate zones (47–53 = "Neutral," above 53 = "Buy Momentum," below 47 = "Sell Momentum") are adjusted based on the selected mode.
🟡 When these signals are active for a potential trade setup, the table's background lights up green or red, respectively.
🟡 Volume Spikes
➤This feature highlights bars with significantly higher volume than the recent average, coloring them yellow on the chart to draw attention to intense market activity.
➤It uses the Z-Score method to detect volume anomalies. Current volume is compared to a 10-bar Simple Moving Average (SMA) and the standard deviation of volume over the same period. If the Z-Score exceeds a certain threshold, the bar is marked as a volume spike.
🟡 Divergences (Volume Divergence Detection)
➤ This feature marks divergences between price and technical indicators on the chart, using diamond-shaped labels (green for bullish divergences, red for bearish divergences) to signal potential trend reversals.
➤ It compares price deviations from a Simple Moving Average (SMA) with deviations of three indicators: Chaikin Money Flow (CMF), Money Flow Index (MFI), and On-Balance Volume (OBV). A bullish divergence occurs when price falls below its average, but CMF, MFI, and OBV rise above their averages, indicating hidden accumulation. A bearish divergence occurs when price rises above its average, but CMF, MFI, and OBV fall, suggesting distribution. The length of the moving averages is adjustable (default 13/10/5 bars for Scalping/Balanced/Swing), and detection thresholds are scaled by "Divergence Sensitivity" (default 1.0).
🟡 Adaptive Stop-Loss (ATR)
➤Draws dynamic stop-loss lines (red, dashed) on the chart for buy or sell signals, helping traders manage risk.Uses the Average True Range (ATR) to calculate stop-loss levels, set at low/high ± ATR × multiplier
🟡 Alerts for trend direction changes in the Info Panel:
➤ Triggers notifications when the trend shifts to Bullish (when +DI crosses above -DI) or Bearish (when +DI crosses below -DI), helping you stay informed about key market shifts.
How to use: Set alerts in Trading View for “Trend Changed to Bullish” or “Trend Changed to Bearish” with “Once Per Bar Close” for reliable signals.
🟡 Settings (Inputs)
➤ The indicator offers customizable settings to fit your trading style, but it's already optimized for Scalping (1m–15m), Balanced (16m–3h59m), and Swing (4h–Daily) modes, which automatically adjust based on the selected timeframe. The visible inputs allow you to adjust the following parameters:
Show Info Panel: Enables/disables the information panel (default: enabled).
Show Volume Spikes: Turns on/off coloring for volume spike bars (default: enabled).
Spike Sensitivity: Controls the Z-Score threshold for detecting volume spikes (default: 2.0; lower values increase signal frequency).
Show Divergence: Enables/disables the display of divergence labels (default: enabled).
Divergence Sensitivity: Adjusts the thresholds for divergence detection (default: 1.0; higher values reduce sensitivity).
Divergence Lookback Length: Sets the length of the moving averages used for divergences (default: 5, automatically adjusted to 13/10/5 for Scalping/Balanced/Swing).
RVOL Reference Period: Defines the reference period for relative volume (default: 20, automatically adjusted to 7/15/20).
RSI Length: Sets the RSI length (default: 14, automatically adjusted to 5/10/14).
Buy Sensitivity: Controls the increase threshold for Buying Pressure signals (default: 0.007; higher values reduce frequency).
Sell Sensitivity: Controls the decrease threshold for Selling Pressure signals (default: 0.007; higher values reduce frequency).
Volume Multiplier (B/S Pressure): Adjusts the volume threshold for Smart Flow signals (default: 0.6; higher values require greater volume).
🟡 This indicator is created to simplify market analysis, but I am not a professional in Pine Script or technical indicators. This indicator is not a standalone solution. For optimal results, it must be integrated into a well-defined trading strategy that includes risk management and other confirmations.

Langlands-Operadic Möbius Vortex (LOMV)Langlands-Operadic Möbius Vortex (LOMV)
Where Pure Mathematics Meets Market Reality
A Revolutionary Synthesis of Number Theory, Category Theory, and Market Dynamics
🎓 THEORETICAL FOUNDATION
The Langlands-Operadic Möbius Vortex represents a groundbreaking fusion of three profound mathematical frameworks that have never before been combined for market analysis:
The Langlands Program: Harmonic Analysis in Markets
Developed by Robert Langlands (Fields Medal recipient), the Langlands Program creates bridges between number theory, algebraic geometry, and harmonic analysis. In our indicator:
L-Function Implementation:
- Utilizes the Möbius function μ(n) for weighted price analysis
- Applies Riemann zeta function convergence principles
- Calculates quantum harmonic resonance between -2 and +2
- Measures deep mathematical patterns invisible to traditional analysis
The L-Function core calculation employs:
L_sum = Σ(return_val × μ(n) × n^(-s))
Where s is the critical strip parameter (0.5-2.5), controlling mathematical precision and signal smoothness.
Operadic Composition Theory: Multi-Strategy Democracy
Category theory and operads provide the mathematical framework for composing multiple trading strategies into a unified signal. This isn't simple averaging - it's mathematical composition using:
Strategy Composition Arity (2-5 strategies):
- Momentum analysis via RSI transformation
- Mean reversion through Bollinger Band mathematics
- Order Flow Polarity Index (revolutionary T3-smoothed volume analysis)
- Trend detection using Directional Movement
- Higher timeframe momentum confirmation
Agreement Threshold System: Democratic voting where strategies must reach consensus before signal generation. This prevents false signals during market uncertainty.
Möbius Function: Number Theory in Action
The Möbius function μ(n) forms the mathematical backbone:
- μ(n) = 1 if n is a square-free positive integer with even number of prime factors
- μ(n) = -1 if n is a square-free positive integer with odd number of prime factors
- μ(n) = 0 if n has a squared prime factor
This creates oscillating weights that reveal hidden market periodicities and harmonic structures.
🔧 COMPREHENSIVE INPUT SYSTEM
Langlands Program Parameters
Modular Level N (5-50, default 30):
Primary lookback for quantum harmonic analysis. Optimized by timeframe:
- Scalping (1-5min): 15-25
- Day Trading (15min-1H): 25-35
- Swing Trading (4H-1D): 35-50
- Asset-specific: Crypto 15-25, Stocks 30-40, Forex 35-45
L-Function Critical Strip (0.5-2.5, default 1.5):
Controls Riemann zeta convergence precision:
- Higher values: More stable, smoother signals
- Lower values: More reactive, catches quick moves
- High frequency: 0.8-1.2, Medium: 1.3-1.7, Low: 1.8-2.3
Frobenius Trace Period (5-50, default 21):
Galois representation lookback for price-volume correlation:
- Measures harmonic relationships in market flows
- Scalping: 8-15, Day Trading: 18-25, Swing: 25-40
HTF Multi-Scale Analysis:
Higher timeframe context prevents trading against major trends:
- Provides market bias and filters signals
- Improves win rates by 15-25% through trend alignment
Operadic Composition Parameters
Strategy Composition Arity (2-5, default 4):
Number of algorithms composed for final signal:
- Conservative: 4-5 strategies (higher confidence)
- Moderate: 3-4 strategies (balanced approach)
- Aggressive: 2-3 strategies (more frequent signals)
Category Agreement Threshold (2-5, default 3):
Democratic voting minimum for signal generation:
- Higher agreement: Fewer but higher quality signals
- Lower agreement: More signals, potential false positives
Swiss-Cheese Mixing (0.1-0.5, default 0.382):
Golden ratio φ⁻¹ based blending of trend factors:
- 0.382 is φ⁻¹, optimal for natural market fractals
- Higher values: Stronger trend following
- Lower values: More contrarian signals
OFPI Configuration:
- OFPI Length (5-30, default 14): Order Flow calculation period
- T3 Smoothing (3-10, default 5): Advanced exponential smoothing
- T3 Volume Factor (0.5-1.0, default 0.7): Smoothing aggressiveness control
Unified Scoring System
Component Weights (sum ≈ 1.0):
- L-Function Weight (0.1-0.5, default 0.3): Mathematical harmony emphasis
- Galois Rank Weight (0.1-0.5, default 0.2): Market structure complexity
- Operadic Weight (0.1-0.5, default 0.3): Multi-strategy consensus
- Correspondence Weight (0.1-0.5, default 0.2): Theory-practice alignment
Signal Threshold (0.5-10.0, default 5.0):
Quality filter producing:
- 8.0+: EXCEPTIONAL signals only
- 6.0-7.9: STRONG signals
- 4.0-5.9: MODERATE signals
- 2.0-3.9: WEAK signals
🎨 ADVANCED VISUAL SYSTEM
Multi-Dimensional Quantum Aura Bands
Five-layer resonance field showing market energy:
- Colors: Theme-matched gradients (Quantum purple, Holographic cyan, etc.)
- Expansion: Dynamic based on score intensity and volatility
- Function: Multi-timeframe support/resistance zones
Morphism Flow Portals
Category theory visualization showing market topology:
- Green/Cyan Portals: Bullish mathematical flow
- Red/Orange Portals: Bearish mathematical flow
- Size/Intensity: Proportional to signal strength
- Recursion Depth (1-8): Nested patterns for flow evolution
Fractal Grid System
Dynamic support/resistance with projected L-Scores:
- Multiple Timeframes: 10, 20, 30, 40, 50-period highs/lows
- Smart Spacing: Prevents level overlap using ATR-based minimum distance
- Projections: Estimated signal scores when price reaches levels
- Usage: Precise entry/exit timing with mathematical confirmation
Wick Pressure Analysis
Rejection level prediction using candle mathematics:
- Upper Wicks: Selling pressure zones (purple/red lines)
- Lower Wicks: Buying pressure zones (purple/green lines)
- Glow Intensity (1-8): Visual emphasis and line reach
- Application: Confluence with fractal grid creates high-probability zones
Regime Intensity Heatmap
Background coloring showing market energy:
- Black/Dark: Low activity, range-bound markets
- Purple Glow: Building momentum and trend development
- Bright Purple: High activity, strong directional moves
- Calculation: Combines trend, momentum, volatility, and score intensity
Six Professional Themes
- Quantum: Purple/violet for general trading and mathematical focus
- Holographic: Cyan/magenta optimized for cryptocurrency markets
- Crystalline: Blue/turquoise for conservative, stability-focused trading
- Plasma: Gold/magenta for high-energy volatility trading
- Cosmic Neon: Bright neon colors for maximum visibility and aggressive trading
📊 INSTITUTIONAL-GRADE DASHBOARD
Unified AI Score Section
- Total Score (-10 to +10): Primary decision metric
- >5: Strong bullish signals
- <-5: Strong bearish signals
- Quality ratings: EXCEPTIONAL > STRONG > MODERATE > WEAK
- Component Analysis: Individual L-Function, Galois, Operadic, and Correspondence contributions
Order Flow Analysis
Revolutionary OFPI integration:
- OFPI Value (-100% to +100%): Real buying vs selling pressure
- Visual Gauge: Horizontal bar chart showing flow intensity
- Momentum Status: SHIFTING, ACCELERATING, STRONG, MODERATE, or WEAK
- Trading Application: Flow shifts often precede major moves
Signal Performance Tracking
- Win Rate Monitoring: Real-time success percentage with emoji indicators
- Signal Count: Total signals generated for frequency analysis
- Current Position: LONG, SHORT, or NONE with P&L tracking
- Volatility Regime: HIGH, MEDIUM, or LOW classification
Market Structure Analysis
- Möbius Field Strength: Mathematical field oscillation intensity
- CHAOTIC: High complexity, use wider stops
- STRONG: Active field, normal position sizing
- MODERATE: Balanced conditions
- WEAK: Low activity, consider smaller positions
- HTF Trend: Higher timeframe bias (BULL/BEAR/NEUTRAL)
- Strategy Agreement: Multi-algorithm consensus level
Position Management
When in trades, displays:
- Entry Price: Original signal price
- Current P&L: Real-time percentage with risk level assessment
- Duration: Bars in trade for timing analysis
- Risk Level: HIGH/MEDIUM/LOW based on current exposure
🚀 SIGNAL GENERATION LOGIC
Balanced Long/Short Architecture
The indicator generates signals through multiple convergent pathways:
Long Entry Conditions:
- Score threshold breach with algorithmic agreement
- Strong bullish order flow (OFPI > 0.15) with positive composite signal
- Bullish pattern recognition with mathematical confirmation
- HTF trend alignment with momentum shifting
- Extreme bullish OFPI (>0.3) with any positive score
Short Entry Conditions:
- Score threshold breach with bearish agreement
- Strong bearish order flow (OFPI < -0.15) with negative composite signal
- Bearish pattern recognition with mathematical confirmation
- HTF trend alignment with momentum shifting
- Extreme bearish OFPI (<-0.3) with any negative score
Exit Logic:
- Score deterioration below continuation threshold
- Signal quality degradation
- Opposing order flow acceleration
- 10-bar minimum between signals prevents overtrading
⚙️ OPTIMIZATION GUIDELINES
Asset-Specific Settings
Cryptocurrency Trading:
- Modular Level: 15-25 (capture volatility)
- L-Function Precision: 0.8-1.3 (reactive to price swings)
- OFPI Length: 10-20 (fast correlation shifts)
- Cascade Levels: 5-7, Theme: Holographic
Stock Index Trading:
- Modular Level: 25-35 (balanced trending)
- L-Function Precision: 1.5-1.8 (stable patterns)
- OFPI Length: 14-20 (standard correlation)
- Cascade Levels: 4-5, Theme: Quantum
Forex Trading:
- Modular Level: 35-45 (smooth trends)
- L-Function Precision: 1.6-2.1 (high smoothing)
- OFPI Length: 18-25 (disable volume amplification)
- Cascade Levels: 3-4, Theme: Crystalline
Timeframe Optimization
Scalping (1-5 minute charts):
- Reduce all lookback parameters by 30-40%
- Increase L-Function precision for noise reduction
- Enable all visual elements for maximum information
- Use Small dashboard to save screen space
Day Trading (15 minute - 1 hour):
- Use default parameters as starting point
- Adjust based on market volatility
- Normal dashboard provides optimal information density
- Focus on OFPI momentum shifts for entries
Swing Trading (4 hour - Daily):
- Increase lookback parameters by 30-50%
- Higher L-Function precision for stability
- Large dashboard for comprehensive analysis
- Emphasize HTF trend alignment
🏆 ADVANCED TRADING STRATEGIES
The Mathematical Confluence Method
1. Wait for Fractal Grid level approach
2. Confirm with projected L-Score > threshold
3. Verify OFPI alignment with direction
4. Enter on portal signal with quality ≥ STRONG
5. Exit on score deterioration or opposing flow
The Regime Trading System
1. Monitor Aether Flow background intensity
2. Trade aggressively during bright purple periods
3. Reduce position size during dark periods
4. Use Möbius Field strength for stop placement
5. Align with HTF trend for maximum probability
The OFPI Momentum Strategy
1. Watch for momentum shifting detection
2. Confirm with accelerating flow in direction
3. Enter on immediate portal signal
4. Scale out at Fibonacci levels
5. Exit on flow deceleration or reversal
⚠️ RISK MANAGEMENT INTEGRATION
Mathematical Position Sizing
- Use Galois Rank for volatility-adjusted sizing
- Möbius Field strength determines stop width
- Fractal Dimension guides maximum exposure
- OFPI momentum affects entry timing
Signal Quality Filtering
- Trade only STRONG or EXCEPTIONAL quality signals
- Increase position size with higher agreement levels
- Reduce risk during CHAOTIC Möbius field periods
- Respect HTF trend alignment for directional bias
🔬 DEVELOPMENT JOURNEY
Creating the LOMV was an extraordinary mathematical undertaking that pushed the boundaries of what's possible in technical analysis. This indicator almost didn't happen. The theoretical complexity nearly proved insurmountable.
The Mathematical Challenge
Implementing the Langlands Program required deep research into:
- Number theory and the Möbius function
- Riemann zeta function convergence properties
- L-function analytical continuation
- Galois representations in finite fields
The mathematical literature spans decades of pure mathematics research, requiring translation from abstract theory to practical market application.
The Computational Complexity
Operadic composition theory demanded:
- Category theory implementation in Pine Script
- Multi-dimensional array management for strategy composition
- Real-time democratic voting algorithms
- Performance optimization for complex calculations
The Integration Breakthrough
Bringing together three disparate mathematical frameworks required:
- Novel approaches to signal weighting and combination
- Revolutionary Order Flow Polarity Index development
- Advanced T3 smoothing implementation
- Balanced signal generation preventing directional bias
Months of intensive research culminated in breakthrough moments when the mathematics finally aligned with market reality. The result is an indicator that reveals market structure invisible to conventional analysis while maintaining practical trading utility.
🎯 PRACTICAL IMPLEMENTATION
Getting Started
1. Apply indicator with default settings
2. Select appropriate theme for your markets
3. Observe dashboard metrics during different market conditions
4. Practice signal identification without trading
5. Gradually adjust parameters based on observations
Signal Confirmation Process
- Never trade on score alone - verify quality rating
- Confirm OFPI alignment with intended direction
- Check fractal grid level proximity for timing
- Ensure Möbius field strength supports position size
- Validate against HTF trend for bias confirmation
Performance Monitoring
- Track win rate in dashboard for strategy assessment
- Monitor component contributions for optimization
- Adjust threshold based on desired signal frequency
- Document performance across different market regimes
🌟 UNIQUE INNOVATIONS
1. First Integration of Langlands Program mathematics with practical trading
2. Revolutionary OFPI with T3 smoothing and momentum detection
3. Operadic Composition using category theory for signal democracy
4. Dynamic Fractal Grid with projected L-Score calculations
5. Multi-Dimensional Visualization through morphism flow portals
6. Regime-Adaptive Background showing market energy intensity
7. Balanced Signal Generation preventing directional bias
8. Professional Dashboard with institutional-grade metrics
📚 EDUCATIONAL VALUE
The LOMV serves as both a practical trading tool and an educational gateway to advanced mathematics. Traders gain exposure to:
- Pure mathematics applications in markets
- Category theory and operadic composition
- Number theory through Möbius function implementation
- Harmonic analysis via L-function calculations
- Advanced signal processing through T3 smoothing
⚖️ RESPONSIBLE USAGE
This indicator represents advanced mathematical research applied to market analysis. While the underlying mathematics are rigorously implemented, markets remain inherently unpredictable.
Key Principles:
- Use as part of comprehensive trading strategy
- Implement proper risk management at all times
- Backtest thoroughly before live implementation
- Understand that past performance does not guarantee future results
- Never risk more than you can afford to lose
The mathematics reveal deep market structure, but successful trading requires discipline, patience, and sound risk management beyond any indicator.
🔮 CONCLUSION
The Langlands-Operadic Möbius Vortex represents a quantum leap forward in technical analysis, bringing PhD-level pure mathematics to practical trading while maintaining visual elegance and usability.
From the harmonic analysis of the Langlands Program to the democratic composition of operadic theory, from the number-theoretic precision of the Möbius function to the revolutionary Order Flow Polarity Index, every component works in mathematical harmony to reveal the hidden order within market chaos.
This is more than an indicator - it's a mathematical lens that transforms how you see and understand market structure.
Trade with mathematical precision. Trade with the LOMV.
*"Mathematics is the language with which God has written the universe." - Galileo Galilei*
*In markets, as in nature, profound mathematical beauty underlies apparent chaos. The LOMV reveals this hidden order.*
— Dskyz, Trade with insight. Trade with anticipation.
