Combine & Merge Candlesticks + EMACombine & Merge Candlesticks with EMA
You can do the following:-
1 min - look back 5 (5 min) up to 15 (15 min)
5 min - look back 3 (15 min) up to 12 (1 hour)
15 min - look back 4 (1 hour) up to 16 ( 4 hours)
1 hour - look back 4 (4 hours) up to 8 (8 hours - 1 trading session)
4 hour - look back 2 (8 hours - 1 trading session) up to 6 ( 1 Day)
1 day - look back 5 ( 1 week)
Recherche dans les scripts pour "机械革命无界15+时不时闪屏"

TradingGroundhog - Strategy & Wavetrend V2#-- Public Strategy - No Repaint - Fractals - Wavetrend --
Here I come with another script, a nice and simple strategy based on fractals and Wavetrends.
#-- Synopsis --
A simple idea, on a small time frame (15 min) we buy when the opening price goes below a Bottom fractals and sell when it goes over a Top fractals, but in order to avoid bad and evil downtrends, we use Wavetrends based on a Daily time frame. From it, Tops and Bottoms are extracted. If the opening price goes above Wavetrend Tops, no trades will be conducted during the day. If the price goes below Wavetrend bottoms, no trades will be executed from 1 to N days, until a new Wavetrend bottom is generated.
I developed the strategy using BTC /EUR 15 MIN BINANCE but it can be applied to many other cryptos, I don't know for forex or others. You can use it for long term and automated trading, I implemented the Wavetrend indicator to do so, or for short term if you have spot a long coming uptrend. Test it, look at its profit and long or short period on your crypto of choice.
#-- Graph reading --
And now, how to read it ?
Wavetrends:
Red Backgrounds are associated to No Trade periods. These periods occur when the price goes below a Wavetrend bottom or above a Wavetrend Top. They are here to limit the loss.
Blue Gradient lines represent the past Tops. For each bar, only the increasing values of the Wavetrend tops are acquired. Going from light to dark blue based on the age of the Tops. Thus, if on line goes from dark to light, this means the price is approaching a previous Wavetrend top. In the opposite, if it darken, thus the price say 'buy buy' and go dropping.
Yellow Gradient lines represent the past Bottoms. They are based on the same principe that the blue lines.
Fractals:
Yellow Flags occur when the opening price goes below a Bottom fractal , it means Buy.
White Flags appear when the opening price goes over a Top fractal , it means Sell.
#-- Parameters --
*** Parameters have been intensively optimized using 10 cryptocurrency markets in order to have potent efficiency for each of them. I would recommend to only change the Can Be touch parameter. For the others, I don't recommend any modifications. The idea behind the script is to be able to switch between markets without having to optimize parameters, less work, easy to target active crypto and therefor limit the risks. ***
Can be touch :
'Combined Smoothness' : The number of open individuals used by the Wavetrend. (6 or 9, often 9 is better but with less volatile crypto it will be 6)
'Filter fractals' : Activate or Disable the filtering fractal operation. If Enable, buy during less risky periods. (Disable is often better)
Can be touch but not necessary :
'VolumeMA' : The Volume corrector used by the fractals
'Extreme window' : The number of price individuals to look for if we want to remove extreme fractals.
Not to touch :
'Limit_candle to look on' : Number of candles to use to compute the Wavetrend Tops and Bottoms.
'Length top bottom drawn' : Size of the lines
'Long Sop Loss (%)' : The minimal difference of price between a Fractal bottom and the opening price to buy.
#-- Time frame --
Should be used with the following time frames depending on the necessity:
1 MIN
3 MIN (Interesting for short term profit, may need some parameter ajustements)
5 MIN
15 MIN (Preferred for long term profit, the script was developed on it)
#-- Last words --
The script can be set up to send Tradingview signals to 3comma just by adding comment = " " in strategy.close_all() and strategy.entry().
Good trades !
Disclaimer (As it should always be one to any script)
***
This script is intended for and only to be used for personal purposes only. No such information provided by it constitutes advice or a recommendation for any investment or trading strategy for any specific person. There is no guarantee presented or implied as to the accuracy of specific forecasts, projections, or predictive statements offered by the script. Users of the script agree that its original developer does not take responsibility for any of your investment decisions. Please seek professional advice before trading.
***
# Here are the results from the 1rst of July 2021 with 100% of equity on the BTC /EUR 15 Min and with a capital of 1 000 EUR.
# As I saw, it goes from +20% to more than +100% depending on the selected crypto. Sometimes it's negative but it's quite rare on crypto using the EUR.

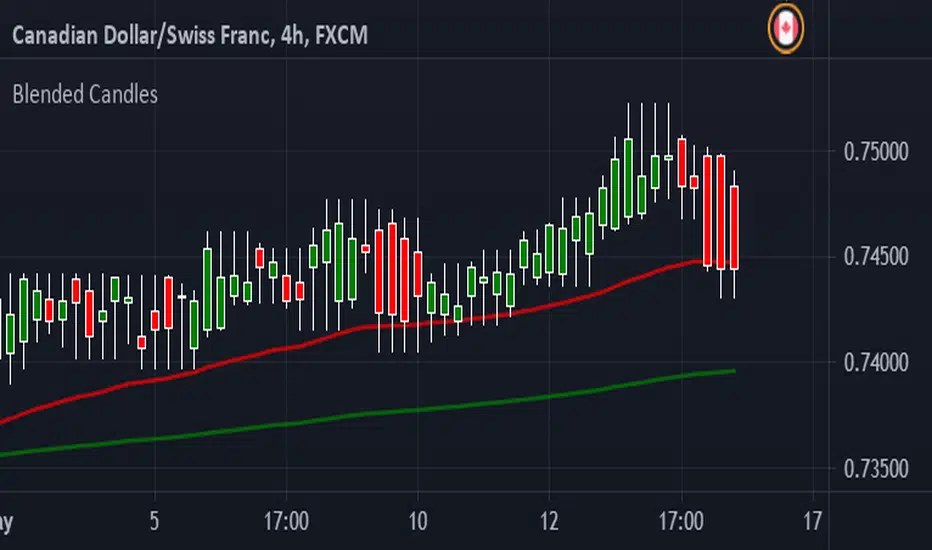
Blended CandlesHave been looking at YouTube and found a few videos about Blended Candles. Couldn't find a script here so I decided to script something myself.
I have also added a couple of EMA's, saves having to put them in individually.
You can Look Back as far back as you want but I find that each time frame looks better if you keep it to multiple of the next
IE : 1 min - look back 5 (5 min) up to 15 (15 min)
5 min - look back 3 (15 min) up to 12 (1 hour)
15 min - look back 4 (1 hour) up to 16 ( 4 hours)
1 hour - look back 4 (4 hours) up to 8 (8 hours - 1 trading session)
4 hour - look back 2 (8 hours - 1 trading session) up to 6 ( 1 Day)
1 day - look back 5 ( 1 week)
Shooting stars, Hammers and Doji's are very easy to recognize
Long wicks on top - Bearish
Long wick on bottom - Bullish
Support and Resistance is easier to spot as well :-)
Hope this helps someone - defiantly helps me time entries
Comments welcome and Happy Trading
VPoC per barThis study prints the current bar VPoC as an horizontal line.
It's aimed originally at BTCUSDT pair and 15m timeframe.
HOW IT WORKS
Zoom In mode: This is the default mode.
The study zooms in into the latest 15 1-minute bar candles in order to calculate the 15 minute candle VPoC.
Zoom Out mode: The VPoC from the last n bars from the current timeframe that match desired timeframe is shown on each bar.
In either case you are recommended to click on the '...' button associated to this study
and select 'Visual Order. Bring to Front.' so that it's properly shown in your chart.
HOW IT WORKS - Zoom In mode
Make sure that '(VP) Zoom into the VP timeframe' setting is set to true.
Choose the zoomed in timeframe where to calculate VPoC from thanks to the '(VP) Zoomed timeframe {1 minute}' setting.
Change '(VP) Zoomed in timeframe bars per current timeframe bar {15}' to its appropiated value. You just need to divide the current timeframe minutes per the zoomed in timeframe minutes per bar. E.g. If you are in 60 minute timeframe and you want to zoom in into 5 minute timeframe: 60 / 5 = 12 . You will write 12 here.
HOW IT WORKS - Zoom Out mode
Make sure that '(VP) Zoom into the VP timeframe' setting is set to false.
If you are using the Zoom out mode you might want to set '(VP) Print VPoC price as discrete lines {True}' to false.
Either choose the zoommed out timeframe where to calculate VPoC from thanks to the '(VP) Zoomed timeframe {1 minute}' setting or turn on the '(VP) Use number of bars (not VP timeframe)' setting in order to use '(VP) Number of bars {100}' as a custom number of bars.
WARNING - Zoom In mode last bar
The way that PineScript handles security function in last bar might result on the last bar not being accurate enough.
SETTINGS
__ SETTINGS - Volume Profile
(VP) Zoomed timeframe {1 minute}: Timeframe in which to zoom in or zoom out to calculate an accurate VPoC for the current timeframe.
(VP) Zoomed in timeframe bars per current timeframe bar {15}: Check 'HOW IT WORKS - Zoom In mode' above. Note : It is only used in 'Zoom in' mode.
(VP) Number of bars {100}: If 'Use number of bars (not VP timeframe)' is turned on this setting is used to calculate session VPoC. Note : It is only used in 'Zoom out' mode.
(VP) Price levels {24}: Price levels for calculating VPoC.
__ SETTINGS - MAIN TURN ON/OFF OPTIONS
(VP) Print VPoC price {True}: Show VPoC price
(VP) Zoom into the VP timeframe: When set to true the VPoC is calculated by zooming into the lower timeframe. When set to false a higher timeframe (or number of bars) is used.
(VP) Realtime Zoom in (Beta): Enable real time zoom for the last bar. It's beta because it would only work with zoomed in timeframe under 60 minutes. And when ratio between zoomout and zoomin is less than 60. Note : It is only used in 'Zoom in' mode.
(VP) Use number of bars (not VP timeframe): Uses 'Number of bars {100}' setting instead of 'Volume Profile timeframe' setting for calculating session VPoC. Note : It is only used in 'Zoom out' mode.
(VP) Print VPoC price as discrete lines {True}: When set to true the VPoC is shown as an small line in the center of each bar. When set to the false the VPoC line is printed as a normal line.
__ SETTINGS - EXTRA
(VP) VPoC color: Change the VPoC color
(VP) VPoC line width {1}: Change VPoC line width (in pixels).
(VP) Use number of bars (not VP timeframe): Uses 'Number of bars {100}' setting instead of 'Volume Profile timeframe' setting for calculating session VPoC. Note : It is only used in 'Zoom out' mode.
(VP) Print VPoC price as discrete lines {True}: When set to true the VPoC is shown as an small line in the center of each bar. When set to the false the VPoC line is printed as a normal line.
CREDITS
I have reused and adapted some code from
"Poor man's volume profile" study
which it's from TradingView IldarAkhmetgaleev user.

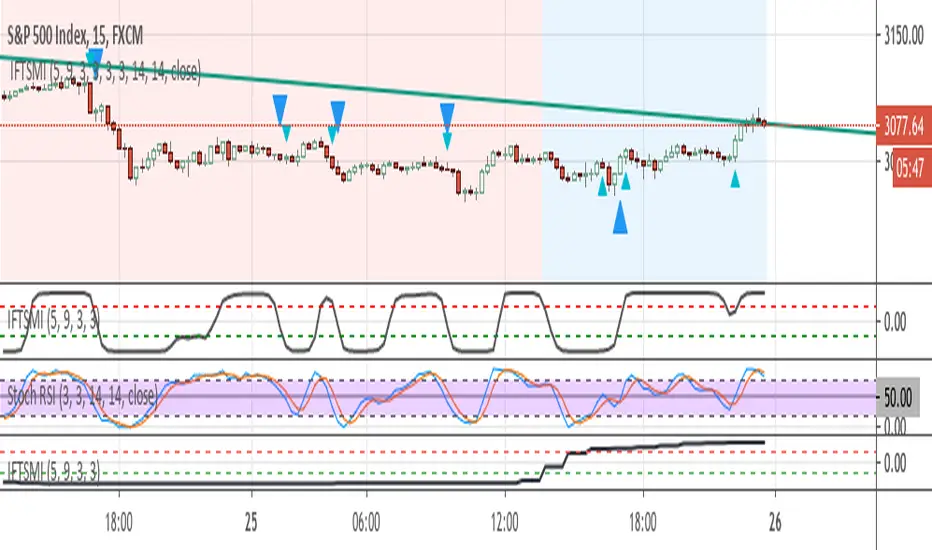
Inverse Fisher Transform of SMI and sto. RSI, MTF confirmedThe system uses 1 hour and 15 min timeframe data. Signals coming from 15 min Inverse Fisher Transform of SMI and stochastic RSI are confirmed by 1 hour Inverse Fisher Transform SMI, according to the following rules:
long cond.: 15 min IFTSMI crosses ABOVE -0.5 or SRSI k-line crosses ABOVE 50 while 1-hour IFTSMI is already ABOVE -0.5
short cond.:15 min IFTSMI crosses BELOW 0.5 or SRSI k-line crosses BELOW 50 while 1-hour IFTSMI is already BELOW 0.5
SMI and Inverse Fisher Transform of SMI codes belong to @kivancozbilgic.
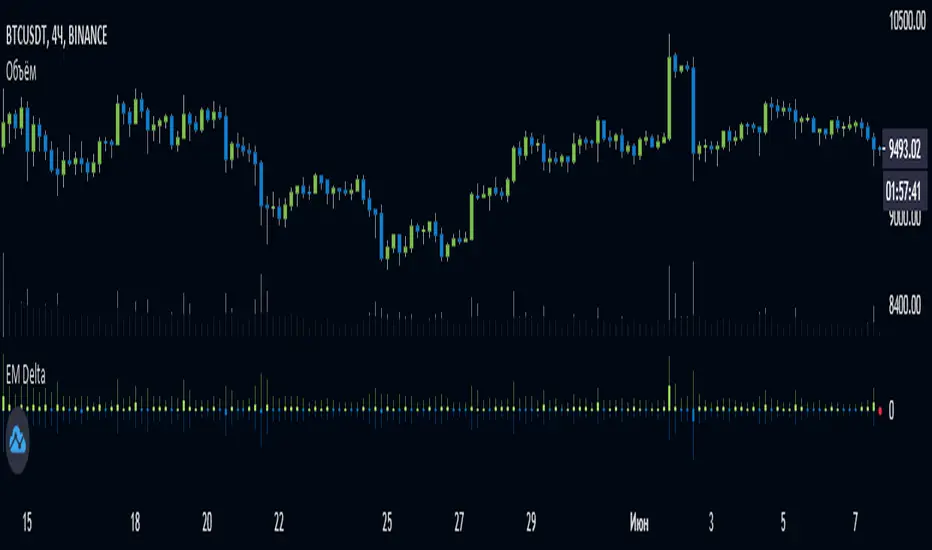
EulerMethod: DeltaEN
Shows the Integral Volume Delta (IVD)
It is a detailed OBV. Each bar sums up the volume for bars of a shorter timeframe.
For example, inside a 1M bar, every 12h bar is added up, and inside a 1h bar, every 1min bar is added. Thus, a conditional volume delta inside the bar is obtained.
The indicator for each bar shows the volume of purchases (positive), sales (negative) and the difference — IVD
The delta histogram is thicker than the volume histograms
Settings detalisation
M — 6 hours, 12 hours and 1 day for the M timeframe (720 by default)
W — 4 hours, 6 hours and 12 hours for the W timeframe (240 by default)
D — 30 minutes, 1 hour and 2 hours for the D timeframe (60 by default)
H — 1 minute, 5 minutes and 15 minutes for timeframes [1h, D) (default is 1)
For timeframes of 15m and less, the calculation is carried out by minute bars
VSA mode
The classic OBV adds volume to the cumulative sum under the condition Сlose (n) > Close (n-1) and subtracts it under the condition Close (n) < Close (n-1)
When VSA mode is disabled, all volumes are summed up under these conditions.
When the VSA approximation is turned on, the volume per bar of detail is divided by the factor (Close - Low) / (High - Low)
That is, it takes into account the spread per bar and closing relative to the spread. VSA is enabled by default
A/D mode
Shows the cumulative Accumulation / Distribution Index
The delta of the detail bar is multiplied by (High + Low + Close) / 3 bars, the result is added to the cumulative sum
No additional price conversions required due to integral summation
Index line view is customizable
EM Delta does not receive intermediate values in real time.
To see the result, wait until the bar closes or switch to a smaller timeframe
RU
Показывает Интегральную Дельту Объёма (ИДО)
Представляет собой детализированный OBV. В каждом баре суммируется объём за бары меньшего таймфрейма.
Например, внутри 1М-бара суммируется каждый 12h-бар, а внутри 1h — каждый 1m-бар. Таким образом получается условная дельта объёма внутри бара
Индикатор на каждый бар показывает объём покупок (положительный), объём продаж (отрицательный) и разницу — ИДО
Гистограмма дельты толще гистограмм объёмов
Настройки детализации внутри бара
M — 6 часов, 12 часов и 1 день для таймфрейма M (по-умолчанию 720)
W — 4 часа, 6 часов и 12 часов для таймфрейма W (по-умолчанию 240)
D — 30 минут, 1 час и 2 часа для таймфрейма D (по-умолчанию 60)
H — 1 минута, 5 минут и 15 минут для таймфреймов [1h, D) (по-умолчанию 1)
Для таймфреймов 15m и меньше расчёт ведётся по минутным барам
Режим VSA
Классический OBV прибавляет объём к кумулятивной сумме при условии Сlose(n) > Close(n-1) и отнимает при условии Close(n) < Close(n-1)
При отключении режима VSA все объёмы суммируются по этим условиям
При включённой VSA-аппроксимации объём за бар детализации делится по фактору (Close - Low) / (High - Low)
То есть учитывает спред за бар и закрытие относительно спреда. По-умолчанию режим VSA включен
Режим A/D
Показывает кумулятивный индекс Накопления/Распределения
Дельта бара детализации умножается на (High + Low + Close) / 3 бара, результат прибавляется к кумулятивной сумме
Дополнительные преобразования цены не требуются ввиду интегрального суммирования
Вид линии индекса настраивается
EM Delta не получает промежуточные значения в реальном времени.
Чтобы увидеть результат, дождитесь закрытия бара или перейдите на меньший таймфрейм
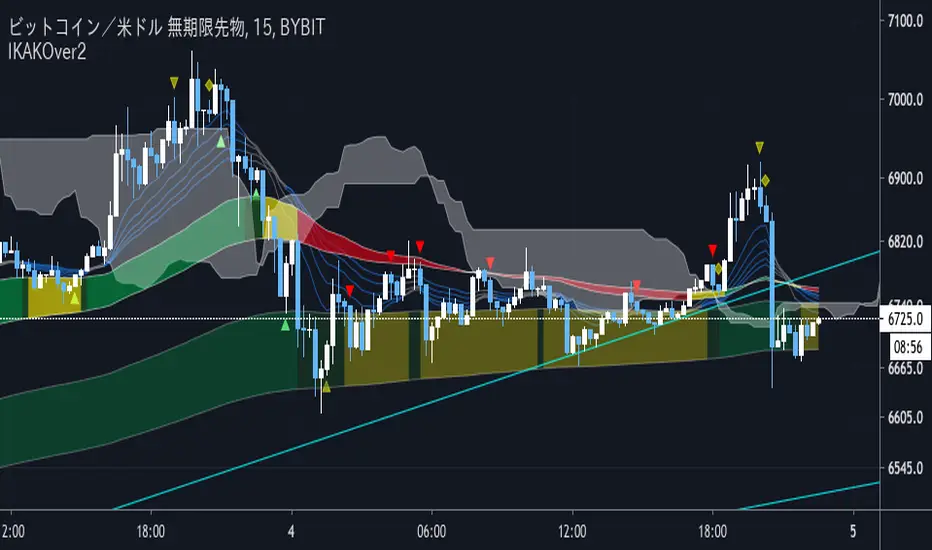
IKAKOver2(LITE雲なし)
change point
I tried to make the operation lighter by removing the display of the Ichimoku balance table.
We have set a period such as EMA to use 5 minute bars and the first band is period 60 and 100 EMA . The color of the belt changes according to the position of the period 5EMA-25EMA-50EMA. The second sash is based on a 60- and 100-EMA period of 15 minutes. The change in the color of the obi is also a 15-minute specification.
Since the above period can be changed, I think that there are customs such as 1 hour and 4 hours.
Buying and selling signs are shown in green for buying and red for selling. (More frequent)
For the time being, it is also possible to display the Ichimoku balance table.
As for my usage method, when both the 15-minute and 5-minute bars have an uptrend (downtrend ), when each trading sign is confirmed, spread the limit just below the price. . (Because there is a commission in the market)
If the color of the obi becomes yellow, the trend may be over, so wait for the signature to reach the bundle of 15 minutes instead of 5 minutes, and after the signature is confirmed, it is the same as 5 minutes.
The loss cut line is often the latest low. Or when the obi is broken. .
I am still studying about profitability. Sometimes we use indicators, sometimes we reach the target horizon. I think each way is good.
It is a discretionary aid, and the head and tail are cut off, and the image is about 10 to 100 $.
IKAKOver2change point
Improve the accuracy of reverse sign
Adding a signature using only RCI
変更点
逆張りのサインと順張りのサインを区別し、逆張りのサインは騙しができるだけ少なくなるように精度を上げました。
逆張りか順張りかは10emaと100emaの位置関係だけで区別しています。
また、RCIのみを利用した、レンジ相場用のサインを追加しました。
We have set a period such as EMA to use 5 minute bars and the first band is period 60 and 100 EMA . The color of the belt changes according to the position of the period 5EMA-25EMA-50EMA. The second sash is based on a 60- and 100-EMA period of 15 minutes. The change in the color of the obi is also a 15-minute specification.
Since the above period can be changed, I think that there are customs such as 1 hour and 4 hours.
Buying and selling signs are shown in green for buying and red for selling. (More frequent)
For the time being, it is also possible to display the Ichimoku balance table.
As for my usage method, when both the 15-minute and 5-minute bars have an uptrend (downtrend ), when each trading sign is confirmed, spread the limit just below the price. . (Because there is a commission in the market)
If the color of the obi becomes yellow, the trend may be over, so wait for the signature to reach the bundle of 15 minutes instead of 5 minutes, and after the signature is confirmed, it is the same as 5 minutes.
The loss cut line is often the latest low. Or when the obi is broken. .
I am still studying about profitability. Sometimes we use indicators, sometimes we reach the target horizon. I think each way is good.
It is a discretionary aid, and the head and tail are cut off, and the image is about 10 to 100 $.
Price Action and 3 EMAs Momentum plus Sessions FilterThis indicator plots on the chart the parameters and signals of the Price Action and 3 EMAs Momentum plus Sessions Filter Algorithmic Strategy. The strategy trades based on time-series (absolute) and relative momentum of price close, highs, lows and 3 EMAs.
I am still learning PS and therefore I have only been able to write the indicator up to the Signal generation. I plan to expand the indicator to Entry Signals as well as the full Strategy.
The strategy works best on EURUSD in the 15 minutes TF during London and New York sessions with 1 to 1 TP and SL of 30 pips with lots resulting in 3% risk of the account per trade. I have already written the full strategy in another language and platform and back tested it for ten years and it was profitable for 7 of the 10 years with average profit of 15% p.a which can be easily increased by increasing risk per trade. I have been trading it live in that platform for over two years and it is profitable.
Contributions from experienced PS coders in completing the Indicator as well as writing the Strategy and back testing it on Trading View will be appreciated.
STRATEGY AND INDICATOR PARAMETERS
Three periods of 12, 48 and 96 in the 15 min TF which are equivalent to 3, 12 and 24 hours i.e (15 min * period / 60 min) are the foundational inputs for all the parameters of the PA & 3 EMAs Momentum + SF Algo Strategy and its Indicator.
3 EMAs momentum parameters and conditions
• FastEMA = ema of 12 periods
• MedEMA = ema of 48 periods
• SlowEMA = ema of 96 periods
• All the EMAs analyse price close for up to 96 (15 min periods) equivalent to 24 hours
• There’s Upward EMA momentum if price close > FastEMA and FastEMA > MedEMA and MedEMA > SlowEMA
• There’s Downward EMA momentum if price close < FastEMA and FastEMA < MedEMA and MedEMA < SlowEMA
PA momentum parameters and conditions
• HH = Highest High of 48 periods from 1st closed bar before current bar
• LL = Lowest Low of 48 periods from 1st closed bar from current bar
• Previous HH = Highest High of 84 periods from 12th closed bar before current bar
• Previous LL = Lowest Low of 84 periods from 12th closed bar before current bar
• All the HH & LL and prevHH & prevLL are within the 96 periods from the 1st closed bar before current bar and therefore indicative of momentum during the past 24 hours
• There’s Upward PA momentum if price close > HH and HH > prevHH and LL > prevLL
• There’s Downward PA momentum if price close < LL and LL < prevLL and HH < prevHH
Signal conditions and Status (BuySignal, SellSignal or Neutral)
• The strategy generates Buy or Sell Signals if both 3 EMAs and PA momentum conditions are met for each direction and these occur during the London and New York sessions
• BuySignal if price close > FastEMA and FastEMA > MedEMA and MedEMA > SlowEMA and price close > HH and HH > prevHH and LL > prevLL and timeinrange (LDN&NY) else Neutral
• SellSignal if price close < FastEMA and FastEMA < MedEMA and MedEMA < SlowEMA and price close < LL and LL < prevLL and HH < prevHH and timeinrange (LDN&NY) else Neutral
Entry conditions and Status (EnterBuy, EnterSell or Neutral)(NOT CODED YET)
• ENTRY IS NOT AT THE SIGNAL BAR but at the current bar tick price retracement to FastEMA after the signal
• EnterBuy if current bar tick price <= FastEMA and current bar tick price > prevHH at the time of the Buy Signal
• EnterSell if current bar tick price >= FastEMA and current bar tick price > prevLL at the time of the Sell Signal

IKAKOWe have set a period such as EMA to use 5 minute bars and the first band is period 60 and 100 EMA. The color of the belt changes according to the position of the period 5EMA-25EMA-50EMA. The second sash is based on a 60- and 100-EMA period of 15 minutes. The change in the color of the obi is also a 15-minute specification.
Since the above period can be changed, I think that there are customs such as 1 hour and 4 hours.
Buying and selling signs are shown in green for buying and red for selling. (More frequent)
For the time being, it is also possible to display the Ichimoku balance table.
As for my usage method, when both the 15-minute and 5-minute bars have an uptrend (downtrend ), when each trading sign is confirmed, spread the limit just below the price. . (Because there is a commission in the market)
If the color of the obi becomes yellow, the trend may be over, so wait for the signature to reach the bundle of 15 minutes instead of 5 minutes, and after the signature is confirmed, it is the same as 5 minutes.
The loss cut line is often the latest low. Or when the obi is broken. .
I am still studying about profitability. Sometimes we use indicators, sometimes we reach the target horizon. I think each way is good.
It is a discretionary aid, and the head and tail are cut off, and the image is about 10 to 100 $.

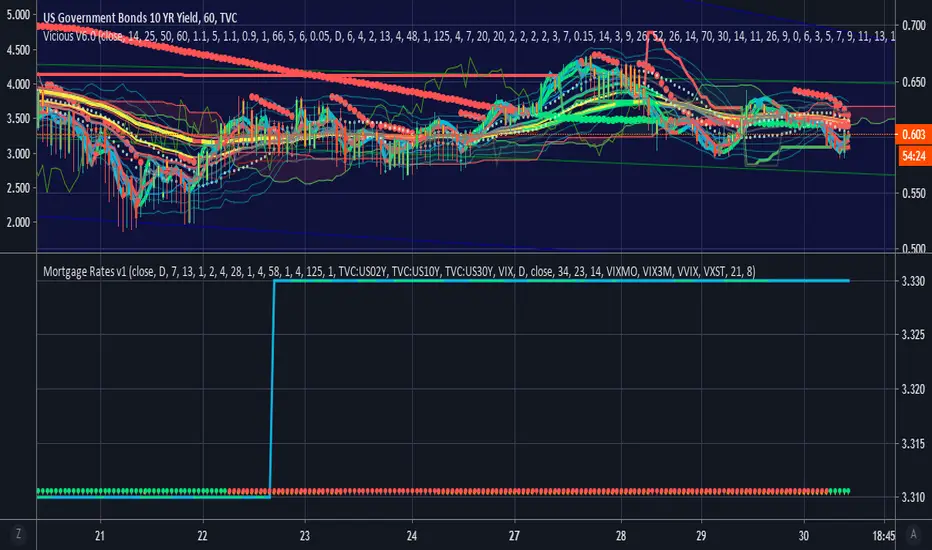
Vicious Mortgage Rates V1.0A script that contains real time mortgage rates from Wells Fargo using the QUANDL data link.
Use this lower indicator with US10Y or others on the top.
VIX will be added as well to help inform and predict.
List of Available Mortgage Interest Rates including APR or IR (Interest Rate)
*NOTE* : Not all indicators are up and running yet but will be very soon.
INDICATOR|CODE
Purchase Rate Conforming Loan 30-Year Fixed Rate Interest Rate|PR_CON_30YFIXED_IR
Purchase Rate Conforming Loan 30-Year Fixed Rate APR|PR_CON_30YFIXED_APR
Purchase Rate Government Loan 30-Year Fixed-Rate FHA Interest Rate|PR_GOV_30YFIXEDFHA_IR
Purchase Rate Government Loan 30-Year Fixed-Rate FHA APR|PR_GOV_30YFIXEDFHA_APR
Purchase Rate Conforming Loan 15-Year Fixed Rate Interest Rate|PR_CON_15YFIXED_IR
Purchase Rate Conforming Loan 15-Year Fixed Rate APR|PR_CON_15YFIXED_APR
*Purchase Rate Conforming Loan 7/1 ARM Interest Rate|PR_CON_71ARM_IR
*Purchase Rate Conforming Loan 7/1 ARM APR|PR_CON_71ARM_APR
*Purchase Rate Conforming Loan 5/1 ARM FHA Interest Rate|PR_CON_51ARM_IR
*Purchase Rate Conforming Loan 5/1 ARM FHA APR|PR_CON_51ARM_APR
Purchase Rate Government Loan 5/1 ARM FHA Interest Rate|PR_GOV_51ARMFHA_IR
Purchase Rate Government Loan 5/1 ARM FHA APR|PR_GOV_51ARMFHA_APR
Purchase Rate Larger Loan Amounts in Eligible Areas (Conforming Loan) 30-Year Fixed Rate Interest Rate|PR_LARGERCON_30YFIXED_IR
Purchase Rate Larger Loan Amounts in Eligible Areas (Conforming Loan) 30-Year Fixed Rate APR|PR_LARGERCON_30YFIXED_APR
Purchase Rate Larger Loan Amounts in Eligible Areas (Government Loan) 30-Year Fixed-Rate FHA Interest Rate|PR_LARGERGOV_30YFIXEDFHA_IR
Purchase Rate Larger Loan Amounts in Eligible Areas (Government Loan) 30-Year Fixed-Rate FHA APR|PR_LARGERGOV_30YFIXEDFHA_APR
Purchase Rate Larger Loan Amounts in Eligible Areas (Conforming Loan) 7/1 ARM Interest Rate|PR_LARGERCON_71ARM_IR
Purchase Rate Larger Loan Amounts in Eligible Areas (Conforming Loan) 7/1 ARM APR|PR_LARGERCON_71ARM_APR
Purchase Rate Jumbo Loan (Amounts that exceed conforming loan limits) 30-Year Fixed Rate Interest Rate|PR_JUMBO_30YFIXED_IR
Purchase Rate Jumbo Loan (Amounts that exceed conforming loan limits) 30-Year Fixed Rate APR|PR_JUMBO_30YFIXED_APR
Purchase Rate Jumbo Loan (Amounts that exceed conforming loan limits) 7/1 ARM Interest Rate|PR_JUMBO_71ARM_IR
Purchase Rate Jumbo Loan (Amounts that exceed conforming loan limits) 7/1 ARM APR|PR_JUMBO_71ARM_APR
Refinance Rate Conforming Loan 30-Year Fixed Rate Interest Rate|RR_CON_30YFIXED_IR
Refinance Rate Conforming Loan 30-Year Fixed Rate APR|RR_CON_30YFIXED_APR
Refinance Rate Government Loan 30-Year Fixed-Rate FHA Interest Rate|RR_GOV_30YFIXEDFHA_IR
Refinance Rate Government Loan 30-Year Fixed-Rate FHA APR|RR_GOV_30YFIXEDFHA_APR
Refinance Rate Conforming Loan 15-Year Fixed Rate Interest Rate|RR_CON_15YFIXED_IR
Refinance Rate Conforming Loan 15-Year Fixed Rate APR|RR_CON_15YFIXED_APR
*Refinance Rate Conforming Loan 7/1 ARM Interest Rate|RR_CON_71ARM_IR
*Refinance Rate Conforming Loan 7/1 ARM APR|RR_CON_71ARM_APR
*Refinance Rate Conforming Loan 5/1 ARM Interest Rate|PR_CON_51ARM_IR
*Refinance Rate Conforming Loan 5/1 ARM APR|PR_CON_51ARM_APR
Refinance Rate Government Loan 5/1 ARM FHA Interest Rate|RR_GOV_51ARMFHA_IR
Refinance Rate Government Loan 5/1 ARM FHA APR|RR_GOV_51ARMFHA_APR
Refinance Rate Larger Loan Amounts in Eligible Areas (Conforming Loan) 30-Year Fixed Rate Interest Rate|RR_LARGERCON_30YFIXED_IR
Refinance Rate Larger Loan Amounts in Eligible Areas (Conforming Loan) 30-Year Fixed Rate APR|RR_LARGERCON_30YFIXED_APR
Refinance Rate Larger Loan Amounts in Eligible Areas (Government Loan) 30-Year Fixed-Rate FHA Interest Rate|RR_LARGERGOV_30YFIXEDFHA_IR
Refinance Rate Larger Loan Amounts in Eligible Areas (Government Loan) 30-Year Fixed-Rate FHA APR|RR_LARGERGOV_30YFIXEDFHA_APR
Refinance Rate Larger Loan Amounts in Eligible Areas (Conforming Loan) 7/1 ARM Interest Rate|RR_LARGERCON_71ARM_IR
Refinance Rate Larger Loan Amounts in Eligible Areas (Conforming Loan) 7/1 ARM APR|RR_LARGERCON_71ARM_APR
Refinance Rate Jumbo Loan (Amounts that exceed conforming loan limits) 30-Year Fixed Rate Interest Rate|RR_JUMBO_30YFIXED_IR
Refinance Rate Jumbo Loan (Amounts that exceed conforming loan limits) 30-Year Fixed Rate APR|RR_JUMBO_30YFIXED_APR
Refinance Rate Jumbo Loan (Amounts that exceed conforming loan limits) 7/1 ARM Interest Rate|RR_JUMBO_71ARM_IR
Refinance Rate Jumbo Loan (Amounts that exceed conforming loan limits) 7/1 ARM APR|RR_JUMBO_71ARM_APR
QUANDL:FRED/MORTG
Feature to be Added:
Trending
Oscillators
Alerts
www.quandl.com
RSI MTF by PeterOThis is my take on reaching Higher TimeFrame charts, what is usually helpful when determining the trend. On the example of RSI.
So imagine you want to check RSI from higher timeframe. 15x higher for example. There are 3 ways to do it.
1. security(tickerid,"15",rsi(close,14))
DON'T!!! I strongly advise against this method. Security() function is buggy in PineScript, leads to so-called "repainting" issues. Repainting is caused by creating leak from future data and leads to abnormally fantastic strategy backtest results like the one in Open Close Cross Strategy. Theoretically speaking if security() used correctly - with Pine version3 and barmerge.lookahead_off - you should encounter no repainting, but I could swear I saw scripts repaint even with security() implemented properly.
Even assuming security() implemented correctly will not repaint - it will create delay in your script. I'm using "15" multiplier in my example, and this means, I have to wait for 15 candles to close to produce indicators value. If a strong move happens in the meantime, I'm blind, because I have to wait anyway.
So for your own security, stay away from security() at all times.
2. rsi(close,14*15)
This will produce RSI plot with no delay, but a very flattened one. RSI will move between 45 and 45, never even reaching 30 or 70 levels. So pretty useless.
3. Dig-in-the-formula way.
Doing a bit more math produces RSI line, which is not delayed, not repainting and moving in full 0-100 RSI range. Actually - looking almost identical to the one from the higher timeframe. Which was the goal of this script.

XPloRR MA-Trailing-Stop StrategyXPloRR MA-Trailing-Stop Strategy
Long term MA-Trailing-Stop strategy with Adjustable Signal Strength to beat Buy&Hold strategy
None of the strategies that I tested can beat the long term Buy&Hold strategy. That's the reason why I wrote this strategy.
Purpose: beat Buy&Hold strategy with around 10 trades. 100% capitalize sold trade into new trade.
My buy strategy is triggered by the fast buy EMA (blue) crossing over the slow buy SMA curve (orange) and the fast buy EMA has a certain up strength.
My sell strategy is triggered by either one of these conditions:
the EMA(6) of the close value is crossing under the trailing stop value (green) or
the fast sell EMA (navy) is crossing under the slow sell SMA curve (red) and the fast sell EMA has a certain down strength.
The trailing stop value (green) is set to a multiple of the ATR(15) value.
ATR(15) is the SMA(15) value of the difference between the high and low values.
The scripts shows a lot of graphical information:
The close value is shown in light-green. When the close value is lower then the buy value, the close value is shown in light-red. This way it is possible to evaluate the virtual losses during the trade.
the trailing stop value is shown in dark-green. When the sell value is lower then the buy value, the last color of the trade will be red (best viewed when zoomed)(in the example, there are 2 trades that end in gain and 2 in loss (red line at end))
the EMA and SMA values for both buy and sell signals are shown as a line
the buy and sell(close) signals are labeled in blue
How to use this strategy?
Every stock has it's own "DNA", so first thing to do is tune the right parameters to get the best strategy values voor EMA , SMA, Strength for both buy and sell and the Trailing Stop (#ATR).
Look in the strategy tester overview to optimize the values Percent Profitable and Net Profit (using the strategy settings icon, you can increase/decrease the parameters)
Then keep using these parameters for future buy/sell signals only for that particular stock.
Do the same for other stocks.
Important : optimizing these parameters is no guarantee for future winning trades!
Here are the parameters:
Fast EMA Buy: buy trigger when Fast EMA Buy crosses over the Slow SMA Buy value (use values between 10-20)
Slow SMA Buy: buy trigger when Fast EMA Buy crosses over the Slow SMA Buy value (use values between 30-100)
Minimum Buy Strength: minimum upward trend value of the Fast SMA Buy value (directional coefficient)(use values between 0-120)
Fast EMA Sell: sell trigger when Fast EMA Sell crosses under the Slow SMA Sell value (use values between 10-20)
Slow SMA Sell: sell trigger when Fast EMA Sell crosses under the Slow SMA Sell value (use values between 30-100)
Minimum Sell Strength: minimum downward trend value of the Fast SMA Sell value (directional coefficient)(use values between 0-120)
Trailing Stop (#ATR): the trailing stop value as a multiple of the ATR(15) value (use values between 2-20)
Example parameters for different stocks (Start capital: 1000, Order=100% of equity, Period 1/1/2005 to now) compared to the Buy&Hold Strategy(=do nothing):
BEKB(Bekaert): EMA-Buy=12, SMA-Buy=44, Strength-Buy=65, EMA-Sell=12, SMA-Sell=55, Strength-Sell=120, Stop#ATR=20
NetProfit: 996%, #Trades: 6, %Profitable: 83%, Buy&HoldProfit: 78%
BAR(Barco): EMA-Buy=16, SMA-Buy=80, Strength-Buy=44, EMA-Sell=12, SMA-Sell=45, Strength-Sell=82, Stop#ATR=9
NetProfit: 385%, #Trades: 7, %Profitable: 71%, Buy&HoldProfit: 55%
AAPL(Apple): EMA-Buy=12, SMA-Buy=45, Strength-Buy=40, EMA-Sell=19, SMA-Sell=45, Strength-Sell=106, Stop#ATR=8
NetProfit: 6900%, #Trades: 7, %Profitable: 71%, Buy&HoldProfit: 2938%
TNET(Telenet): EMA-Buy=12, SMA-Buy=45, Strength-Buy=27, EMA-Sell=19, SMA-Sell=45, Strength-Sell=70, Stop#ATR=14
NetProfit: 129%, #Trade

XPloRR MA-Buy ATR-Trailing-Stop Long Term Strategy Beating B&HXPloRR MA-Buy ATR-MA-Trailing-Stop Strategy
Long term MA Trailing Stop strategy to beat Buy&Hold strategy
None of the strategies that I tested can beat the long term Buy&Hold strategy. That's the reason why I wrote this strategy.
Purpose: beat Buy&Hold strategy with around 10 trades. 100% capitalize sold trade into new trade.
My buy strategy is triggered by the EMA(blue) crossing over the SMA curve(orange).
My sell strategy is triggered by another EMA(lime) of the close value crossing the trailing stop(green) value.
The trailing stop value(green) is set to a multiple of the ATR(15) value.
ATR(15) is the SMA(15) value of the difference between high and low values.
Every stock has it's own "DNA", so first thing to do is find the right parameters to get the best strategy values voor EMA, SMA and Trailing Stop.
Then keep using these parameter for future buy/sell signals only for that particular stock.
Do the same for other stocks.
Here are the parameters:
Exponential MA: buy trigger when crossing over the SMA value (use values between 11-50)
Simple MA: buy trigger when EMA crosses over the SMA value (use values between 20 and 200)
Stop EMA: sell trigger when Stop EMA of close value crosses under the trailing stop value (use values between 8 and 16)
Trailing Stop #ATR: defines the trailing stop value as a multiple of the ATR(15) value
Example parameters for different stocks (Start capital: 1000, Order=100% of equity, Period 1/1/2005 to now):
BAR(Barco): EMA=11, SMA=82, StopEMA=12, Stop#ATR=9
Buy&HoldProfit: 45.82%, NetProfit: 294.7%, #Trades:8, %Profit:62.5%, ProfitFactor: 12.539
AAPL(Apple): EMA=12, SMA=45, StopEMA=12, Stop#ATR=6
Buy&HoldProfit: 2925.86%, NetProfit: 4035.92%, #Trades:10, %Profit:60%, ProfitFactor: 6.36
BEKB(Bekaert): EMA=12, SMA=42, StopEMA=12, Stop#ATR=7
Buy&HoldProfit: 81.11%, NetProfit: 521.37%, #Trades:10, %Profit:60%, ProfitFactor: 2.617
SOLB(Solvay): EMA=12, SMA=63, StopEMA=11, Stop#ATR=8
Buy&HoldProfit: 43.61%, NetProfit: 151.4%, #Trades:8, %Profit:75%, ProfitFactor: 3.794
PHIA(Philips): EMA=11, SMA=80, StopEMA=8, Stop#ATR=10
Buy&HoldProfit: 56.79%, NetProfit: 198.46%, #Trades:6, %Profit:83.33%, ProfitFactor: 23.07
I am very curious to see the parameters for your stocks and please make suggestions to improve this strategy.

VWAP MA HLOC securities Jayy update fix This version replaces previous versions that stopped functioning as a result of a TradingView script update.
This script complies with the current script syntax.
for intraday securities default is 9:30 am to 4 pm Eastern Other session choices are provided in the format dialogue box.
script plots VWAP, yesterday's high, low, open and close (HLOC), the day befores HLOC - if desired, today's open and todays high and low.
Also signals inside bars (high is less than or equal to the previous
bar's high and the low is greater than or equal to
the previous low) the : true inside bars have a maroon triangle below the bar as well as a ">" above the bar.
If subsequent bars are inside the last bar before the last true inside bar they also are marked with an ">"
Also plots the 20 ema for different time periods (as per Al Brooks), If you trade the 5 min then you will
likely be interested in the 20 ema for 15 mins and 60 mins
the following is a list of the higher timeframe 20 emas
1 minute 5, 15, 60 period 20 ema
5 minute 15, 60 period 20 ema
15 minute 60, 120 , 240 period 20 ema
60 minute 120, 240 period 20 ema
120 minute 240, D period 20 ema
240 minute D period 20 ema
Jayy
ICT Macro Slot Algo Event📊 Overview
A powerful multi-timeframe trading indicator that combines Institutional Macro Session Tracking identify optimal trading windows throughout the day. This tool helps traders align with institutional flow patterns and algorithmic activity across major sessions.
🎯 Key Features
1. Macro Algo Event Sessions
Tracks 6 key institutional time windows during NY Session:
NY Sweep (08:50-09:10) - Opening balance flows
Silver Bullet #1 (09:50-10:10) - First major macro move
Silver Bullet #2 (10:50-11:10) - Second chance/retest opportunity
Lunch Macro (11:50-12:10) - Mid-day repositioning
Post-Lunch Rebalance (13:10-13:40) - Post-lunch adjustments
NY Closing Macros (15:15-15:45) - End-of-day flows

ICT Macro Slot Algo Event📊 Overview
A powerful multi-timeframe trading indicator that combines Institutional Macro Session Tracking to identify optimal trading windows throughout the day. This tool helps traders align with institutional flow patterns and algorithmic activity across major sessions.
🎯 Key Features
1. Macro Algo Event Sessions
Tracks 6 key institutional time windows during NY Session:
NY Sweep (08:50-09:10) - Opening balance flows
Silver Bullet #1 (09:50-10:10) - First major macro move
Silver Bullet #2 (10:50-11:10) - Second chance/retest opportunity
Lunch Macro (11:50-12:10) - Mid-day repositioning
Post-Lunch Rebalance (13:10-13:40) - Post-lunch adjustments
NY Closing Macros (15:15-15:45) - End-of-day flows

Bifurcation Zone - CAEBifurcation Zone — Cognitive Adversarial Engine (BZ-CAE)
Bifurcation Zone — CAE (BZ-CAE) is a next-generation divergence detection system enhanced by a Cognitive Adversarial Engine that evaluates both sides of every potential trade before presenting signals. Unlike traditional divergence indicators that show every price-oscillator disagreement regardless of context, BZ-CAE applies comprehensive market-state intelligence to identify only the divergences that occur in favorable conditions with genuine probability edges.
The system identifies structural bifurcation points — critical junctures where price and momentum disagree, signaling potential reversals or continuations — then validates these opportunities through five interconnected intelligence layers: Trend Conviction Scoring , Directional Momentum Alignment , Multi-Factor Exhaustion Modeling , Adversarial Validation , and Confidence Scoring . The result is a selective, context-aware signal system that filters noise and highlights high-probability setups.
This is not a "buy the arrow" indicator. It's a decision support framework that teaches you how to read market state, evaluate divergence quality, and make informed trading decisions based on quantified intelligence rather than hope.
What Sets BZ-CAE Apart: Technical Architecture
The Problem With Traditional Divergence Indicators
Most divergence indicators operate on a simple rule: if price makes a higher high and RSI makes a lower high, show a bearish signal. If price makes a lower low and RSI makes a higher low, show a bullish signal. This creates several critical problems:
Context Blindness : They show counter-trend signals in powerful trends that rarely reverse, leading to repeated losses as you fade momentum.
Signal Spam : Every minor price-oscillator disagreement generates an alert, overwhelming you with low-quality setups and creating analysis paralysis.
No Quality Ranking : All signals are treated identically. A marginal divergence in choppy conditions receives the same visual treatment as a high-conviction setup at a major exhaustion point.
Single-Sided Evaluation : They ask "Is this a good long?" without checking if the short case is overwhelmingly stronger, leading you into obvious bad trades.
Static Configuration : You manually choose RSI 14 or Stochastic 14 and hope it works, with no systematic way to validate if that's optimal for your instrument.
BZ-CAE's Solution: Cognitive Adversarial Intelligence
BZ-CAE solves these problems through an integrated five-layer intelligence architecture:
1. Trend Conviction Score (TCS) — 0 to 1 Scale
Most indicators check if ADX is above 25 to determine "trending" conditions. This binary approach misses nuance. TCS is a weighted composite metric:
Formula : 0.35 × normalize(ADX, 10, 35) + 0.35 × structural_strength + 0.30 × htf_alignment
Structural Strength : 10-bar SMA of consecutive directional bars. Captures persistence — are bulls or bears consistently winning?
HTF Alignment : Multi-timeframe EMA stacking (20/50/100/200). When all EMAs align in the same direction, you're in institutional trend territory.
Purpose : Quantifies how "locked in" the trend is. When TCS exceeds your threshold (default 0.80), the system knows to avoid counter-trend trades unless other factors override.
Interpretation :
TCS > 0.85: Very strong trend — counter-trading is extremely high risk
TCS 0.70-0.85: Strong trend — favor continuation, require exhaustion for reversals
TCS 0.50-0.70: Moderate trend — context matters, both directions viable
TCS < 0.50: Weak/choppy — reversals more viable, range-bound conditions
2. Directional Momentum Alignment (DMA) — ATR-Normalized
Formula : (EMA21 - EMA55) / ATR14
This isn't just "price above EMA" — it's a regime-aware momentum gauge. The same $100 price movement reads completely differently in high-volatility crypto versus low-volatility forex. By normalizing with ATR, DMA adapts its interpretation to current market conditions.
Purpose : Quantifies the directional "force" behind current price action. Positive = bullish push, negative = bearish push. Magnitude = strength.
Interpretation :
DMA > 0.7: Strong bullish momentum — bearish divergences risky
DMA 0.3 to 0.7: Moderate bullish bias
DMA -0.3 to 0.3: Balanced/choppy conditions
DMA -0.7 to -0.3: Moderate bearish bias
DMA < -0.7: Strong bearish momentum — bullish divergences risky
3. Multi-Factor Exhaustion Modeling — 0 to 1 Probability
Single-metric exhaustion detection (like "RSI > 80") misses complex market states. BZ-CAE aggregates five independent exhaustion signals:
Volume Spikes : Current volume versus 50-bar average
2.5x average: 0.25 weight
2.0x average: 0.15 weight
1.5x average: 0.10 weight
Divergence Present : The fact that a divergence exists contributes 0.30 weight — structural momentum disagreement is itself an exhaustion signal.
RSI Extremes : Captures oscillator climax zones
RSI > 80 or < 20: 0.25 weight
RSI > 75 or < 25: 0.15 weight
Pin Bar Detection : Identifies rejection candles (2:1 wick-to-body ratio, indicating failed breakout attempts): 0.15 weight
Extended Runs : Consecutive bars above/below EMA20 without pullback
30+ bars: 0.15 weight (market hasn't paused to consolidate)
Total exhaustion score is the sum of all applicable weights, capped at 1.0.
Purpose : Detects when strong trends become vulnerable to reversal. High exhaustion can override trend filters, allowing counter-trend trades at genuine turning points that basic indicators would miss.
Interpretation :
Exhaustion > 0.75: High probability of climax — yellow background shading alerts you visually
Exhaustion 0.50-0.75: Moderate overextension — watch for confirmation
Exhaustion < 0.50: Fresh move — trend can continue, counter-trend trades higher risk
4. Adversarial Validation — Game Theory Applied to Trading
This is BZ-CAE's signature innovation. Before approving any signal, the engine quantifies BOTH sides of the trade simultaneously:
For Bullish Divergences , it calculates:
Bull Case Score (0-1+) :
Distance below EMA20 (pullback quality): up to 0.25
Bullish EMA alignment (close > EMA20 > EMA50): 0.25
Oversold RSI (< 40): 0.25
Volume confirmation (> 1.2x average): 0.25
Bear Case Score (0-1+) :
Price below EMA50 (structural weakness): 0.30
Very oversold RSI (< 30, indicating knife-catching): 0.20
Differential = Bull Case - Bear Case
If differential < -0.10 (default threshold), the bear case is dominating — signal is BLOCKED or ANNOTATED.
For Bearish Divergences , the logic inverts (Bear Case vs Bull Case).
Purpose : Prevents trades where you're fighting obvious strength in the opposite direction. This is institutional-grade risk management — don't just evaluate your trade, evaluate the counter-trade simultaneously.
Why This Matters : You might see a bullish divergence at a local low, but if price is deeply below major support EMAs with strong bearish momentum, you're catching a falling knife. The adversarial check catches this and blocks the signal.
5. Confidence Scoring — 0 to 1 Quality Assessment
Every signal that passes initial filters receives a comprehensive quality score:
Formula :
0.30 × normalize(TCS) // Trend context
+ 0.25 × normalize(|DMA|) // Momentum magnitude
+ 0.20 × pullback_quality // Entry distance from EMA20
+ 0.15 × state_quality // ADX + alignment + structure
+ 0.10 × divergence_strength // Slope separation magnitude
+ adversarial_bonus (0-0.30) // Your side's advantage
Purpose : Ranks setup quality for filtering and position sizing decisions. You can set a minimum confidence threshold (default 0.35) to ensure only quality setups reach your chart.
Interpretation :
Confidence > 0.70: Premium setup — consider increased position size
Confidence 0.50-0.70: Good quality — standard size
Confidence 0.35-0.50: Acceptable — reduced size or skip if conservative
Confidence < 0.35: Marginal — blocked in Filtering mode, annotated in Advisory mode
CAE Operating Modes: Learning vs Enforcement
Off : Disables all CAE logic. Raw divergence pipeline only. Use for baseline comparison.
Advisory : Shows ALL signals regardless of CAE evaluation, but annotates signals that WOULD be blocked with specific warnings (e.g., "Bull: strong downtrend (TCS=0.87)" or "Adversarial bearish"). This is your learning mode — see CAE's decision logic in action without missing educational opportunities.
Filtering : Actively blocks low-quality signals. Only setups that pass all enabled gates (Trend Filter, Adversarial Validation, Confidence Gating) reach your chart. This is your live trading mode — trust the system to enforce discipline.
CAE Filter Gates: Three-Layer Protection
When CAE is enabled, signals must pass through three independent gates (each can be toggled on/off):
Gate 1: Strong Trend Filter
If TCS ≥ tcs_threshold (default 0.80)
And signal is counter-trend (bullish in downtrend or bearish in uptrend)
And exhaustion < exhaustion_required (default 0.50)
Then: BLOCK signal
Logic: Don't fade strong trends unless the move is clearly overextended
Gate 2: Adversarial Validation
Calculate both bull case and bear case scores
If opposing case dominates by more than adv_threshold (default 0.10)
Then: BLOCK signal
Logic: Avoid trades where you're fighting obvious strength in the opposite direction
Gate 3: Confidence Gating
Calculate composite confidence score (0-1)
If confidence < min_confidence (default 0.35)
Then: In Filtering mode, BLOCK signal; in Advisory mode, ANNOTATE with warning
Logic: Only take setups with minimum quality threshold
All three gates work together. A signal must pass ALL enabled gates to fire.
Visual Intelligence System
Bifurcation Zones (Supply/Demand Blocks)
When a divergence signal fires, BZ-CAE draws a semi-transparent box extending 15 bars forward from the signal pivot:
Demand Zones (Bullish) : Theme-colored box (cyan in Cyberpunk, blue in Professional, etc.) labeled "Demand" — marks where smart money likely placed buy orders as price diverged at the low.
Supply Zones (Bearish) : Theme-colored box (magenta in Cyberpunk, orange in Professional) labeled "Supply" — marks where smart money likely placed sell orders as price diverged at the high.
Theory : Divergences represent institutional disagreement with the crowd. The crowd pushed price to an extreme (new high or low), but momentum (oscillator) is waning, indicating smart money is taking the opposite side. These zones mark order placement areas that become future support/resistance.
Use Cases :
Exit targets: Take profit when price returns to opposite-side zone
Re-entry levels: If price returns to your entry zone, consider adding
Stop placement: Place stops just beyond your zone (below demand, above supply)
Auto-Cleanup : System keeps the last 20 zones to prevent chart clutter.
Adversarial Bar Coloring — Real-Time Market Debate Heatmap
Each bar is colored based on the Bull Case vs Bear Case differential:
Strong Bull Advantage (diff > 0.3): Full theme bull color (e.g., cyan)
Moderate Bull Advantage (diff > 0.1): 50% transparency bull
Neutral (diff -0.1 to 0.1): Gray/neutral theme
Moderate Bear Advantage (diff < -0.1): 50% transparency bear
Strong Bear Advantage (diff < -0.3): Full theme bear color (e.g., magenta)
This creates a real-time visual heatmap showing which side is "winning" the market debate. When bars flip from cyan to magenta (or vice versa), you're witnessing a shift in adversarial advantage — a leading indicator of potential momentum changes.
Exhaustion Shading
When exhaustion score exceeds 0.75, the chart background displays a semi-transparent yellow highlight. This immediate visual warning alerts you that the current move is at high risk of reversal, even if trend indicators remain strong.
Visual Themes — Six Aesthetic Options
Cyberpunk : Cyan/Magenta/Yellow — High contrast, neon aesthetic, excellent for dark-themed trading environments
Professional : Blue/Orange/Green — Corporate color palette, suitable for presentations and professional documentation
Ocean : Teal/Red/Cyan — Aquatic palette, calming for extended monitoring sessions
Fire : Orange/Red/Coral — Warm aggressive colors, high energy
Matrix : Green/Red/Lime — Code aesthetic, homage to classic hacker visuals
Monochrome : White/Gray — Minimal distraction, maximum focus on price action
All visual elements (signal markers, zones, bar colors, dashboard) adapt to your selected theme.
Divergence Engine — Core Detection System
What Are Divergences?
Divergences occur when price action and momentum indicators disagree, creating structural tension that often resolves in a change of direction:
Regular Divergence (Reversal Signal) :
Bearish Regular : Price makes higher high, oscillator makes lower high → Potential trend reversal down
Bullish Regular : Price makes lower low, oscillator makes higher low → Potential trend reversal up
Hidden Divergence (Continuation Signal) :
Bearish Hidden : Price makes lower high, oscillator makes higher high → Downtrend continuation
Bullish Hidden : Price makes higher low, oscillator makes lower low → Uptrend continuation
Both types can be enabled/disabled independently in settings.
Pivot Detection Methods
BZ-CAE uses symmetric pivot detection with separate lookback and lookforward periods (default 5/5):
Pivot High : Bar where high > all highs within lookback range AND high > all highs within lookforward range
Pivot Low : Bar where low < all lows within lookback range AND low < all lows within lookforward range
This ensures structural validity — the pivot must be a clear local extreme, not just a minor wiggle.
Divergence Validation Requirements
For a divergence to be confirmed, it must satisfy:
Slope Disagreement : Price slope and oscillator slope must move in opposite directions (for regular divs) or same direction with inverted highs/lows (for hidden divs)
Minimum Slope Change : |osc_slope| > min_slope_change / 100 (default 1.0) — filters weak, marginal divergences
Maximum Lookback Range : Pivots must be within max_lookback bars (default 60) — prevents ancient, irrelevant divergences
ATR-Normalized Strength : Divergence strength = min(|price_slope| × |osc_slope| × 10, 1.0) — quantifies the magnitude of disagreement in volatility context
Regular divergences receive 1.0× weight; hidden divergences receive 0.8× weight (slightly less reliable historically).
Oscillator Options — Five Professional Indicators
RSI (Relative Strength Index) : Classic overbought/oversold momentum indicator. Best for: General purpose divergence detection across all instruments.
Stochastic : Range-bound %K momentum comparing close to high-low range. Best for: Mean reversion strategies and range-bound markets.
CCI (Commodity Channel Index) : Measures deviation from statistical mean, auto-normalized to 0-100 scale. Best for: Cyclical instruments and commodities.
MFI (Money Flow Index) : Volume-weighted RSI incorporating money flow. Best for: Volume-driven markets like stocks and crypto.
Williams %R : Inverse stochastic looking back over period, auto-adjusted to 0-100. Best for: Reversal detection at extremes.
Each oscillator has adjustable length (2-200, default 14) and smoothing (1-20, default 1). You also set overbought (50-100, default 70) and oversold (0-50, default 30) thresholds.
Signal Timing Modes — Understanding Repainting
BZ-CAE offers two timing policies with complete transparency about repainting behavior:
Realtime (1-bar, peak-anchored)
How It Works :
Detects peaks 1 bar ago using pattern: high > high AND high > high
Signal prints on the NEXT bar after peak detection (bar_index)
Visual marker anchors to the actual PEAK bar (bar_index - 1, offset -1)
Signal locks in when bar CONFIRMS (closes)
Repainting Behavior :
On the FORMING bar (before close), the peak condition may change as new prices arrive
Once bar CLOSES (barstate.isconfirmed), signal is locked permanently
This is preview/early warning behavior by design
Best For :
Active monitoring and immediate alerts
Learning the system (seeing signals develop in real-time)
Responsive entry if you're watching the chart live
Confirmed (lookforward)
How It Works :
Uses Pine Script's built-in ta.pivothigh() and ta.pivotlow() functions
Requires full pivot validation period (lookback + lookforward bars)
Signal prints pivot_lookforward bars after the actual peak (default 5-bar delay)
Visual marker anchors to the actual peak bar (offset -pivot_lookforward)
No Repainting Behavior
Best For :
Backtesting and historical analysis
Conservative entries requiring full confirmation
Automated trading systems
Swing trading with larger timeframes
Tradeoff :
Delayed entry by pivot_lookforward bars (typically 5 bars)
On a 5-minute chart, this is a 25-minute delay
On a 4-hour chart, this is a 20-hour delay
Recommendation : Use Confirmed for backtesting to verify system performance honestly. Use Realtime for live monitoring only if you're actively watching the chart and understand pre-confirmation repainting behavior.
Signal Spacing System — Anti-Spam Architecture
Even after CAE filtering, raw divergences can cluster. The spacing system enforces separation:
Three Independent Filters
1. Min Bars Between ANY Signals (default 12):
Prevents rapid-fire clustering across both directions
If last signal (bull or bear) was within N bars, block new signal
Ensures breathing room between all setups
2. Min Bars Between SAME-SIDE Signals (default 24, optional enforcement):
Prevents bull-bull or bear-bear spam
Separate tracking for bullish and bearish signal timelines
Toggle enforcement on/off
3. Min ATR Distance From Last Signal (default 0, optional):
Requires price to move N × ATR from last signal location
Ensures meaningful price movement between setups
0 = disabled, 0.5-2.0 = typical range for enabled
All three filters work independently. A signal must pass ALL enabled filters to proceed.
Practical Guidance :
Scalping (1-5m) : Any 6-10, Same-side 12-20, ATR 0-0.5
Day Trading (15m-1H) : Any 12, Same-side 24, ATR 0-1.0
Swing Trading (4H-D) : Any 20-30, Same-side 40-60, ATR 1.0-2.0
Dashboard — Real-Time Control Center
The dashboard (toggleable, four corner positions, three sizes) provides comprehensive system intelligence:
Oscillator Section
Current oscillator type and value
State: OVERBOUGHT / OVERSOLD / NEUTRAL (color-coded)
Length parameter
Cognitive Engine Section
TCS (Trend Conviction Score) :
Current value with emoji state indicator
🔥 = Strong trend (>0.75)
📊 = Moderate trend (0.50-0.75)
〰️ = Weak/choppy (<0.50)
Color: Red if above threshold (trend filter active), yellow if moderate, green if weak
DMA (Directional Momentum Alignment) :
Current value with emoji direction indicator
🐂 = Bullish momentum (>0.5)
⚖️ = Balanced (-0.5 to 0.5)
🐻 = Bearish momentum (<-0.5)
Color: Green if bullish, red if bearish
Exhaustion :
Current value with emoji warning indicator
⚠️ = High exhaustion (>0.75)
🟡 = Moderate (0.50-0.75)
✓ = Low (<0.50)
Color: Red if high, yellow if moderate, green if low
Pullback :
Quality of current distance from EMA20
Values >0.6 are ideal entry zones (not too close, not too far)
Bull Case / Bear Case (if Adversarial enabled):
Current scores for both sides of the market debate
Differential with emoji indicator:
📈 = Bull advantage (>0.2)
➡️ = Balanced (-0.2 to 0.2)
📉 = Bear advantage (<-0.2)
Last Signal Metrics Section (New Feature)
When a signal fires, this section captures and displays:
Signal type (BULL or BEAR)
Bars elapsed since signal
Confidence % at time of signal
TCS value at signal time
DMA value at signal time
Purpose : Provides a historical reference for learning. You can see what the market state looked like when the last signal fired, helping you correlate outcomes with conditions.
Statistics Section
Total Signals : Lifetime count across session
Blocked Signals : Count and percentage (filter effectiveness metric)
Bull Signals : Total bullish divergences
Bear Signals : Total bearish divergences
Purpose : System health monitoring. If blocked % is very high (>60%), filters may be too strict. If very low (<10%), filters may be too loose.
Advisory Annotations
When CAE Mode = Advisory, this section displays warnings for signals that would be blocked in Filtering mode:
Examples:
"Bull spacing: wait 8 bars"
"Bear: strong uptrend (TCS=0.87)"
"Adversarial bearish"
"Low confidence 32%"
Multiple warnings can stack, separated by " | ". This teaches you CAE's decision logic transparently.
How to Use BZ-CAE — Complete Workflow
Phase 1: Initial Setup (First Session)
Apply BZ-CAE to your chart
Select your preferred Visual Theme (Cyberpunk recommended for visibility)
Set Signal Timing to "Confirmed (lookforward)" for learning
Choose your Oscillator Type (RSI recommended for general use, length 14)
Set Overbought/Oversold to 70/30 (standard)
Enable both Regular Divergence and Hidden Divergence
Set Pivot Lookback/Lookforward to 5/5 (balanced structure)
Enable CAE Intelligence
Set CAE Mode to "Advisory" (learning mode)
Enable all three CAE filters: Strong Trend Filter , Adversarial Validation , Confidence Gating
Enable Show Dashboard , position Top Right, size Normal
Enable Draw Bifurcation Zones and Adversarial Bar Coloring
Phase 2: Learning Period (Weeks 1-2)
Goal : Understand how CAE evaluates market state and filters signals.
Activities :
Watch the dashboard during signals :
Note TCS values when counter-trend signals fail — this teaches you the trend strength threshold for your instrument
Observe exhaustion patterns at actual turning points — learn when overextension truly matters
Study adversarial differential at signal times — see when opposing cases dominate
Review blocked signals (orange X-crosses):
In Advisory mode, you see everything — signals that would pass AND signals that would be blocked
Check the advisory annotations to understand why CAE would block
Track outcomes: Were the blocks correct? Did those signals fail?
Use Last Signal Metrics :
After each signal, check the dashboard capture of confidence, TCS, and DMA
Journal these values alongside trade outcomes
Identify patterns: Do confidence >0.70 signals work better? Does your instrument respect TCS >0.85?
Understand your instrument's "personality" :
Trending instruments (indices, major forex) may need TCS threshold 0.85-0.90
Choppy instruments (low-cap stocks, exotic pairs) may work best with TCS 0.70-0.75
High-volatility instruments (crypto) may need wider spacing
Low-volatility instruments may need tighter spacing
Phase 3: Calibration (Weeks 3-4)
Goal : Optimize settings for your specific instrument, timeframe, and style.
Calibration Checklist :
Min Confidence Threshold :
Review confidence distribution in your signal journal
Identify the confidence level below which signals consistently fail
Set min_confidence slightly above that level
Day trading : 0.35-0.45
Swing trading : 0.40-0.55
Scalping : 0.30-0.40
TCS Threshold :
Find the TCS level where counter-trend signals consistently get stopped out
Set tcs_threshold at or slightly below that level
Trending instruments : 0.85-0.90
Mixed instruments : 0.80-0.85
Choppy instruments : 0.75-0.80
Exhaustion Override Level :
Identify exhaustion readings that marked genuine reversals
Set exhaustion_required just below the average
Typical range : 0.45-0.55
Adversarial Threshold :
Default 0.10 works for most instruments
If you find CAE is too conservative (blocking good trades), raise to 0.15-0.20
If signals are still getting caught in opposing momentum, lower to 0.07-0.09
Spacing Parameters :
Count bars between quality signals in your journal
Set min bars ANY to ~60% of that average
Set min bars SAME-SIDE to ~120% of that average
Scalping : Any 6-10, Same 12-20
Day trading : Any 12, Same 24
Swing : Any 20-30, Same 40-60
Oscillator Selection :
Try different oscillators for 1-2 weeks each
Track win rate and average winner/loser by oscillator type
RSI : Best for general use, clear OB/OS
Stochastic : Best for range-bound, mean reversion
MFI : Best for volume-driven markets
CCI : Best for cyclical instruments
Williams %R : Best for reversal detection
Phase 4: Live Deployment
Goal : Disciplined execution with proven, calibrated system.
Settings Changes :
Switch CAE Mode from Advisory to Filtering
System now actively blocks low-quality signals
Only setups passing all gates reach your chart
Keep Signal Timing on Confirmed for conservative entries
OR switch to Realtime if you're actively monitoring and want faster entries (accept pre-confirmation repaint risk)
Use your calibrated thresholds from Phase 3
Enable high-confidence alerts: "⭐ High Confidence Bullish/Bearish" (>0.70)
Trading Discipline Rules :
Respect Blocked Signals :
If CAE blocks a trade you wanted to take, TRUST THE SYSTEM
Don't manually override — if you consistently disagree, return to Phase 2/3 calibration
The block exists because market state failed intelligence checks
Confidence-Based Position Sizing :
Confidence >0.70: Standard or increased size (e.g., 1.5-2.0% risk)
Confidence 0.50-0.70: Standard size (e.g., 1.0% risk)
Confidence 0.35-0.50: Reduced size (e.g., 0.5% risk) or skip if conservative
TCS-Based Management :
High TCS + counter-trend signal: Use tight stops, quick exits (you're fading momentum)
Low TCS + reversal signal: Use wider stops, trail aggressively (genuine reversal potential)
Exhaustion Awareness :
Exhaustion >0.75 (yellow shading): Market is overextended, reversal risk is elevated — consider early exit or tighter trailing stops even on winning trades
Exhaustion <0.30: Continuation bias — hold for larger move, wide trailing stops
Adversarial Context :
Strong differential against you (e.g., bullish signal with bear diff <-0.2): Use very tight stops, consider skipping
Strong differential with you (e.g., bullish signal with bull diff >0.2): Trail aggressively, this is your tailwind
Practical Settings by Timeframe & Style
Scalping (1-5 Minute Charts)
Objective : High frequency, tight stops, quick reversals in fast-moving markets.
Oscillator :
Type: RSI or Stochastic (fast response to quick moves)
Length: 9-11 (more responsive than standard 14)
Smoothing: 1 (no lag)
OB/OS: 65/35 (looser thresholds ensure frequent crossings in fast conditions)
Divergence :
Pivot Lookback/Lookforward: 3/3 (tight structure, catch small swings)
Max Lookback: 40-50 bars (recent structure only)
Min Slope Change: 0.8-1.0 (don't be overly strict)
CAE :
Mode: Advisory first (learn), then Filtering
Min Confidence: 0.30-0.35 (lower bar for speed, accept more signals)
TCS Threshold: 0.70-0.75 (allow more counter-trend opportunities)
Exhaustion Required: 0.45-0.50 (moderate override)
Strong Trend Filter: ON (still respect major intraday trends)
Adversarial: ON (critical for scalping protection — catches bad entries quickly)
Spacing :
Min Bars ANY: 6-10 (fast pace, many setups)
Min Bars SAME-SIDE: 12-20 (prevent clustering)
Min ATR Distance: 0 or 0.5 (loose)
Timing : Realtime (speed over precision, but understand repaint risk)
Visuals :
Signal Size: Tiny (chart clarity in busy conditions)
Show Zones: Optional (can clutter on low timeframes)
Bar Coloring: ON (helps read momentum shifts quickly)
Dashboard: Small size (corner reference, not main focus)
Key Consideration : Scalping generates noise. Even with CAE, expect lower win rate (45-55%) but aim for favorable R:R (2:1 or better). Size conservatively.
Day Trading (15-Minute to 1-Hour Charts)
Objective : Balance quality and frequency. Standard divergence trading approach.
Oscillator :
Type: RSI or MFI (proven reliability, volume confirmation with MFI)
Length: 14 (industry standard, well-studied)
Smoothing: 1-2
OB/OS: 70/30 (classic levels)
Divergence :
Pivot Lookback/Lookforward: 5/5 (balanced structure)
Max Lookback: 60 bars
Min Slope Change: 1.0 (standard strictness)
CAE :
Mode: Filtering (enforce discipline from the start after brief Advisory learning)
Min Confidence: 0.35-0.45 (quality filter without being too restrictive)
TCS Threshold: 0.80-0.85 (respect strong trends)
Exhaustion Required: 0.50 (balanced override threshold)
Strong Trend Filter: ON
Adversarial: ON
Confidence Gating: ON (all three filters active)
Spacing :
Min Bars ANY: 12 (breathing room between all setups)
Min Bars SAME-SIDE: 24 (prevent bull/bear clusters)
Min ATR Distance: 0-1.0 (optional refinement, typically 0.5-1.0)
Timing : Confirmed (1-bar delay for reliability, no repainting)
Visuals :
Signal Size: Tiny or Small
Show Zones: ON (useful reference for exits/re-entries)
Bar Coloring: ON (context awareness)
Dashboard: Normal size (full visibility)
Key Consideration : This is the "sweet spot" timeframe for BZ-CAE. Market structure is clear, CAE has sufficient data, and signal frequency is manageable. Expect 55-65% win rate with proper execution.
Swing Trading (4-Hour to Daily Charts)
Objective : Quality over quantity. High conviction only. Larger stops and targets.
Oscillator :
Type: RSI or CCI (robust on higher timeframes, smooth longer waves)
Length: 14-21 (capture larger momentum swings)
Smoothing: 1-3
OB/OS: 70/30 or 75/25 (strict extremes)
Divergence :
Pivot Lookback/Lookforward: 5/5 or 7/7 (structural purity, major swings only)
Max Lookback: 80-100 bars (broader historical context)
Min Slope Change: 1.2-1.5 (require strong, undeniable divergence)
CAE :
Mode: Filtering (strict enforcement, premium setups only)
Min Confidence: 0.40-0.55 (high bar for entry)
TCS Threshold: 0.85-0.95 (very strong trend protection — don't fade established HTF trends)
Exhaustion Required: 0.50-0.60 (higher bar for override — only extreme exhaustion justifies counter-trend)
Strong Trend Filter: ON (critical on HTF)
Adversarial: ON (avoid obvious bad trades)
Confidence Gating: ON (quality gate essential)
Spacing :
Min Bars ANY: 20-30 (substantial separation)
Min Bars SAME-SIDE: 40-60 (significant breathing room)
Min ATR Distance: 1.0-2.0 (require meaningful price movement)
Timing : Confirmed (purity over speed, zero repaint for swing accuracy)
Visuals :
Signal Size: Small or Normal (clear markers on zoomed-out view)
Show Zones: ON (important HTF levels)
Bar Coloring: ON (long-term trend awareness)
Dashboard: Normal or Large (comprehensive analysis)
Key Consideration : Swing signals are rare but powerful. Expect 2-5 signals per month per instrument. Win rate should be 60-70%+ due to stringent filtering. Position size can be larger given confidence.
Dashboard Interpretation Reference
TCS (Trend Conviction Score) States
0.00-0.50: Weak/Choppy
Emoji: 〰️
Color: Green/cyan
Meaning: No established trend. Range-bound or consolidating. Both reversal and continuation signals viable.
Action: Reversals (regular divs) are safer. Use wider profit targets (market has room to move). Consider mean reversion strategies.
0.50-0.75: Moderate Trend
Emoji: 📊
Color: Yellow/neutral
Meaning: Developing trend but not locked in. Context matters significantly.
Action: Check DMA and exhaustion. If DMA confirms trend and exhaustion is low, favor continuation (hidden divs). If exhaustion is high, reversals are viable.
0.75-0.85: Strong Trend
Emoji: 🔥
Color: Orange/warning
Meaning: Well-established trend with persistence. Counter-trend is high risk.
Action: Require exhaustion >0.50 for counter-trend entries. Favor continuation signals. Use tight stops on counter-trend attempts.
0.85-1.00: Very Strong Trend
Emoji: 🔥🔥
Color: Red/danger (if counter-trading)
Meaning: Locked-in institutional trend. Extremely high risk to fade.
Action: Avoid counter-trend unless exhaustion >0.75 (yellow shading). Focus exclusively on continuation opportunities. Momentum is king here.
DMA (Directional Momentum Alignment) Zones
-2.0 to -1.0: Strong Bearish Momentum
Emoji: 🐻🐻
Color: Dark red
Meaning: Powerful downside force. Sellers are in control.
Action: Bullish divergences are counter-momentum (high risk). Bearish divergences are with-momentum (lower risk). Size down on longs.
-0.5 to 0.5: Neutral/Balanced
Emoji: ⚖️
Color: Gray/neutral
Meaning: No strong directional bias. Choppy or consolidating.
Action: Both directions have similar probability. Focus on confidence score and adversarial differential for edge.
1.0 to 2.0: Strong Bullish Momentum
Emoji: 🐂🐂
Color: Bright green/cyan
Meaning: Powerful upside force. Buyers are in control.
Action: Bearish divergences are counter-momentum (high risk). Bullish divergences are with-momentum (lower risk). Size down on shorts.
Exhaustion States
0.00-0.50: Fresh Move
Emoji: ✓
Color: Green
Meaning: Trend is healthy, not overextended. Room to run.
Action: Counter-trend trades are premature. Favor continuation. Hold winners for larger moves. Avoid early exits.
0.50-0.75: Mature Move
Emoji: 🟡
Color: Yellow
Meaning: Move is aging. Watch for signs of climax.
Action: Tighten trailing stops on winning trades. Be ready for reversals. Don't add to positions aggressively.
0.75-0.85: High Exhaustion
Emoji: ⚠️
Color: Orange
Background: Yellow shading appears
Meaning: Move is overextended. Reversal risk elevated significantly.
Action: Counter-trend reversals are higher probability. Consider early exits on with-trend positions. Size up on reversal divergences (if CAE allows).
0.85-1.00: Critical Exhaustion
Emoji: ⚠️⚠️
Color: Red
Background: Yellow shading intensifies
Meaning: Climax conditions. Reversal imminent or underway.
Action: Aggressive reversal trades justified. Exit all with-trend positions. This is where major turns occur.
Confidence Score Tiers
0.00-0.30: Low Quality
Color: Red
Status: Blocked in Filtering mode
Action: Skip entirely. Setup lacks fundamental quality across multiple factors.
0.30-0.50: Moderate Quality
Color: Yellow/orange
Status: Marginal — passes in Filtering only if >min_confidence
Action: Reduced position size (0.5-0.75% risk). Tight stops. Conservative profit targets. Skip if you're selective.
0.50-0.70: High Quality
Color: Green/cyan
Status: Good setup across most quality factors
Action: Standard position size (1.0-1.5% risk). Normal stops and targets. This is your bread-and-butter trade.
0.70-1.00: Premium Quality
Color: Bright green/gold
Status: Exceptional setup — all factors aligned
Visual: Double confidence ring appears
Action: Consider increased position size (1.5-2.0% risk, maximum). Wider stops. Larger targets. High probability of success. These are rare — capitalize when they appear.
Adversarial Differential Interpretation
Bull Differential > 0.3 :
Visual: Strong cyan/green bar colors
Meaning: Bull case strongly dominates. Buyers have clear advantage.
Action: Bullish divergences favored (with-advantage). Bearish divergences face headwind (reduce size or skip). Momentum is bullish.
Bull Differential 0.1 to 0.3 :
Visual: Moderate cyan/green transparency
Meaning: Moderate bull advantage. Buyers have edge but not overwhelming.
Action: Both directions viable. Slight bias toward longs.
Differential -0.1 to 0.1 :
Visual: Gray/neutral bars
Meaning: Balanced debate. No clear advantage either side.
Action: Rely on other factors (confidence, TCS, exhaustion) for direction. Adversarial is neutral.
Bear Differential -0.3 to -0.1 :
Visual: Moderate red/magenta transparency
Meaning: Moderate bear advantage. Sellers have edge but not overwhelming.
Action: Both directions viable. Slight bias toward shorts.
Bear Differential < -0.3 :
Visual: Strong red/magenta bar colors
Meaning: Bear case strongly dominates. Sellers have clear advantage.
Action: Bearish divergences favored (with-advantage). Bullish divergences face headwind (reduce size or skip). Momentum is bearish.
Last Signal Metrics — Post-Trade Analysis
After a signal fires, dashboard captures:
Type : BULL or BEAR
Bars Ago : How long since signal (updates every bar)
Confidence : What was the quality score at signal time
TCS : What was trend conviction at signal time
DMA : What was momentum alignment at signal time
Use Case : Post-trade journaling and learning.
Example: "BULL signal 12 bars ago. Confidence: 68%, TCS: 0.42, DMA: -0.85"
Analysis : This was a bullish reversal (regular div) with good confidence, weak trend (TCS), but strong bearish momentum (DMA). The bet was that momentum would reverse — a counter-momentum play requiring exhaustion confirmation. Check if exhaustion was high at that time to justify the entry.
Track patterns:
Do your best trades have confidence >0.65?
Do low-TCS signals (<0.50) work better for you?
Are you more successful with-momentum (DMA aligned with signal) or counter-momentum?
Troubleshooting Guide
Problem: No Signals Appearing
Symptoms : Chart loads, dashboard shows metrics, but no divergence signals fire.
Diagnosis Checklist :
Check dashboard oscillator value : Is it crossing OB/OS levels (70/30)? If oscillator stays in 40-60 range constantly, it can't reach extremes needed for divergence detection.
Are pivots forming? : Look for local swing highs/lows on your chart. If price is in tight consolidation, pivots may not meet lookback/lookforward requirements.
Is spacing too tight? : Check "Last Signal" metrics — how many bars since last signal? If <12 and your min_bars_ANY is 12, spacing filter is blocking.
Is CAE blocking everything? : Check dashboard Statistics section — what's the blocked signal count? High blocks indicate overly strict filters.
Solutions :
Loosen OB/OS Temporarily :
Try 65/35 to verify divergence detection works
If signals appear, the issue was threshold strictness
Gradually tighten back to 67/33, then 70/30 as appropriate
Lower Min Confidence :
Try 0.25-0.30 (diagnostic level)
If signals appear, filter was too strict
Raise gradually to find sweet spot (0.35-0.45 typical)
Disable Strong Trend Filter Temporarily :
Turn off in CAE settings
If signals appear, TCS threshold was blocking everything
Re-enable and lower TCS_threshold to 0.70-0.75
Reduce Min Slope Change :
Try 0.7-0.8 (from default 1.0)
Allows weaker divergences through
Helpful on low-volatility instruments
Widen Spacing :
Set min_bars_ANY to 6-8
Set min_bars_SAME_SIDE to 12-16
Reduces time between allowed signals
Check Timing Mode :
If using Confirmed, remember there's a pivot_lookforward delay (5+ bars)
Switch to Realtime temporarily to verify system is working
Realtime has no delay but repaints
Verify Oscillator Settings :
Length 14 is standard but might not fit all instruments
Try length 9-11 for faster response
Try length 18-21 for slower, smoother response
Problem: Too Many Signals (Signal Spam)
Symptoms : Dashboard shows 50+ signals in Statistics, confidence scores mostly <0.40, signals clustering close together.
Solutions :
Raise Min Confidence :
Try 0.40-0.50 (quality filter)
Blocks bottom-tier setups
Targets top 50-60% of divergences only
Tighten OB/OS :
Use 70/30 or 75/25
Requires more extreme oscillator readings
Reduces false divergences in mid-range
Increase Min Slope Change :
Try 1.2-1.5 (from default 1.0)
Requires stronger, more obvious divergences
Filters marginal slope disagreements
Raise TCS Threshold :
Try 0.85-0.90 (from default 0.80)
Stricter trend filter blocks more counter-trend attempts
Favors only strongest trend alignment
Enable ALL CAE Gates :
Turn on Trend Filter + Adversarial + Confidence
Triple-layer protection
Blocks aggressively — expect 20-40% reduction in signals
Widen Spacing :
min_bars_ANY: 15-20 (from 12)
min_bars_SAME_SIDE: 30-40 (from 24)
Creates substantial breathing room
Switch to Confirmed Timing :
Removes realtime preview noise
Ensures full pivot validation
5-bar delay filters many false starts
Problem: Signals in Strong Trends Get Stopped Out
Symptoms : You take a bullish divergence in a downtrend (or bearish in uptrend), and it immediately fails. Dashboard showed high TCS at the time.
Analysis : This is INTENDED behavior — CAE is protecting you from low-probability counter-trend trades.
Understanding :
Check Last Signal Metrics in dashboard — what was TCS when signal fired?
If TCS was >0.85 and signal was counter-trend, CAE correctly identified it as high risk
Strong trends rarely reverse cleanly without major exhaustion
Your losses here are the system working as designed (blocking bad odds)
If You Want to Override (Not Recommended) :
Lower TCS_threshold to 0.70-0.75 (allows more counter-trend)
Lower exhaustion_required to 0.40 (easier override)
Disable Strong Trend Filter entirely (very risky)
Better Approach :
TRUST THE FILTER — it's preventing costly mistakes
Wait for exhaustion >0.75 (yellow shading) before counter-trending strong TCS
Focus on continuation signals (hidden divs) in high-TCS environments
Use Advisory mode to see what CAE is blocking and learn from outcomes
Problem: Adversarial Blocking Seems Wrong
Symptoms : You see a divergence that "looks good" visually, but CAE blocks with "Adversarial bearish/bullish" warning.
Diagnosis :
Check dashboard Bull Case and Bear Case scores at that moment
Look at Differential value
Check adversarial bar colors — was there strong coloring against your intended direction?
Understanding :
Adversarial catches "obvious" opposing momentum that's easy to miss
Example: Bullish divergence at a local low, BUT price is deeply below EMA50, bearish momentum is strong, and RSI shows knife-catching conditions
Bull Case might be 0.20 while Bear Case is 0.55
Differential = -0.35, far beyond threshold
Block is CORRECT — you'd be fighting overwhelming opposing flow
If You Disagree Consistently
Review blocked signals on chart — scroll back and check outcomes
Did those blocked signals actually work, or did they fail as adversarial predicted?
Raise adv_threshold to 0.15-0.20 (more permissive, allows closer battles)
Disable Adversarial Validation temporarily (diagnostic) to isolate its effect
Use Advisory mode to learn adversarial patterns over 50-100 signals
Remember : Adversarial is conservative BY DESIGN. It prevents "obvious" bad trades where you're fighting strong strength the other way.
Problem: Dashboard Not Showing or Incomplete
Solutions :
Toggle "Show Dashboard" to ON in settings
Try different dashboard sizes (Small/Normal/Large)
Try different positions (Top Left/Right, Bottom Left/Right) — might be off-screen
Some sections require CAE Enable = ON (Cognitive Engine section won't appear if CAE is disabled)
Statistics section requires at least 1 lifetime signal to populate
Check that visual theme is set (dashboard colors adapt to theme)
Problem: Performance Lag, Chart Freezing
Symptoms : Chart loading is slow, indicator calculations cause delays, pinch-to-zoom lags.
Diagnosis : Visual features are computationally expensive, especially adversarial bar coloring (recalculates every bar).
Solutions (In Order of Impact) :
Disable Adversarial Bar Coloring (MOST EXPENSIVE):
Turn OFF "Adversarial Bar Coloring" in settings
This is the single biggest performance drain
Immediate improvement
Reduce Vertical Lines :
Lower "Keep last N vertical lines" to 20-30
Or set to 0 to disable entirely
Moderate improvement
Disable Bifurcation Zones :
Turn OFF "Draw Bifurcation Zones"
Reduces box drawing calculations
Moderate improvement
Set Dashboard Size to Small :
Smaller dashboard = fewer cells = less rendering
Minor improvement
Use Shorter Max Lookback :
Reduce max_lookback to 40-50 (from 60+)
Fewer bars to scan for divergences
Minor improvement
Disable Exhaustion Shading :
Turn OFF "Show Market State"
Removes background coloring calculations
Minor improvement
Extreme Performance Mode :
Disable ALL visual enhancements
Keep only triangle markers
Dashboard Small or OFF
Use Minimal theme if available
Problem: Realtime Signals Repainting
Symptoms : You see a signal appear, but on next bar it disappears or moves.
Explanation :
Realtime mode detects peaks 1 bar ago: high > high AND high > high
On the FORMING bar (before close), this condition can change as new prices arrive
Example: At 10:05, high (10:04 bar) was 100, current high is 99 → peak detected
At 10:05:30, new high of 101 arrives → peak condition breaks → signal disappears
At 10:06 (bar close), final high is 101 → no peak at 10:04 anymore → signal gone permanently
This is expected behavior for realtime responsiveness. You get preview/early warning, but it's not locked until bar confirms.
Solutions :
Use Confirmed Timing :
Switch to "Confirmed (lookforward)" mode
ZERO repainting — pivot must be fully validated
5-bar delay (pivot_lookforward)
What you see in history is exactly what would have appeared live
Accept Realtime Repaint as Tradeoff :
Keep Realtime mode for speed and alerts
Understand that pre-confirmation signals may vanish
Only trade signals that CONFIRM at bar close (check barstate.isconfirmed)
Use for live monitoring, NOT for backtesting
Trade Only After Confirmation :
In Realtime mode, wait 1 full bar after signal appears before entering
If signal survives that bar close, it's locked
This adds 1-bar delay but removes repaint risk
Recommendation : Use Confirmed for backtesting and conservative trading. Use Realtime only for active monitoring with full understanding of preview behavior.
Risk Management Integration
BZ-CAE is a signal generation system, not a complete trading strategy. You must integrate proper risk management:
Position Sizing by Confidence
Confidence 0.70-1.00 (Premium) :
Risk: 1.5-2.0% of account (MAXIMUM)
Reasoning: High-quality setup across all factors
Still cap at 2% — even premium setups can fail
Confidence 0.50-0.70 (High Quality) :
Risk: 1.0-1.5% of account
Reasoning: Standard good setup
Your bread-and-butter risk level
Confidence 0.35-0.50 (Moderate Quality) :
Risk: 0.5-1.0% of account
Reasoning: Marginal setup, passes minimum threshold
Reduce size or skip if you're selective
Confidence <0.35 (Low Quality) :
Risk: 0% (blocked in Filtering mode)
Reasoning: Insufficient quality factors
System protects you by not showing these
Stop Placement Strategies
For Reversal Signals (Regular Divergences) :
Place stop beyond the divergence pivot plus buffer
Bullish : Stop below the divergence low - 1.0-1.5 × ATR
Bearish : Stop above the divergence high + 1.0-1.5 × ATR
Reasoning: If price breaks the pivot, divergence structure is invalidated
For Continuation Signals (Hidden Divergences) :
Place stop beyond recent swing in opposite direction
Bullish continuation : Stop below recent swing low (not the divergence pivot itself)
Bearish continuation : Stop above recent swing high
Reasoning: You're trading with trend, allow more breathing room
ATR-Based Stops :
1.5-2.0 × ATR is standard
Scale by timeframe:
Scalping (1-5m): 1.0-1.5 × ATR (tight)
Day trading (15m-1H): 1.5-2.0 × ATR (balanced)
Swing (4H-D): 2.0-3.0 × ATR (wide)
Never Use Fixed Dollar/Pip Stops :
Markets have different volatility
50-pip stop on EUR/USD ≠ 50-pip stop on GBP/JPY
Always normalize by ATR or pivot structure
Profit Targets and Scaling
Primary Target :
2-3 × ATR from entry (minimum 2:1 reward-risk)
Example : Entry at 100, ATR = 2, stop at 97 (1.5 × ATR) → target at 106 (3 × ATR) = 2:1 R:R
Scaling Out Strategy :
Take 50% off at 1.5 × ATR (secure partial profit)
Move stop to breakeven
Trail remaining 50% with 1.0 × ATR trailing stop
Let winners run if trend persists
Targets by Confidence :
High Confidence (>0.70) : Aggressive targets (3-4 × ATR), trail wider (1.5 × ATR)
Standard Confidence (0.50-0.70) : Normal targets (2-3 × ATR), standard trail (1.0 × ATR)
Low Confidence (0.35-0.50) : Conservative targets (1.5-2 × ATR), tight trail (0.75 × ATR)
Use Bifurcation Zones :
If opposite-side zone is visible on chart (from previous signal), use it as target
Example : Bullish signal at 100, prior supply zone at 110 → use 110 as target
Zones mark institutional resistance/support
Exhaustion-Based Exits :
If you're in a trade and exhaustion >0.75 develops (yellow shading), consider early exit
Market is overextended — reversal risk is high
Take profit even if target not reached
Trade Management by TCS
High TCS + Counter-Trend Trade (Risky) :
Use very tight stops (1.0-1.5 × ATR)
Conservative targets (1.5-2 × ATR)
Quick exit if trade doesn't work immediately
You're fading momentum — respect it
Low TCS + Reversal Trade (Safer) :
Use wider stops (2.0-2.5 × ATR)
Aggressive targets (3-4 × ATR)
Trail with patience
Genuine reversal potential in weak trend
High TCS + Continuation Trade (Safest) :
Standard stops (1.5-2.0 × ATR)
Very aggressive targets (4-5 × ATR)
Trail wide (1.5-2.0 × ATR)
You're with institutional momentum — let it run
Educational Value — Learning Machine Intelligence
BZ-CAE is designed as a learning platform, not just a tool:
Advisory Mode as Teacher
Most indicators are binary: signal or no signal. You don't learn WHY certain setups are better.
BZ-CAE's Advisory mode shows you EVERY potential divergence, then annotates the ones that would be blocked in Filtering mode with specific reasons:
"Bull: strong downtrend (TCS=0.87)" teaches you that TCS >0.85 makes counter-trend very risky
"Adversarial bearish" teaches you that the opposing case was dominating
"Low confidence 32%" teaches you that the setup lacked quality across multiple factors
"Bull spacing: wait 8 bars" teaches you that signals need breathing room
After 50-100 signals in Advisory mode, you internalize the CAE's decision logic. You start seeing these factors yourself BEFORE the indicator does.
Dashboard Transparency
Most "intelligent" indicators are black boxes — you don't know how they make decisions.
BZ-CAE shows you ALL metrics in real-time:
TCS tells you trend strength
DMA tells you momentum alignment
Exhaustion tells you overextension
Adversarial shows both sides of the debate
Confidence shows composite quality
You learn to interpret market state holistically, a skill applicable to ANY trading system beyond this indicator.
Divergence Quality Education
Not all divergences are equal. BZ-CAE teaches you which conditions produce high-probability setups:
Quality divergence : Regular bullish div at a low, TCS <0.50 (weak trend), exhaustion >0.75 (overextended), positive adversarial differential, confidence >0.70
Low-quality divergence : Regular bearish div at a high, TCS >0.85 (strong uptrend), exhaustion <0.30 (not overextended), negative adversarial differential, confidence <0.40
After using the system, you can evaluate divergences manually with similar intelligence.
Risk Management Discipline
Confidence-based position sizing teaches you to adjust risk based on setup quality, not emotions:
Beginners often size all trades identically
Or worse, size UP on marginal setups to "make up" for losses
BZ-CAE forces systematic sizing: premium setups get larger size, marginal setups get smaller size
This creates a probabilistic approach where your edge compounds over time.
What This Indicator Is NOT
Complete transparency about limitations and positioning:
Not a Prediction System
BZ-CAE does not predict future prices. It identifies structural divergences (price-momentum disagreements) and assesses current market state (trend, exhaustion, adversarial conditions). It tells you WHEN conditions favor a potential reversal or continuation, not WHAT WILL HAPPEN.
Markets are probabilistic. Even premium-confidence setups fail ~30-40% of the time. The system improves your probability distribution over many trades — it doesn't eliminate risk.
Not Fully Automated
This is a decision support tool, not a trading robot. You must:
Execute trades manually based on signals
Manage positions (stops, targets, trailing)
Apply discretionary judgment (news events, liquidity, context)
Integrate with your broader strategy and risk rules
The confidence scores guide position sizing, but YOU determine final risk allocation based on your account size, risk tolerance, and portfolio context.
Not Beginner-Friendly
BZ-CAE requires understanding of:
Divergence trading concepts (regular vs hidden, reversal vs continuation)
Market state interpretation (trend vs range, momentum, exhaustion)
Basic technical analysis (pivots, support/resistance, EMAs)
Risk management fundamentals (position sizing, stops, R:R)
This is designed for intermediate to advanced traders willing to invest time learning the system. If you want "buy the arrow" simplicity, this isn't the tool.
Not a Holy Grail
There is no perfect indicator. BZ-CAE filters noise and improves signal quality significantly, but:
Losing trades are inevitable (even at 70% win rate, 30% still fail)
Market conditions change rapidly (yesterday's strong trend becomes today's chop)
Black swan events occur (fundamentals override technicals)
Execution matters (slippage, fees, emotional discipline)
The system provides an EDGE, not a guarantee. Your job is to execute that edge consistently with proper risk management over hundreds of trades.
Not Financial Advice
BZ-CAE is an educational and analytical tool. All trading decisions are your responsibility. Past performance (backtested or live) does not guarantee future results. Only risk capital you can afford to lose. Consult a licensed financial advisor for investment advice specific to your situation.
Ideal Market Conditions
Best Performance Characteristics
Liquid Instruments :
Major forex pairs (EUR/USD, GBP/USD, USD/JPY)
Large-cap stocks and index ETFs (SPY, QQQ, AAPL, MSFT)
High-volume crypto (BTC, ETH)
Major commodities (Gold, Oil, Natural Gas)
Reasoning: Clean price structure, clear pivots, meaningful oscillator behavior
Trending with Consolidations :
Markets that trend for 20-40 bars, then consolidate 10-20 bars, repeat
Creates divergences at consolidation boundaries (reversals) and within trends (continuations)
Both regular and hidden divs find opportunities
5-Minute to Daily Timeframes :
Below 5m: too much noise, false pivots, CAE metrics unstable
Above daily: too few signals, edge diminishes (fundamentals dominate)
Sweet spot: 15m to 4H for most traders
Consistent Volume and Participation :
Regular trading sessions (not holidays or thin markets)
Predictable volatility patterns
Avoid instruments with sudden gaps or circuit breakers
Challenging Conditions
Extremely Low Liquidity :
Penny stocks, exotic forex pairs, low-volume crypto
Erratic pivots, unreliable oscillator readings
CAE metrics can't assess market state properly
Very Low Timeframes (1-Minute or Below) :
Dominated by market microstructure noise
Divergences are everywhere but meaningless
CAE filtering helps but still unreliable
Extended Sideways Consolidation :
100+ bars of tight range with no clear pivots
Oscillator hugs midpoint (45-55 range)
No divergences to detect
Fundamentally-Driven Gap Markets :
Earnings releases, economic data, geopolitical events
Price gaps over stops and targets
Technical structure breaks down
Recommendation: Disable trading around known events
Calculation Methodology — Technical Depth
For users who want to understand the math:
Oscillator Computation
Each oscillator type calculates differently, but all normalize to 0-100:
RSI : ta.rsi(close, length) — Standard Relative Strength Index
Stochastic : ta.stoch(high, low, close, length) — %K calculation
CCI : (ta.cci(hlc3, length) + 100) / 2 — Normalized from -100/+100 to 0-100
MFI : ta.mfi(hlc3, length) — Volume-weighted RSI equivalent
Williams %R : ta.wpr(length) + 100 — Inverted stochastic adjusted to 0-100
Smoothing: If smoothing > 1, apply ta.sma(oscillator, smoothing)
Divergence Detection Algorithm
Identify Pivots :
Price high pivot: ta.pivothigh(high, lookback, lookforward)
Price low pivot: ta.pivotlow(low, lookback, lookforward)
Oscillator high pivot: ta.pivothigh(osc, lookback, lookforward)
Oscillator low pivot: ta.pivotlow(osc, lookback, lookforward)
Store Recent Pivots :
Maintain arrays of last 10 pivots with bar indices
When new pivot confirmed, unshift to array, pop oldest if >10
Scan for Slope Disagreements :
Loop through last 5 pivots
For each pair (current pivot, historical pivot):
Check if within max_lookback bars
Calculate slopes: (current - historical) / bars_between
Regular bearish: price_slope > 0, osc_slope < 0, |osc_slope| > min_threshold
Regular bullish: price_slope < 0, osc_slope > 0, |osc_slope| > min_threshold
Hidden bearish: price_slope < 0, osc_slope > 0, osc_slope > min_threshold
Hidden bullish: price_slope > 0, osc_slope < 0, |osc_slope| > min_threshold
Important Disclaimers and Terms
Performance Disclosure
Past performance, whether backtested or live-traded, does not guarantee future results. Markets change. What works today may not work tomorrow. Hypothetical or simulated performance results have inherent limitations and do not represent actual trading.
Risk of Loss
Trading involves substantial risk of loss. Only trade with risk capital you can afford to lose entirely. The high degree of leverage often available in trading can work against you as well as for you. Leveraged trading may result in losses exceeding your initial deposit.
Not Financial Advice
BZ-CAE is an educational and analytical tool for technical analysis. It is not financial advice, investment advice, or a recommendation to buy or sell any security or instrument. All trading decisions are your sole responsibility. Consult a licensed financial advisor for advice specific to your circumstances.
Technical Indicator Limitations
BZ-CAE is a technical analysis tool based on price and volume data. It does not account for:
Fundamental analysis (earnings, economic data, financial health)
Market sentiment and positioning
Geopolitical events and news
Liquidity conditions and market microstructure changes
Regulatory changes or exchange rules
Integrate with broader analysis and strategy. Do not rely solely on technical indicators for trading decisions.
Repainting Acknowledgment
As disclosed throughout this documentation:
Realtime mode may repaint on forming bars before confirmation (by design for preview functionality)
Confirmed mode has zero repainting (fully validated pivots only)
Choose timing mode appropriate for your use case. Understand the tradeoffs.
Testing Recommendation
ALWAYS test on demo/paper accounts before committing real capital. Validate the indicator's behavior on your specific instruments and timeframes. Learn the system thoroughly in Advisory mode before using Filtering mode.
Learning Resources :
In-indicator tooltips (hover over setting names for detailed explanations)
This comprehensive publishing statement (save for reference)
User guide in script comments (top of code)
Final Word — Philosophy of BZ-CAE
BZ-CAE is not designed to replace your judgment — it's designed to enhance it.
The indicator identifies structural inflection points (bifurcations) where price and momentum disagree. The Cognitive Engine evaluates market state to determine if this disagreement is meaningful or noise. The Adversarial model debates both sides of the trade to catch obvious bad setups. The Confidence system ranks quality so you can choose your risk appetite.
But YOU still execute. YOU still manage risk. YOU still learn from outcomes.
This is intelligence amplification, not intelligence replacement.
Use Advisory mode to learn how expert traders evaluate market state. Use Filtering mode to enforce discipline when emotions run high. Use the dashboard to develop a systematic approach to reading markets. Use confidence scores to size positions probabilistically.
The system provides an edge. Your job is to execute that edge with discipline, patience, and proper risk management over hundreds of trades.
Markets are probabilistic. No system wins every trade. But a systematic edge + disciplined execution + proper risk management compounds over time. That's the path to consistent profitability. BZ-CAE gives you the edge. The discipline and risk management are on you.
Taking you to school. — Dskyz, Trade with insight. Trade with anticipation.

Steff- OBX- DTA OBX – US Open 15-Minute Zone Indicator
This indicator highlights the first 15 minutes of the U.S. stock market opening, also known as the OBX (Opening Balance Extension).
It is designed specifically for Nasdaq and S&P 500, which open at 09:30 New York time — corresponding to 15:30 Danish time.
What this indicator does:
• Marks the price range from 09:30–09:45 (U.S. time) as a zone on your chart
• Automatically adjusts to your local timezone, so the zone always aligns with Danish time
• Extends the zone to the right so you can track how price interacts with OBX throughout the day
• Draws all historical OBX zones so you can analyze previous reactions
• Rebuilds zones automatically when switching timeframes
• Detects breakouts from the zone
• Tracks balancing time only after a real breakout occurs
• Can automatically remove a zone if price spends a continuous amount of time inside it after the breakout (you set the minutes yourself)
• Allows full customization of OBX start time, duration, and behavior
• Individual zones can be manually deleted without being redrawn by the indicator
Why the OBX matters:
The OBX represents one of the most influential time windows in intraday trading because it reflects:
• The first injection of liquidity after the U.S. market opens
• Institutional positioning and algorithmic adjustments
• Early volatility and directional bias
• Common zones for reversals, breakouts, or mean reversion
• Key high-probability reaction levels used by professional traders
This indicator gives you a clear visual representation of when the market reacts to the U.S. open and how price interacts with the opening range throughout the session.

15m ORB + FVG Strategy (ChadAnt)Core Logic
The indicator's logic revolves around three main phases:
1. Defining the 15-Minute Opening Range (ORB)
The script calculates the highest high (rangeHigh) and lowest low (rangeLow) that occurred during the first 15 minutes of the trading day.
This time window is defined by the sessionStr input, which defaults to 0930-0945 (exchange time).
The high and low of this range are plotted as small gray dots once the session ends (rangeSet = true).
2. Identifying a Fair Value Gap (FVG) Setup
After the 15-minute range is set, the indicator waits for a breakout of either the range high or range low.
A "Strict FVG breakout" requires two conditions on the first candle that closes beyond the range:
The candle before the breakout candle ( bars ago) must have been inside the range.
The breakout candle ( bar ago) must have closed outside the range.
A Fair Value Gap (FVG) must form on the most recent three candles (the current bar and the two previous bars).
Bullish FVG (Long Setup): The low of the current bar (low) is greater than the high of the bar two periods prior (high ). This FVG represents a price inefficiency that the trade expects to fill.
Bearish FVG (Short Setup): The high of the current bar (high) is less than the low of the bar two periods prior (low ).
If a valid FVG setup occurs, the indicator marks a pending setup and draws a colored box to highlight the FVG area (Green for Bullish FVG, Red for Bearish FVG).
3. Trade Entry and Management
If a pending setup is identified, the trade is structured as a re-entry trade into the FVG zone:
Entry Price: Set at the outer boundary of the FVG, which is the low of the current bar for a Long setup, or the high of the current bar for a Short setup.
Stop Loss (SL): Set at the opposite boundary of the FVG, which is the low for a Long setup, or the high for a Short setup.
The trade is triggered (tradeActive = true) once the price retraces to the pendingEntry level.
Risk/Reward (RR) Targets: Three Take Profit (TP) levels are calculated based on the distance between the Entry and Stop Loss:
$$\text{Risk} = | \text{Entry} - \text{SL} |$$
$$\text{TP}n = \text{Entry} \pm (\text{Risk} \times \text{RR}n)$$
where $n$ is 1, 2, or 3, corresponding to the input $\text{RR}1$, $\text{RR}2$, and $\text{RR}3$ values (defaults: 1.0, 1.5, and 2.0).
Trade Lines: Upon triggering, lines for the Entry, Stop Loss, and three Take Profit levels are drawn on the chart for a specified length (lineLength).
A crucial feature is the directional lock (highBroken / lowBroken):
If the price breaks a range level (e.g., simpleBrokeHigh) but without a valid FVG setup, the corresponding directional flag (e.g., highBroken) is set to true permanently for the day.
This prevents the indicator from looking for any subsequent trade setups in that direction for the rest of the day, suggesting that the initial move, without an FVG, exhausted the opportunity.
Open-source script
In true TradingView spirit, the creator of this script has made it open-source, so that traders can review and verify its functionality. Kudos to the author! While you can use it for free, remember that republishing the code is subject to our House Rules.
ChadAnt
Disclaimer
The information and publications are not meant to be, and do not constitute, financial, investment, trading, or other types of advice or recommendations supplied

15m ORB + FVG (ChadAnt)Core Logic
The indicator's logic revolves around three main phases:
1. Defining the 15-Minute Opening Range (ORB)
The script calculates the highest high (rangeHigh) and lowest low (rangeLow) that occurred during the first 15 minutes of the trading day.
This time window is defined by the sessionStr input, which defaults to 0930-0945 (exchange time).
The high and low of this range are plotted as small gray dots once the session ends (rangeSet = true).
2. Identifying a Fair Value Gap (FVG) Setup
After the 15-minute range is set, the indicator waits for a breakout of either the range high or range low.
A "Strict FVG breakout" requires two conditions on the first candle that closes beyond the range:
The candle before the breakout candle ( bars ago) must have been inside the range.
The breakout candle ( bar ago) must have closed outside the range.
A Fair Value Gap (FVG) must form on the most recent three candles (the current bar and the two previous bars).
Bullish FVG (Long Setup): The low of the current bar (low) is greater than the high of the bar two periods prior (high ). This FVG represents a price inefficiency that the trade expects to fill.
Bearish FVG (Short Setup): The high of the current bar (high) is less than the low of the bar two periods prior (low ).
If a valid FVG setup occurs, the indicator marks a pending setup and draws a colored box to highlight the FVG area (Green for Bullish FVG, Red for Bearish FVG).
3. Trade Entry and Management
If a pending setup is identified, the trade is structured as a re-entry trade into the FVG zone:
Entry Price: Set at the outer boundary of the FVG, which is the low of the current bar for a Long setup, or the high of the current bar for a Short setup.
Stop Loss (SL): Set at the opposite boundary of the FVG, which is the low for a Long setup, or the high for a Short setup.
The trade is triggered (tradeActive = true) once the price retraces to the pendingEntry level.
Risk/Reward (RR) Targets: Three Take Profit (TP) levels are calculated based on the distance between the Entry and Stop Loss:
$$\text{Risk} = | \text{Entry} - \text{SL} |$$
$$\text{TP}n = \text{Entry} \pm (\text{Risk} \times \text{RR}n)$$
where $n$ is 1, 2, or 3, corresponding to the input $\text{RR}1$, $\text{RR}2$, and $\text{RR}3$ values (defaults: 1.0, 1.5, and 2.0).
Trade Lines: Upon triggering, lines for the Entry, Stop Loss, and three Take Profit levels are drawn on the chart for a specified length (lineLength).
A crucial feature is the directional lock (highBroken / lowBroken):
If the price breaks a range level (e.g., simpleBrokeHigh) but without a valid FVG setup, the corresponding directional flag (e.g., highBroken) is set to true permanently for the day.
This prevents the indicator from looking for any subsequent trade setups in that direction for the rest of the day, suggesting that the initial move, without an FVG, exhausted the opportunity.

Top-Down Analysis - Multi-Timeframe AlignmentThis indicator implements a Top-Down Multi-Timeframe Trading Analysis System. Here's what it does:
Core Functionality
1. Multi-Timeframe Bias Detection
Monitors three timeframes: Daily, 4-Hour, and 1-Hour
Determines if each timeframe is bullish, bearish, or neutral based on two EMAs (9 and 21 period by default)
A timeframe is bullish when: Fast EMA > Slow EMA AND price is above Fast EMA
A timeframe is bearish when: Fast EMA < Slow EMA AND price is below Fast EMA
2. Alignment Tier System
Tier 1 (Full Alignment): All three timeframes agree (Daily = 4H = 1H direction)
Tier 2 (Partial Alignment): Daily and 1H agree, but 4H differs
No Alignment: Timeframes disagree
3. Previous Day Support & Resistance Levels
Automatically plots key levels from the previous day:
Previous Day High (PDH) - resistance
Previous Day Low (PDL) - support
Previous Day Close (PDC)
Previous Day Midpoint (PDM)
4. Execution Zone (15-Minute Window)
Highlights the first 15 minutes after each new 4H candle opens
This is the optimal entry window when alignment conditions are met
5. Pattern Recognition
Detects trading setups:
Double tops/bottoms
Long wicks at support/resistance
Bullish/bearish closes aligned with bias
6. Trade Signals
Generates entry signals when:
There's Tier 1 or Tier 2 alignment
Price is in the 15-minute execution zone
A valid pattern forms (double top/bottom or wick rejection)
7. Visual Dashboard
Shows a real-time table with:
Each timeframe's current bias
Alignment status
Next 4H prediction
Whether price is at a key support/resistance level
Trading Strategy
The indicator helps traders follow the principle of "trade with the higher timeframe trend" by only taking trades when multiple timeframes agree, focusing entries during specific windows, and respecting previous day's key price levels as potential reaction zones.
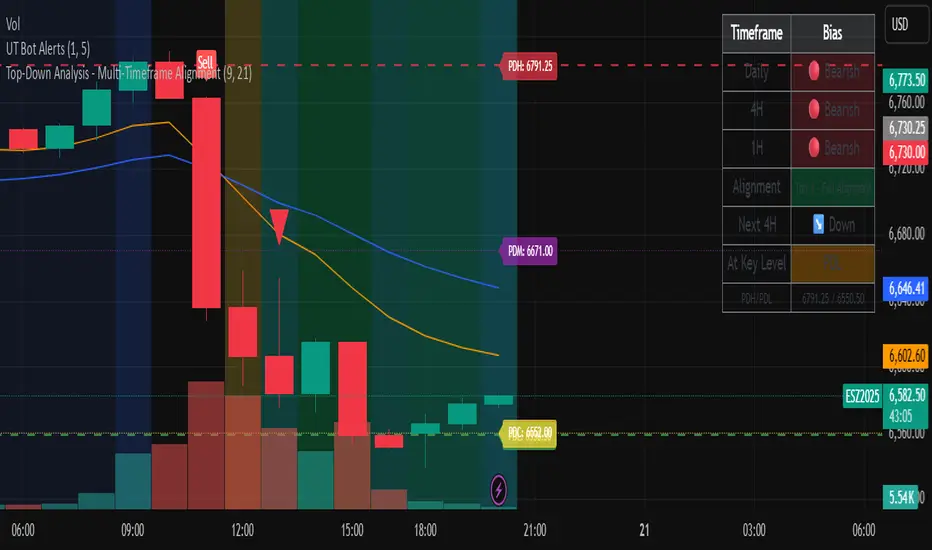
Luxy Sector & Industry RS AnalyzerEver wonder why some stocks soar while others in the same sector barely move? Or why your perfectly timed entry still loses money? Possibly the answer can be found in Relative Strength.
The Luxy Sector & Industry RS Analyzer solves a critical problem that most traders overlook: picking strong stocks in strong sectors AND strong industries . It's not enough for a stock to go up - you want stocks that are crushing their competition at both the sector AND industry level. This indicator does the heavy lifting by automatically comparing your stock against its sector ETF, industry ETF, the broader market, sector leader, and industry leader, giving you a complete multi-level picture of relative performance.
What makes this different?
- Automatic sector AND industry detection - no manual setup required
- Multi-level hierarchy analysis: Market → Sector → Industry → Stock
- Multi-timeframe analysis (1 month to 1 year) in one glance
- Industry ETF mapping (30+ industries covered)
- Clear 0-100 scoring system with letter grades (A+ to F)
- Works on stocks, crypto, forex, and commodities
- Real-time updates with anti-repaint protection
Think of it as your performance dashboard - instantly showing you if you're trading a champion or a laggard at every level of the market hierarchy.
METHODOLOGY & ATTRIBUTION
This indicator is based on classical Relative Strength (RS) analysis principles from technical analysis. RS methodology compares an asset's price performance against a benchmark to identify relative outperformance or underperformance. This concept has been used by professional traders and institutions for decades.
Key Concepts Used:
Relative Strength (RS) - Classical technical analysis concept measuring comparative performance
Multi-Level Hierarchy Analysis - Market → Sector → Industry → Stock comparison
Sector Rotation Analysis - Identifying which sectors are leading or lagging the market
Industry Rotation Analysis - Identifying which industries are leading within their sectors
Multi-period Performance Analysis - Evaluating strength across multiple timeframes
Beta Calculation - Standard statistical measure of volatility relative to a benchmark
DISCLAIMER: This indicator is for educational and informational purposes only. It should not be considered financial advice or a recommendation to buy or sell. Past performance does not guarantee future results. Trading involves risk and may not be suitable for all investors. Always do your own research and consult with a financial advisor before making investment decisions.
with all rows visible - capture when stock has strong RS score (70+) so users can see what a "good" setup looks like]
WHAT THE INDICATOR SHOWS
1. AUTOMATIC ASSET TYPE DETECTION
The indicator automatically identifies what you're analyzing and adjusts accordingly:
Stocks - Compares to sector ETF (XLK, XLF, XLV, etc.) and SPY
Crypto - Compares to Total Crypto Market Cap and Bitcoin
Forex - Compares to relevant currency index (DXY, EXY, etc.)
Commodities - Compares to Gold (GLD) as benchmark
Indices - Compares to broader market indices
How it works: The indicator reads your chart's asset type and ticker, then automatically maps it to the correct sector or benchmark. For stocks, it uses intelligent sector detection (looking at the sector field) to match you with the right sector ETF. For example:
- Technology stocks get compared to XLK (Technology Select Sector SPDR)
- Financial stocks get compared to XLF (Financial Select Sector SPDR)
- Healthcare stocks get compared to XLV (Health Care Select Sector SPDR)
This happens instantly when you add the indicator to any chart - no configuration needed.
2. SECTOR & MARKET BENCHMARKS
What is a Sector ETF?
A sector ETF is an exchange-traded fund that tracks a specific industry group. For example, XLK contains all major technology companies. By comparing your stock to its sector ETF, you can see if your stock is outperforming or underperforming its peers.
The indicator shows three key comparison points:
Stock vs Sector (Benchmark)
This tells you how your stock performs compared to companies in the same industry. Positive numbers mean your stock is beating the sector average. Negative numbers mean it's lagging behind.
Stock vs Market (SPY)
This shows performance against the broader S&P 500 index. This is important because even if a stock beats its sector, the entire sector might be weak. You want stocks that beat both their sector AND the market.
Sector vs Market
This reveals "sector rotation" - whether money is flowing into or out of this sector. When this number is positive, the whole sector is hot and leading the market. This is powerful because strong sectors tend to lift all boats, making it easier to find winners.
3. MULTI-PERIOD PERFORMANCE ANALYSIS
The indicator calculates performance across four timeframes simultaneously:
1 Month (1M) - Recent short-term momentum
3 Months (3M) - Medium-term trend strength
6 Months (6M) - Longer-term positioning
1 Year (1Y) - Full-cycle performance view
Why multiple periods matter:
A stock might look great over 1 month but terrible over 6 months - that's a red flag. The best stocks show consistent strength across all timeframes . When you see positive RS (Relative Strength) values across all four periods, you've found a stock with sustained outperformance.
Each row in the table shows:
- Raw performance percentage for that period
- RS value (the difference compared to benchmark)
- Color coding: Green for positive, red for negative, white for neutral
4. SECTOR LEADER COMPARISON
The indicator automatically identifies and compares your stock to the sector leader - the dominant stock in that industry.
Sector leaders by industry:
Technology: Apple (AAPL)
Healthcare: UnitedHealth (UNH)
Financial: JPMorgan Chase (JPM)
Energy: ExxonMobil (XOM)
Consumer Discretionary: Amazon (AMZN)
Consumer Staples: Walmart (WMT)
And more...
Why this matters:
Comparing to the leader shows you if you're trading a champion or a follower. If your stock consistently beats the sector leader, you've found something special. If it's lagging the leader, you might want to trade the leader instead.
Optional Custom Leader:
You can override the automatic leader and compare to any stock you choose. This is useful if you want to benchmark against a specific competitor or reference stock.
NEW! INDUSTRY ANALYSIS (STOCKS ONLY)
The indicator now provides multi-level analysis by automatically detecting and comparing your stock to its specific industry , not just the broad sector.
Why Industry matters:
Technology sector (XLK) contains many different industries: Software, Semiconductors, Hardware, etc. A software stock might beat the broad tech sector but lag behind other software companies. Industry analysis provides this granular view.
Industry ETF Mapping (30+ industries):
Software/Applications: IGV (iShares Software ETF)
Semiconductors: SMH (VanEck Semiconductor ETF)
Biotech: IBB (iShares Biotechnology ETF)
Pharmaceuticals: XPH (SPDR Pharmaceuticals ETF)
Banks: KBE (SPDR S&P Bank ETF)
Regional Banks: KRE (SPDR Regional Banking ETF)
Oil & Gas Exploration: XOP (SPDR Oil & Gas Exploration ETF)
Homebuilders: XHB (SPDR Homebuilders ETF)
Retail: XRT (SPDR S&P Retail ETF)
Aerospace & Defense: ITA (iShares U.S. Aerospace & Defense ETF)
And many more...
Industry Leader Mapping:
The indicator also identifies the leader within each industry:
Software: Microsoft (MSFT)
Semiconductors: NVIDIA (NVDA)
Biotech: Amgen (AMGN)
Pharmaceuticals: Eli Lilly (LLY)
Banks: JPMorgan (JPM)
Oil Exploration: ConocoPhillips (COP)
And more...
New Table Rows for Stocks:
Industry ETF Performance - How the specific industry performed (green background)
Industry Leader Performance - How the top stock in the industry performed
vs Industry RS - Your stock's outperformance vs its industry ETF
Industry vs Sector RS - Is this industry hot or cold within its sector?
vs Industry Leader RS - Your stock's performance vs the industry's best
Why this is powerful:
A stock that beats both its sector AND its industry is showing strength at every level. This indicates true relative strength, not just riding sector-wide momentum.
Optional Custom Industry:
You can override automatic detection for both Industry ETF and Industry Leader in settings.
5. RS SCORE & GRADING SYSTEM (0-100)
The heart of the indicator is the RS Score - a weighted calculation that distills all the performance data into one clear number from 0 to 100.
How the score is calculated:
FOR STOCKS (with Industry data):
The indicator splits the weight between Sector (60%) and Industry (40%):
SECTOR RS (60% of total weight):
1 Month RS: 24% weight (40% × 0.6)
3 Month RS: 18% weight (30% × 0.6)
6 Month RS: 12% weight (20% × 0.6)
1 Year RS: 6% weight (10% × 0.6)
INDUSTRY RS (40% of total weight):
1 Month RS: 16% weight (40% × 0.4)
3 Month RS: 12% weight (30% × 0.4)
6 Month RS: 8% weight (20% × 0.4)
1 Year RS: 4% weight (10% × 0.4)
FOR OTHER ASSETS (Crypto, Forex, Commodities):
Uses full 100% weight on benchmark:
1 Month RS: 40% weight
3 Month RS: 30% weight
6 Month RS: 20% weight
1 Year RS: 10% weight
It starts at 50 (neutral) and adds or subtracts points based on your asset's relative strength in each period.
Bonus points:
+5 points if the sector is outperforming the market (sector rotation is bullish)
+5 points if the industry is outperforming its sector (hot industry) - STOCKS ONLY
+5 points if RS momentum is improving (getting stronger over time)
-5 points if RS momentum is declining (getting weaker)
The final score is capped between 0-100.
Letter Grade System:
90-100: A+ - Elite performer, crushing the sector
85-89: A - Excellent, strong outperformer
80-84: A- - Very good, above average
75-79: B+ - Good, solid performer
70-74: B - Above average, decent strength
65-69: B- - Slightly above average
60-64: C+ - Average, neutral strength
55-59: C - Below average
50-54: C- - Weak, slight underperformance
45-49: D+ - Concerning weakness
40-44: D - Poor, significant underperformance
0-39: F - Failing, avoid this stock
What scores mean for trading:
- RS Score above 70: Strong stocks worth considering for long positions
- RS Score 50-70: Average stocks, better opportunities elsewhere
- RS Score below 50: Weak stocks, avoid or consider for shorts
6. CONSISTENCY SCORE
This metric shows what percentage of time periods show positive RS .
For STOCKS (with Industry data):
Counts both Sector RS periods AND Industry RS periods (up to 8 total periods):
- If a stock beats both sector and industry in all 4 periods each: Consistency = 100% (8/8)
- If it beats in 6 out of 8 total periods: Consistency = 75%
- If it beats in 4 out of 8 total periods: Consistency = 50%
For OTHER ASSETS:
Counts benchmark periods only (4 total):
- If it beats benchmark in all 4 periods (1M, 3M, 6M, 1Y): Consistency = 100%
- If it beats in 3 out of 4 periods: Consistency = 75%
- If it beats in 2 out of 4 periods: Consistency = 50%
Why consistency matters:
A high RS Score with low consistency might indicate a recent spike that could fade. The best stocks show both high RS Score AND high consistency - they're strong now AND have been strong historically at both the sector AND industry level.
Look for stocks with:
Consistency above 75%: Very reliable strength across all levels
Consistency 50-75%: Decent but check other metrics
Consistency below 50%: Weak or erratic, proceed with caution
7. BETA CALCULATION (Volatility Measure)
Beta measures how much more volatile your stock is compared to its sector.
Beta > 1.2 : High volatility - stock moves more aggressively than sector (marked as "High")
Beta 0.8-1.2 : Normal volatility - moves roughly in line with sector
Beta < 0.8 : Low volatility - stock is more stable than sector (marked as "Low")
Formula used:
Beta = Correlation(Stock, Sector) × (Standard Deviation of Stock / Standard Deviation of Sector)
This uses a 20-period calculation for reliability.
How to use Beta:
- High Beta stocks offer bigger gains but also bigger risks - good for aggressive traders
- Low Beta stocks are more defensive - good for conservative positions
- Match Beta to your risk tolerance and strategy
8. DAYS ABOVE/BELOW SECTOR
This tracks consecutive periods (bars) where your stock outperforms or underperforms its sector.
Days Above Sector:
Counts how many bars in a row your stock has beaten the sector.
10+ days: Strong sustained strength (shown in bright green)
5-9 days: Building momentum (shown in yellow)
1-4 days: Early strength (shown in white)
0 days: Not currently outperforming
Days Below Sector:
Counts how many bars in a row your stock has lagged the sector.
10+ days: Sustained weakness (shown in bright red)
5-9 days: Losing momentum (shown in orange)
1-4 days: Minor weakness (shown in white)
0 days: Not underperforming (this is good!)
Why this matters:
Long streaks show trend persistence. A stock with 15+ days above sector is riding strong momentum. A stock with 15+ days below sector is in a sustained downtrend relative to peers.
9. PRICE VS 52-WEEK HIGH
Shows where current price sits relative to its 52-week high (or equivalent for your timeframe).
95%+ (green) : Stock is near all-time highs - strong positioning
80-94% (yellow) : Stock is in a pullback but still relatively strong
Below 80% : Stock has pulled back significantly from highs
Why this matters:
The strongest stocks stay near their highs. When you see a stock with high RS Score AND price near 52W high, you've found a stock with institutional support and strong buying pressure.
10. RELATIVE VOLUME
Compares current volume to the 20-period average volume.
1.5x+ (green) : High volume - significant interest and participation
Around 1.0x : Average volume - normal trading activity
Below 1.0x : Low volume - less interest or inactive period
Why volume matters:
High relative volume confirms price moves. When a stock makes a strong move on 2x or 3x normal volume, it's more likely to sustain. Low volume moves are often just noise.
11. AVERAGE RS STRENGTH
This calculates the average absolute value of all RS readings across the four timeframes.
It shows the magnitude of divergence from the sector, regardless of direction. A high number means the stock moves very differently from its sector (could be much stronger or much weaker). A low number means it tracks closely with the sector.
High Average RS: Stock has strong character, moves independently
Low Average RS: Stock follows sector closely, lacks individual strength
12. SECTOR ROTATION SIGNAL
This indicator automatically detects when a sector is experiencing bullish rotation - meaning money is flowing into the sector and it's outperforming the broader market.
Condition for bullish rotation:
Sector must be beating SPY (market) in both 1-month AND 3-month periods.
Why this matters:
Stocks in hot sectors tend to perform better because they have tailwinds from sector-wide buying. When sector rotation is bullish and your stock has a high RS Score, you've found an ideal setup.
The indicator adds +5 bonus points to the RS Score when sector rotation is bullish.
13. MOMENTUM DETECTION
The indicator compares 1-month RS to 3-month RS to detect if momentum is improving or declining.
RS Momentum Improving: 1M RS is better than 3M RS - stock is getting stronger (adds +5 to score)
RS Momentum Declining: 1M RS is worse than 3M RS - stock is getting weaker (subtracts -5 from score)
Why momentum matters:
You want to catch stocks as momentum is building, not after it's already peaked. Improving momentum suggests the strength is accelerating, not fading.
14. OVERALL ASSESSMENT & RECOMMENDATION
The indicator provides two quick summary rows:
Overall Rating:
Based on grade and RS Score, you get an instant quality rating:
Strong Leader (A/A+) - Top tier stock, crushing it
Above Average (A-/B+) - Solid performer, better than most
Average (B/B-) - Middle of the pack
Below Average (C/C+) - Struggling, watch carefully
Underperformer (D/F) - Weak stock, underperforming badly
Trading Signal:
Combines multiple factors to give setup quality:
STRONG BUY SETUP - RS Score 70+, Consistency 75+, AND sector rotation bullish. This is the perfect storm - strong stock, consistent strength, hot sector.
BULLISH - RS Score 60+, Consistency 50+. Good quality stock worth considering.
NEUTRAL - RS Score 50+. Okay but not exciting, better opportunities exist.
WEAK - RS Score 40-49. Below average, risky.
AVOID - RS Score below 40. Stay away, too weak.
IMPORTANT: These are educational signals only, not financial advice. Always do your own analysis and risk management.
KEY FEATURES
1. AUTOMATIC EVERYTHING
- Auto-detects asset type (stock, crypto, forex, commodity, index)
- Auto-maps stocks to correct sector ETF (11 sectors covered)
- Auto-maps stocks to correct industry ETF (30+ industries covered)
- Auto-identifies sector leader AND industry leader
- Auto-selects appropriate market benchmark
- Zero configuration required - just add to chart
2. MULTI-ASSET SUPPORT
Works on all asset classes:
US Stocks - Compares to sector ETFs (XLK, XLF, XLV, etc.)
Crypto - Compares to Total Crypto Market Cap
Forex - Compares to currency indices (DXY, EXY, etc.)
Commodities - Compares to Gold (GLD)
Indices - Compares to broader market benchmarks
3. FLEXIBLE DISPLAY
9 table positions (top/middle/bottom, left/center/right)
4 size options (tiny, small, normal, large)
Show/hide table completely
Real-time indicator toggle
4. TIMEFRAME FLEXIBILITY
Choose your analysis timeframe:
Chart Timeframe (default) - Uses whatever timeframe your chart is on
Fixed: 1 Hour, 4 Hours, Daily, Weekly - Forces calculations to specific timeframe
This means you can be on a 5-minute chart but analyze RS on Daily timeframe if you prefer.
5. RS SCORE FILTERING
Set a minimum RS Score threshold to only see strong stocks:
Set to 0 - Shows all stocks
Set to 70 - Only displays stocks with RS Score 70+ (strong stocks only)
Warning message displays if stock doesn't meet threshold
Perfect for screening - quickly scan multiple charts and the indicator only shows tables for stocks that pass your quality filter.
6. CUSTOM LEADER COMPARISON
Override automatic leader detection:
Compare to any ticker you choose
Benchmark against specific competitors
Use your own reference stocks
7. COMPREHENSIVE TOOLTIPS
Every input parameter and every table row has detailed tooltips explaining:
What the metric measures
How to interpret the values
What thresholds indicate strength/weakness
Why it matters for trading
Hover over any element to learn - it's like having a trading coach built in.
8. SMART ALERTS
Built-in alert system for key events:
Divergence Alerts:
Get notified when your stock diverges significantly from its sector.
Bullish Divergence: Stock beating sector by threshold percentage
Bearish Divergence: Stock losing to sector by threshold percentage
Set your threshold (default 5%) - this determines how big a divergence triggers the alert.
RS Score Alerts:
Get notified when RS Score crosses your threshold:
Crossed Above: RS Score went from below to above your threshold (bullish)
Crossed Below: RS Score dropped from above to below threshold (bearish)
Set your threshold (default 70) to focus on strong stocks.
Sector Rotation Alert:
Fires when sector shows bullish rotation (outperforming market).
HOW TO USE THE INDICATOR
FOR SWING TRADERS:
1. Add indicator to your watchlist stocks
2. Look for RS Score 70+ with Consistency 75%+
3. Check if sector rotation is bullish (bonus!)
4. Verify price is near 52W high (95%+)
5. Wait for entry setup on your chart
6. Use stop loss below key support
Example Setup:
Stock shows:
- RS Score: 82 (Grade: A-)
- Consistency: 100% (strong across all periods)
- Sector Rotation: Bullish
- Price vs 52W High: 96%
- Days Above Sector: 12 days
- Relative Volume: 1.8x
This is a textbook strong stock in a hot sector near highs - ideal for swing long.
FOR POSITION TRADERS:
1. Focus on 6-month and 1-year RS values
2. Look for sustained outperformance (Consistency 75%+)
3. Prefer lower Beta stocks (less volatility)
4. Check Days Above Sector for trend persistence
5. Monitor RS Score monthly, exit if drops below 60
FOR ACTIVE TRADERS:
1. Use on intraday timeframes (1H or 4H)
2. Set RS Score filter to 60+ for quick screening
3. Enable Divergence Alerts
4. Watch for momentum improving signal
5. Higher Beta stocks offer more movement
FOR SHORT SELLERS:
1. Look for RS Score below 40 (Grade: D or F)
2. Check for declining momentum
3. Verify Days Below Sector is increasing (10+)
4. Sector rotation should be bearish
5. Price should be well off 52W high
WHAT MAKES A PERFECT SETUP:
The holy grail combination:
RS Score: 75+ (A- or better)
Consistency: 80%+ (strong across time - beats sector AND industry)
Sector Rotation: Bullish (hot sector)
Industry vs Sector: Positive (hot industry within sector)
Days Above Sector: 10+ (sustained strength)
Momentum: Improving (getting stronger)
Price vs 52W High: 90%+ (near highs)
Relative Volume: 1.5x+ (volume confirmation)
When you find this combination, you've located a stock with every advantage in its favor - strong at the stock level, industry level, AND sector level. That's multi-level confirmation of relative strength.
IMPORTANT NOTES
Data Reliability:
All calculations use lookahead=off for anti-repaint protection
Historical values will never change
Real-time indicator toggle only affects the visual clock icon, not data reliability
All security requests are properly configured to prevent future data leakage
Sector Mapping Notes:
Sector detection uses TradingView's sector field
Some stocks may not have sector data - indicator will adapt
Sector ETFs used: XLK, XLF, XLV, XLE, XLY, XLP, XLI, XLB, XLRE, XLU, XLC
Major market ETFs (SPY, QQQ, DIA) are treated as market benchmarks, not stocks
Multi-Asset Notes:
Crypto compares to CRYPTOCAP:TOTAL (total crypto market cap)
Forex compares to relevant currency index based on base currency
Commodities compare to Gold (GLD) as primary commodity benchmark
Custom leaders can be set for any asset type
FREQUENTLY ASKED QUESTIONS
Q: What does RS Score of 75 actually mean?
A: It means your stock is strongly outperforming its sector across multiple timeframes. The score is weighted toward recent performance (1-month gets 40% weight), so 75 indicates sustained relative strength with emphasis on current momentum.
Q: My stock has high RS Score but is going down. Why?
A: RS Score measures relative performance (vs sector/market), not absolute price direction. A stock can fall 5% while its sector falls 10% - that's still positive relative strength. In bear markets or sector corrections, high RS stocks often fall less than peers.
Q: Should I only trade stocks with RS Score above 70?
A: For long positions, yes - focus on 70+ scores. These stocks have proven they can beat their sector. However, for pairs trading or relative value plays, you might also short stocks with scores below 40 while longing stocks above 70.
Q: What if my stock doesn't have a sector?
A: The indicator handles this gracefully. If no sector is detected, it will compare directly to the market (SPY for stocks). Some rows may show N/A, but the indicator will still provide useful market-relative data.
Q: Why does the sector sometimes show N/A?
A: This happens when: 1) Your asset has no sector classification, 2) The stock IS the sector ETF itself, 3) You're analyzing a non-stock asset (crypto, forex, commodity). The indicator adapts by focusing on market-relative metrics instead.
Q: Can I use this on cryptocurrencies?
A: Yes! The indicator automatically detects crypto and compares to the Total Crypto Market Cap (CRYPTOCAP:TOTAL). You can also set a custom leader like Bitcoin (BTCUSD) to compare against the dominant crypto.
Q: What's the difference between RS Score and Consistency?
A: RS Score is the weighted average of how much you're beating the sector (magnitude). Consistency is what percentage of time periods show outperformance (reliability). You want both high - that means strong AND consistent.
Q: Do the alerts repaint?
A: No. All alerts fire only on bar close (barstate.isconfirmed) and use properly configured data with lookahead=off. Once an alert fires, it's final and won't change.
Q: What timeframe should I use?
A: For swing trading: Daily or Weekly. For day trading: 1H or 4H. For position trading: Weekly. Use "Chart Timeframe" mode and switch your chart timeframe to change the analysis period easily.
Q: Why is Days Above Sector showing 0?
A: This means your stock is not currently outperforming its sector. If Days Below Sector is also 0, it means the RS is exactly neutral (very rare). Check the actual RS values to see current standing.
Q: Can I compare to a different market benchmark than SPY?
A: Currently the indicator uses SPY (S&P 500) as the default US stock market benchmark. For crypto it uses CRYPTOCAP:TOTAL, for forex it uses currency indices, etc. The benchmark auto-adjusts based on asset type.
Q: What's a good Beta value?
A: It depends on your strategy. Aggressive traders prefer Beta above 1.2 (more volatility = bigger moves). Conservative traders prefer Beta 0.8-1.0 (more stable). Beta is neutral - it's about matching your risk tolerance.
Q: How often does the table update?
A: With Real-time Indicator enabled: Every tick (constant updates). With it disabled: Only on bar close. Either way, the underlying data is identical and non-repainting - the toggle only affects update frequency and the clock icon display.
Q: My stock is showing "AVOID" but it's up 50% this year. Is the indicator wrong?
A: Not necessarily. The indicator measures RELATIVE performance. If your stock is up 50% but the sector is up 100%, your stock is actually underperforming by 50%. The indicator helps you identify when you should switch to stronger stocks in the same sector.
Q: What does "Strong Buy Setup" really mean?
A: It means three things aligned: 1) RS Score above 70 (strong stock), 2) Consistency above 75% (reliable strength), 3) Sector rotation is bullish (hot sector). This combination historically correlates with stocks that continue outperforming. However, this is NOT financial advice - always do your own analysis.
Q: Can I use this for options trading?
A: Yes! High RS Score stocks make good candidates for call options (bullish bets) while low RS Score stocks may work for puts (bearish bets). Higher Beta stocks will have more volatile options (higher premiums but more movement).
Q: Why is my crypto showing N/A for sector?
A: Cryptocurrencies don't have "sectors" like stocks do. Instead, the indicator compares crypto to the total crypto market cap. This is normal and expected behavior.
Q: What happens if I'm analyzing an ETF?
A: If you're analyzing a sector ETF (like XLK), it will compare to SPY (market). If you're analyzing SPY itself, some comparisons won't be available (can't compare SPY to itself). The indicator intelligently adapts to avoid circular comparisons.
Q: What if my stock doesn't have industry data?
A: Not all stocks are mapped to specific industries (only 30+ major industries are covered). If no industry is detected, the indicator will still work using only sector analysis. The RS Score calculation will use 100% sector weight instead of the 60%/40% split.
Q: Why does Industry vs Sector matter?
A: Industry vs Sector shows if your specific industry is hot or cold within its broader sector. For example, Semiconductors (SMH) might be outperforming Technology sector (XLK) even though both are up. This helps you find not just strong sectors, but the strongest industries within those sectors.
Q: Can I disable Industry analysis?
A: Yes! In the "Industry Analysis" settings group, you can toggle off "Show Industry Analysis in Table" to hide all industry rows. However, even when hidden, industry data still contributes to the RS Score calculation for stocks.
Q: Why is my Consistency Score lower for stocks than other assets?
A: For stocks with industry data, Consistency counts 8 periods (4 Sector + 4 Industry periods) instead of just 4. This means the bar is higher - your stock needs to beat both sector AND industry consistently. A stock that beats sector in all 4 periods but lags industry in 2 periods will show 75% consistency (6/8), not 100%.
BEST PRACTICES
Use as a screening tool - Set RS Score filter to 70+ and quickly scan your watchlist. Only strong stocks will show the table.
Combine with technical analysis - RS Score tells you WHAT to trade, your chart tells you WHEN to enter.
Check multiple timeframes - Switch between Daily and Weekly to see if strength holds across different time horizons.
Monitor sector rotation - When sector goes from bearish to bullish rotation, it's often a great time to enter stocks in that sector.
Watch Industry vs Sector - Stocks in hot industries within hot sectors have double tailwinds. Prioritize Industry vs Sector positive values.
Pay attention to consistency - High RS Score with low consistency might be a spike that fades. Look for 70%+ consistency across BOTH sector and industry.
Use the leader comparison - If your stock consistently beats both sector leader AND industry leader, you may have found the next champion.
Watch days above/below sector - Long streaks (15+ days) indicate strong trends. Look for these in conjunction with high RS Score.
Set alerts on key stocks - Enable RS Score alerts at 70 threshold to get notified when watchlist stocks become strong.
Consider Beta for position sizing - Size smaller positions in high Beta stocks, larger in low Beta stocks for balanced risk.
Exit when RS Score drops - If a stock's RS Score falls below 60, consider reducing or exiting - the strength may be fading.
Leverage industry-level insight - If Industry ETF is weak but stock is strong, that's standout strength. If Industry is hot but stock is lagging, consider switching to the industry leader instead.
SETTINGS EXPLAINED
Display Settings:
Show Performance Table - Master on/off switch for the table
Table Position - 9 positions available (corners, edges, center)
Table Size - 4 sizes (tiny, small, normal, large) for different screen sizes
Timeframe Settings:
Chart Timeframe (recommended) - Dynamic, uses whatever chart TF you're on
Fixed Timeframes - Locks analysis to 1H, 4H, Daily, or Weekly regardless of chart
Filtering Settings:
Minimum RS Score - Set threshold (0-100) for displaying table
Show Warning - When enabled, displays message if stock doesn't meet filter
Alert Settings:
Divergence Alerts - Enable alerts when stock diverges from sector
Threshold (%) - How big a divergence triggers alert (default 5%)
RS Score Alerts - Enable alerts when RS Score crosses threshold
Threshold - What RS Score level triggers alert (default 70)
Sector Analysis Settings:
Use Custom Sector ETF - Override automatic sector ETF detection
Sector ETF Symbol - Enter any sector ETF to compare against
Use Custom Sector Leader - Override automatic sector leader detection
Sector Leader Symbol - Enter any ticker as sector leader
Industry Analysis Settings:
Use Custom Industry ETF - Override automatic industry ETF detection
Industry ETF Symbol - Enter specific industry ETF (e.g., IGV, SMH)
Use Custom Industry Leader - Override automatic industry leader detection
Industry Leader Symbol - Enter specific industry leader
Show Industry Analysis - Toggle all industry rows on/off
Display Settings:
Show Real-time Indicator - Toggle clock icon in header (doesn't affect data)
WHAT THIS INDICATOR DOESN'T DO
To set proper expectations:
Does NOT provide entry/exit signals - this is a strength analyzer, not a trading system
Does NOT predict future price movement - shows current and historical relative strength
Does NOT guarantee profits - strong RS stocks can still decline
Does NOT replace your own analysis - use as one tool among many
Does NOT work on stocks with no sector data - will adapt but some rows show N/A
This indicator is a decision support tool . It helps you identify which stocks are showing relative strength so you can make more informed trading decisions. You still need your own entry strategy, risk management, and position sizing rules.
SUPPORT & CONTACT
Questions or feedback? Use the comments section below or send me a message.
If you find this indicator useful, please give it a boost and share with other traders who might benefit from relative strength analysis.
FINAL REMINDER
This indicator is a tool for analyzing relative strength - it shows you which stocks are outperforming their sector and market. It does NOT provide financial advice or trade signals. Always conduct your own research, manage your risk appropriately, and consult with a financial advisor before making investment decisions.
Past performance of relative strength does not guarantee future results. Strong stocks can become weak, and sectors rotate in and out of favor. Use this indicator as part of a comprehensive trading strategy, not as a standalone decision-making system.
Trade smart, manage risk, and may your RS Scores stay high!
If you got till here and you like my work a BOOST and a COMMENT would make me happy
