ADX +- DiThis Adx +-Di is just a complete version of what the ADX is supposed to signal.
So you have:
15 (contraction), 20 (threshold), 30 (expansion), 40 (resistance) levels.
Below 20 the price is not trending
Above 30 the price is trending
Below 15 price has been in contraction for too long
Between 20 and 30 price is in a "transition zone".
I finally added a "Resistance" level (40), which has to be adapted to best represent the historical levels where price usually encounters resistance, and where the price can be declared "overtrending", which means a return to lower levels is likely to happen.
I've chosen mild colors, and set the Adx Color to White, because I use black background, you can easily change that.
Enjoy
-Maurice
Recherche dans les scripts pour "机械革命无界15+时不时闪屏"

GoTiT|Simple Auto Fib v1.0Simple Auto Fib!
Notes:
1. Always set the trend manually! Don't rely on the auto trend detection.
2. The first parameter Length sets the number of candles back (left) to search for highs and lows from the current candle.
3. The High Offset parameter sets the number of candles back (left) to ignore/skip before searching for highs.
4. The Low Offset parameter sets the number of candles back (left) to ignore/skip before searching for lows.
5. The offset parameters change the behavior of the Length parameter.
Example 1:
Length = 100
High Offset = 0
Low Offset = 0
This is the default behavior, and the search for highs and lows occurs on the last 100 candles.
Example 2:
Length = 50
High Offset = 20 (Ignore the last 20 candles, and search for highs starting at candle 21 to 71 (or 50 candles back)
Low Offset = 15 (Ignore the last 15 candles, and search for lows starting at candle 16 to 66 (or 50 candles back)
In example 2, search starts on candle 21 for highs, and candle 16 for lows and extends 50 candles further back from there.
6. The Trend Detection parameter sets the number of candles back (left) to use in the trend calculations. Larger values give better "marco trend" detection. Smaller values give better "micro trend" detection. See note #1.
7. The white fib line is fib0. Assuming you correctly set the trend manually (or the trend is auto detected correctly), in a downtrend fib0 should be bellow the red fib line, and in an uptrend fib0 should be above the red fib line.

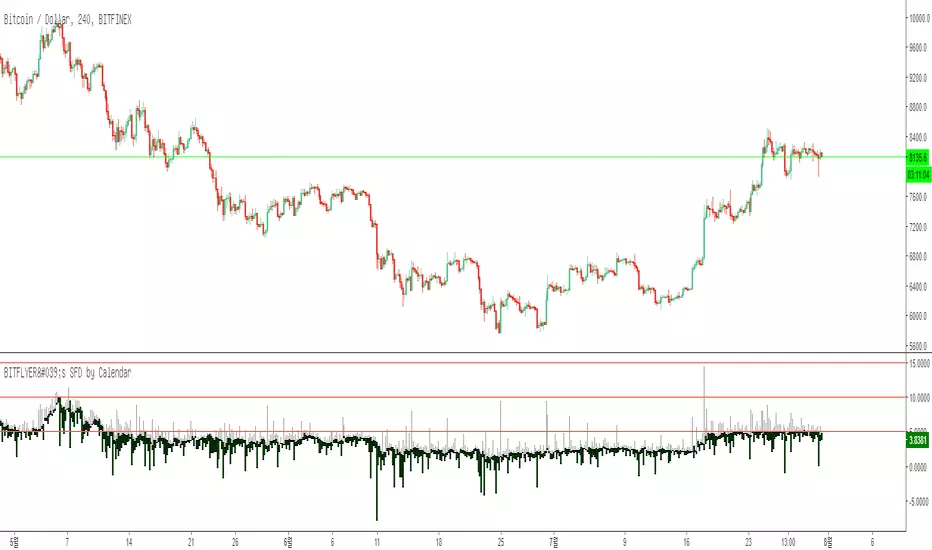
BITFLYER's SFD by CalendarHi guys, I am Calendar.
My first customized indicator is SFD difference in Bitflyer
Bitflyer exchange charges penalties to long postion if difference between FXBTC/JPY and BTC/JPY is more than 5, 10, 15, 20%
So, it is selling signal when the difference is higher than 5, 10, 15, 20%
Plz check “setting” -> “Scales” -> “Indicator Last Value”
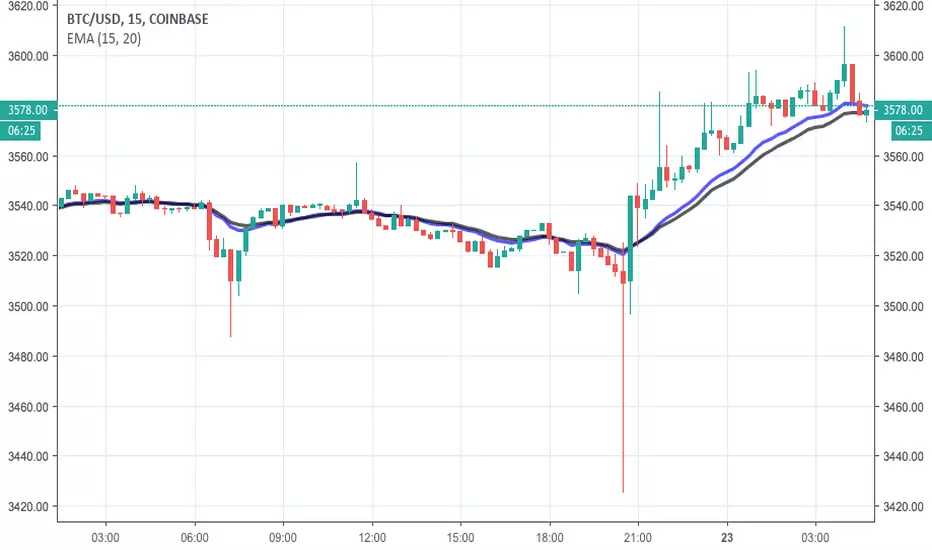
3 Linear Regression CurveFast 3LRC - 15/30/60 standard settings - 15/30 give a lot of noise, but give you a some time to prepare for the 60 to flip
Noro's OverCloud v1.2 MTFAdded big timeframe
MN = 1 month
W = 1 week
D = 1 day
240 = 4 hours
180 = 3 hours
120 = 2 hours
60 = 1 hours
30 = 30 min
15 = 15 min
etc...

Fractal Resonance BarLazyBear's WaveTrend port has been praised for highlighting trend reversals with precision and punctuality (minimal lag). But strong "3rd Wave" trends can "embed" or saturate any oscillator flashing several premature crosses while stuck overbought/oversold. This happens when the trend stretches over a longer timescale than the oscillator's averaging window or filter time constant. Our solution: monitor many timescales. With Fractal Resonance Bar's rich color codings, strong wavefronts form across timescales and jump out like an approaching line of thunderclouds!
Fractal Resonance Bar color-codes the status of eight underlying stochastic oscillators, with each row averaging over twice the time of the row above.
Fractal Resonance Bar shifts its timescales along with your choice of main chart timescale:
1 minute chart: 1 minute through 128 minute (~2 hour) oscillators.
15 minute chart: 15 minute through 1920 minute (~32 hour) oscillators.
1 hour chart: 1 hour through 128 hour (~2 week) oscillators.
Daily chart: 1 day through 128 day (~4 month) oscillators.
The color map is configured as follows:
Hot Pink: Extreme Overbought (> 100%) rolled over to sell, but oscillators probably embedded with more upside (revert to Dark Green) possible after a pause.
Deep Red: Overbought (> 75%) crossover ripe for selling (validated when red spreads to timescales below).
Brown: Minor (< 75%) crossover sell from which could bounce back green or start a plunge toward gray/black.
Gray/Black: Mature (< -75%) sells turning full black in a plunge before the dawn.
Lime Green: Extreme Oversold (< -100%) and bouncing, though may yet bottom even lower.
Green: Oversold (< -75%) crossover ripe for buy. Green spreading to all timescales below will validate bottom is in.
Dark Green/Teal: Mature buy in overbought (> 75%) range, waiting for sell crossover to Hot Pink for a pause or correction.
White Stripes are Impulsive Trend Warning
Fractal Resonance Bar warns of oscillator embedding by showing white stripes when it detects strong, early surges in the timescale rows below.The white stripes usually accompany Hot Pink warning it's too early to go short, or Lime Green warning it's too early to go long.
Heeding these warnings will probably miss the exact top or bottom, but you're less likely to get overrun in a momentum move.
Usually the market gives us a second opportunity to short very close to the top or buy very close to the bottom after the warning white stripes have subsided.
NOTE: Recently rolled over Futures contracts may not have enough history for all oscillator calculations, in which case no bar colors will appear.
Tweakable Attributes
The default Channel Length, Stochastic Ratio Length and Lag Length work reasonably well on all timescales in our experience. Minor tweaks don't hurt but this may just overfit to a particular chart history.
We don't recommend changing the 75% Overbought and 100% Extreme Overbought default levels as these are ideal numbers relative to the underlying oscillator statistic calculations. But these settings can shift the color transition levels.
Embedded attribute controls the sensitivity/conservativeness of the white strip embedding detectors. Closer to 75 increases the warning sensitivity while closer to 100 decreases the aggressiveness of blocking white stripes.
Embed Separation also affects the white stripe sensitivity.
Row width increases each row's thickness to fill the available screen height you've afforded the bar.

Trend and Entry CCI ST15This is a T3 CCI with a fast and slow line as well as extreme lines, a -15,15 filter to make zero line rejections and crosses more mechanical and help weed out whipsaw. I will probably update description in the future and get into more detail about how the indicator is used but for now if you want more info look up woodie CCI patterns :) Good Luck!!
extended session - Regular Opening-Range- JayyOpening Range and some other scripts updated to plot correctly (see comments below.) There are three variations of the fibonacci expansion beyond the opening range and retracements within the opening range of the US Market session - I have not put in the script for the other markets yet.
The three scripts have different uses and strengths:
The extended session script (with the script here below) will plot the opening range whether you are using the extended session or the regular session. (that is to say whether "ext" in the lower right hand corner is highlighted or not.). While in the extended session the opening range has some plotting issues with periods like 13 minutes or any period that is not divisible into 330 mins with a round number outcome (eg 330/60 =5.5. Therefore an hour long opening range has problems in the extended session.
The pre session script is only for the premarket. You can select any opening range period you like. I have set the opening range to be the full premarket session. If you select a different session you will have to unselect "pre open to 9:30 EST for Opening Range?" in the format section. The script defaults to 15 minutes in the "period Of Pre Opening Range?". To go back to the 4 am to 9:30 pre opening range select "pre open to 9:30 EST for Opening Range?" there is no automatic 330 minute selection.
The past days offset script only works in 5 min or 15 minute period. It will show the opening range from up to 20 days past over the current days price action. Use this for the regular session only. 0 shows the current day's opening range. Use the positive integers for number of days back ie 1, 2, 3 etc not -1, -2, -3 etc. The script is preprogrammed to use the current day (0).
Scripts updated to plot correctly: One thing they all have in common is a way of they deal with a somewhat random problem that shifts the plots 4 hours in one direction or the other ie the plot started at 9:30 EST or 1:30PM EST. This issue started to occur approximately June 22, 2015 and impacts any script that tried to use "session" times to manage a plot in my scripts. The issue now seems to have been resolved during this past week.
Just in case the problem reoccurs I have added a "Switch session plot?" to each script. If the plot looks funny check or uncheck the "Switch session plot?" and see the difference. Of course if a new issue crops up it will likely require a different fix.
I have updated all of the scripts shown on this chart. If you are using a script of mine that suffers from the compiler issue then you will find an update on this chart. You can get any and all of the scripts by clicking on the small sideways wishbone on the left middle of the chart. You will see a dialogue box. Then click "make it mine". This will import all of the scripts to your computer and you can play around with them all to decide what you want and what you don't want. This is the easiest way to get all of the scripts in one fell swoop. It is also the easiest way for me to make all of the scripts available. I do not have all of the plots visible since it is too messy and one of the scripts (pre OR) is only for the regular session. To view the scripts click on the blue eye to the right of the script title to show it on this script. If you can only use the regular session. The scripts will all (with the exception of the pre OR) work fine.
If for any reason this script seems flakey refresh the page r try a slightly different period. I have noticed that sometimes randomly the script loves to return to the 5 min OR. This is a very new issue transient issue. As always if you see an issue please let me know.
Cheers Jayy

BB 100 with Barcolors6/19/15 I added confirmation highlight bars to the code. In other words, if a candle bounced off the lower Bollinger band, it needed one more close above the previous candle to confirm a higher probability that a change in investor sentiment has reversed. Same is true for upper Bollinger band bounces. I also added confirmation highlight bars to the 100 sma (the basis). The idea is that lower and upper bands are potential points of support and resistance. The same is true of the basis if a trend is to continue. 6/28/15 I added a plotshape to identify closes above/below TLine. One thing this system points out is it operates best in a trend reversal. Consolidations will whipsaw the indicator too much. I have found that when this happens, if using daily candles, switch to hourly, 30 min, etc., to catch a better signal. Nothing moves in a straight line. As with any indicator, it is a tool to be used in conjunction with the art AND science of trading. As always, try the indicator for a time so that you are comfortable enough to use real money. This is designed to be used with "BB 25 with Barcolors".

BB 25 with Barcolors6/19/15 I added confirmation highlight bars to the code. In other words, if a candle bounced off the lower Bollinger band, it needed one more close above the previous candle to confirm a higher probability that a change in investor sentiment has reversed. Same is true for upper Bollinger band bounces. I also added confirmation highlight bars to the 100 sma (the basis). The idea is that lower and upper bands are potential points of support and resistance. The same is true of the basis if a trend is to continue. 6/28/15 I added a plotshape to identify closes above/below TLine. One thing this system points out is it operates best in a trend reversal. Consolidations will whipsaw the indicator too much. I have found that when this happens, if using daily candles, switch to hourly, 30 min, etc., to catch a better signal. Nothing moves in a straight line. As with any indicator, it is a tool to be used in conjunction with the art AND science of trading. As always, try the indicator for a time so that you are comfortable enough to use real money. This is designed to be used with "BB 100 with Barcolors".

KK_Intraday MAsHey guys,
today I was browsing through intraday Charts looking at some moving averages. Basically what I wanted to see was whether the currency pair was trading below or above the moving average of the day/week/month. For a better understanding: The daily MA on a 15 minute Forex Chart would be the 96 MA.
I encountered the problem that i always had to change the settings for my MAs when changing the Time Interval, so I coded this here up. It is pretty simple but maybe somebody else has the same problem and can put it to use.
The script has some settings as listed below:
Choice which MAs to plot, (Daily, Weekly, Monthly)
Choice which type of MA to use (Simple, Exponential, Weighted)
Neccesary Settings for the correct calculation (e.g. Number of trading hours per day). These settings depend on the instrument you are using and should always be checked before using this script.
There are a few things to Note when using this script:
This script works for intraday charts only.
The monthly MA doesn't work on any Time Interval smaller than 15 minutes. Can't do anything about it unfortunately.
This is my first published Script, use it with caution and let me know what you think about it!

Opening Range Breakout with 2 Profit Targets.Opening Range Breakout with 2 Profit Targets.
Updated Indicator now works on all Symbols with Many Different Session Options.
***Known PineScript Issue…While the Opening Range is being Formed the lines only adjust for that individual bar. Just reset Indicator after Opening Range Completes.
***All Times are Based on New York Time
Session Options Forex U.S. Banks Open (8:00), Gold U.S. Open (8:20), Oil U.S. Open (9:00), U.S. Cash Session - Stocks (9:30), NY Forex Open (17:00) , Europe Open (02:00), or if you choose Setting 0 the Session Runs from 00:00 to 00:00 (Midnight to Midnight).
***Ability to use 60 minute Opening Range, 30 minute, 15 minute, and many other options.
***However you can manually change the times in the Inputs Tab to adjust for any session you prefer. This is useful for Day Light Savings Adjustments. Also the default times work if your charts are set to EST Time. If you use A different time zone in your settings you need to Adjust the times in the inputs tab.
Initially Opening Range High and Low plot as Yellow Lines. If Price Goes Above Opening Range then Line Turns Green. If Price Goes Below Opening Range Line Turns Red.
By default the First Profit Target is 1/2 the Width of the Opening Range and the 2nd Profit Target is 1 Times the Opening Range. However these are Adjustable in the Inputs Tab.
By Default the Opening Range Length is 1 Hour. However, you can Change the Opening Range Length to 15 min, 30 min, 2 hours etc. in the Inputs Tab.
Plots a 1 Above or Below Candle when 1st Profit Target is Achieved, and a 2 when 2nd Profit Target is Achieved.

Indicator: Trend Trigger FactorIntroduced by M.H.Pee, Trend Trigger Factor is designed to keep the trader trading with the trend.
System rules according to the developer:
* If the 15-day TTF is above 100 (indicating an uptrend), you will want to be in long positions.
* If the 15-day TTF is below -100, you will want to be short.
* If it is between -100 and 100, you should remain with the current position.
More info:
Original Article by Mr.Pee: drive.google.com

Josh FXJoshFX Multi-Timeframe Levels & Fair Value Gap Indicator
This powerful TradingView indicator provides a comprehensive view of key market levels and trends across multiple timeframes. Designed for traders who want precise entries and market context, it includes:
Previous Daily Levels: Automatically marks the previous day’s High, Low, and 50% midpoint.
Multi-Timeframe Trend: Displays the trend direction for 5-minute, 15-minute, 1-hour, and 4-hour charts directly on your current chart.
Daily Candle Display: Shows the current daily candle for quick visual reference.
Pivot Points: Accurately marks technical highs and lows (pivot points) to the exact unit on the chart.
Fair Value Gaps (FVGs): Highlights areas of imbalance for potential high-probability trade setups.
JoshFX Telegram Watermark: Includes branding for the JoshFX community.
This all-in-one tool is perfect for traders combining price action, liquidity concepts, and multi-timeframe analysis to find high-quality setups efficiently.

ORB indicatorthis indicator marks out the first 15 min high and low on the candle that opens in each session, very easy to read and minimalist

Dynamic Support & Resistance ZonesDynamic Support & Resistance Zones
Overview
This indicator automatically detects and visualizes dynamic support and resistance zones based on pivot point analysis. Unlike simple horizontal lines, these zones adapt to market volatility using ATR and track how many times price has respected each level—giving you a real-time strength score for every zone.
How It Works
The indicator identifies swing highs and lows using pivot detection, then creates zones around these price levels. Each zone is continuously monitored for:
Touches: Every time price enters the zone and reverses, the touch count increases
Strength: A 0-100% score based on touch count and recency (zones fade over time if untested)
Breaks: When price closes beyond the zone for consecutive bars, it's marked as broken and removed
Nearby zones of the same type automatically merge to reduce clutter, and only the strongest zones are displayed based on your settings.
Features
🎯 Smart Zone Detection
Pivot-based identification of key price levels
ATR-adaptive zone width (adjusts to volatility)
Automatic merging of overlapping zones
📊 Strength Scoring System
Each zone rated 0-100% based on touches + time decay
Stronger zones appear more opaque
Weak/old zones automatically removed
🔔 Built-in Alerts
Alert when price approaches a zone
Alert when price breaks through a zone
📋 Info Panel
Shows count of active resistance/support zones
Displays nearest S/R levels above and below current price
Settings
Detection Settings
Pivot Lookback Length - Higher values find stronger but fewer levels (default: 10)
Zone Width (%) - Width of each zone as % of price (default: 0.5%)
Max Zones to Display - Limits visual clutter (default: 8)
Merge Distance (%) - Zones within this % are combined (default: 1.0%)
Zone Strength
Min Touches for Valid Zone - Zones need this many touches to display (default: 2)
Strength Decay (bars) - How quickly zones lose strength over time (default: 100)
Break Confirmation Bars - Consecutive closes needed to confirm a break (default: 2)
Visual Settings
Customize resistance/support colors
Toggle labels and strength display
Option to extend zones into the future
How to Use
For Entries:
Look for confluence when price approaches a high-strength zone (70%+)
Zones with 3+ touches have historically acted as strong reversal points
Use the "approaching zone" alert to get notified before price reaches key levels
For Exits/Targets:
Set profit targets at the nearest resistance (for longs) or support (for shorts)
The info panel shows these levels in real-time
For Breakout Trading:
Watch for breaks of high-touch zones—these often lead to momentum moves
Use the "broke zone" alert to catch breakouts as they happen
Best Practices
On higher timeframes (4H, Daily): Use higher pivot lookback (15-20) for major levels
On lower timeframes (5m, 15m): Use lower pivot lookback (5-8) for scalping levels
For volatile assets: Increase zone width to 1-2%
For ranging markets: Lower min touches to 1 to see more potential levels
Notes
Zones are drawn from the time they were created, extending right
The indicator uses timestamps (not bar indices) so it works on any history length
Broken zones are automatically cleaned up to keep your chart clear
Tip: Combine with volume analysis or momentum indicators for confirmation before trading S/R levels.
If you find this indicator useful, please leave a comment with your feedback or suggestions for improvements!
Custom Multi-Style Candlestick Chart (Arjo)Custom Multi-Style Candlestick Chart
View the same market through different candle-types to spot structure, trend, and volatility more clearly.
This indicator lets you view price action using several alternative candlestick styles, including Traditional , Smooth , Hull , EMA-based , Median-based , Heikin-Ashi , and more.
Instead of changing charts manually, you can instantly switch between different candle types in a single panel, even for other chart symbols.
Different smoothing techniques highlight different aspects of market behaviour — trend clarity , volatility compression, swing structure, and momentum. This tool helps traders see those variations quickly without altering their main chart settings .
What This Indicator Does
1. Displays multiple candle-types
From the settings panel, you can choose:
Traditional Candles – Standard OHLC data.
Heikin-Ashi – Smooths out noise and shows cleaner trend flow.
Smooth Candles – Uses a SuperSmooth filter to reduce short-term volatility.
Hull Candles – Uses Hull MA smoothing for fast trend visualization.
EMA Candles – Uses EMA-smoothed OHLC values.
Median Candles – Shows median-filtered OHLC values for noise reduction.
Custom Candles – A special formula using previous bars to create a balanced pivot-style open.
Each candle type offers a slightly different look at the same market.
2. Uses the Same Symbol & Timeframe
The indicator always uses:
the same timeframe as your chart , and
the symbol you select (Chart Symbol or Custom Symbol )
This makes it easy to compare the alternative candles directly with the price.
3. Includes Dynamic Support & Resistance
The indicator calculates:
20-period EMA (trend centerline)
ATR-based support and resistance levels
These levels help traders see where the price may find pressure or relief during normal volatility.
4. Shows Trend Strength (ADX Background Color)
The background becomes lighter or darker depending on ADX strength:
Low ADX (below 15) → Market may be quiet or range-bound
Higher ADX → Trend may be strengthening
This is only a visual guide and not a signal.
-------------------------------------------------------------------------------
How to Use It
----------------------------------------------------------------------
1. Choose a candle type from the settings.
Try switching between Smooth, Hull, Median, Heikin-Ashi, or other to see which gives you the clearest structure .
2. Compare the smoothed candles with the real price
Smoothed candles remove noise. They help to:
identify swing direction
spot trend strength
study clean momentum behaviour
3. Use the EMA-20 + ATR bands
These bands help you see natural dynamic support and resistance zones based on both trend and volatility.
4. Background color helps understand trend conditions
When the ADX is low , the background becomes slightly shaded to warn of choppy or low-momentum sessions.
5. Use with other tools
This indicator is intended solely as a visual aid.
You may combine it with your own signals, patterns, or risk-management methods.
Disclaimer
This indicator does not generate buy/sell signals.
It is meant for visual analysis only.
It does not predict future prices or guarantee any outcome.
Always use proper risk management and confirm decisions with your own analysis.
Happy Trading (ARJO)

PyraTime: Tesla Trinity [LITE] | 3-6-9 Time CyclesThe Algorithm of the Universe
"If you knew the magnificence of the 3, 6, and 9, you would have a key to the universe." — Nikola Tesla
Most traders analyze Price (the Y-axis) but completely ignore the most critical dimension: Time (the X-axis).
PyraTime: Tesla Trinity is a harmonic time projector. It moves beyond standard technical analysis by translating the ancient Solfeggio Frequencies directly into time cycles on your chart.
How It Works
This indicator projects the 9 core Solfeggio frequencies as specific time intervals anchored to a user-defined "Origin Pivot." When these invisible time harmonics align, they create "Time Clusters"—high-probability zones where market energy is likely to pivot, reverse, or expand.
The 3-6-9 Sequences
The indicator visualizes three distinct energy groups:
🔴 The Grounding Trinity (174Hz - 396Hz): Foundation & Stability.
🟢 The Transformation Trinity (417Hz - 639Hz): Change & Acceleration.
🔵 The Awakening Trinity (741Hz - 963Hz): Spiritual Peak & Completion.
How to Use (LITE Version)
Find the Origin: Identify a major market structure point (e.g., a Swing High or Low).
Set the Anchor: In the settings, input the exact time of that pivot into the "Origin Pivot" field.
Watch the Clusters: Look for areas where multiple frequency lines converge.
Example: A Grounding line (Red) and an Awakening line (Blue) overlapping often signals a trend reversal.
Included in LITE Version
✅ 1-Minute Fractals: For scalping and micro-cycle analysis.
✅ 15-Minute Fractals: For intraday trend identification.
✅ Full Harmonic Spectrum: All 9 Solfeggio frequencies included.
Want the Master Edition?
The Master Edition unlocks the "Hidden Fractals" used by institutional harmonic traders:
🔓 The "4x" Suite: 4-minute, 40-minute, and 4-hour projection cycles.
🔓 Macro Cycles: Hourly and Daily projections for Swing Trading.
🔓 Golden Anchor: Advanced precision tools.
"Search 'PyraTime' for the Master Edition."
Disclaimer: This tool is for educational and experimental purposes only. Trading involves risk.

Ultimate Trend System — Multi-Timeframe State MachineThis indicator is built for high-frequency and intraday trading (such as Micro Silver futures) and features advanced multi-timeframe signal logic:
Signal stability: BUY, SELL, and STOP are managed as a state machine. Trade signals appear only when the state changes, preventing clutter and making execution cleaner.
Multi-timeframe filtering: Trade signals on your main chart (e.g., 2-minute) are filtered by the dominant trend from higher timeframes (15min SMA and VWAP). Entry signals only appear when aligned with the higher timeframe trend.
Momentum confirmation: ATR (volatility) and QQE (momentum) must also confirm the trend direction before a signal appears.
STOP state: Only appears after a BUY or SELL state if a reversal or noise situation is detected (such as a fake breakout), helping you step aside during poor conditions.
Fakeout detection: The script identifies fake breakouts to avoid entering trades on unreliable price moves.
Optional SuperTrend module: Enable for additional trend filtering if required.
Easy to tune: All main logic and filters are parameters you can further adjust based on your own strategy tests.
Designed for day trading, trend-following algorithms, and backtesting workflows. Gives clear, uncluttered execution signals only in meaningful market regimes. Test, share your results, and feel free to optimize parameters for your own style!
本脚本针对微型银等高频短线交易场景设计,信号逻辑采用多时间框架趋势过滤 + 动能共振。具体特性如下:
主信号只在状态切换时显示,BUY/SELL/STOP互斥,避免信号堆积,更便于实盘执行。
信号触发条件需同时满足短周期动能(ATR、QQE)及15分钟趋势(SMA、VWAP)过滤,仅在趋势顺势区间出现BUY或SELL。
STOP信号仅在出现实际交易信号后才有可能触发,严格控制观望/退出点,提高策略稳健性。
FAKEOUT逻辑干扰信号,避免假突破和无效行情参与。
可选SuperTrend模块开关,进一步增强趋势识别过滤。
适合日内交易、算法跟随、程序化回测场景。欢迎回测、交流及参数联调优化!

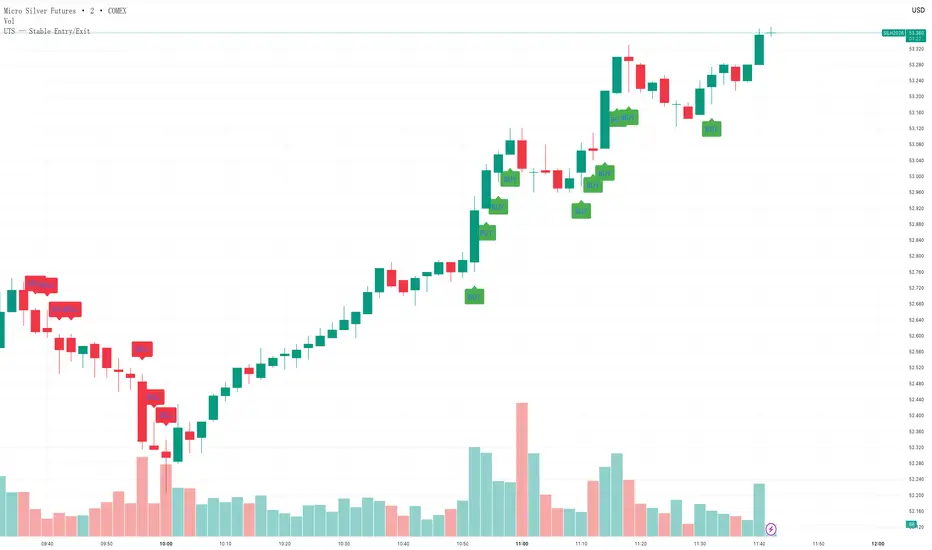
UTS — Stable Entry/ExitThis is the stable version of Ultimate Trend System (UTS) focusing on clean and reliable entry/exit signals.
✔ No repaint
✔ No complex state machine
✔ No external dependencies
✔ No CHOP (to avoid Pine v6 errors)
✔ No 15-minute filters (ensures signals appear in real time)
✔ BUY = Supertrend Up + QQE Up + ATR Up
✔ SELL = Supertrend Down + QQE Down + ATR Up
✔ STOP = Trend weakening or volatility contraction
This version is specifically designed for traders who need:
- clear, stable, non-noisy signals
- fast real-time ENTRY/EXIT markers
- zero script errors during publication
- minimal false positives while not missing trend moves
Perfect for scalping / intraday futures like MGC, SIL, MHG, GC, CL, ES, NQ.
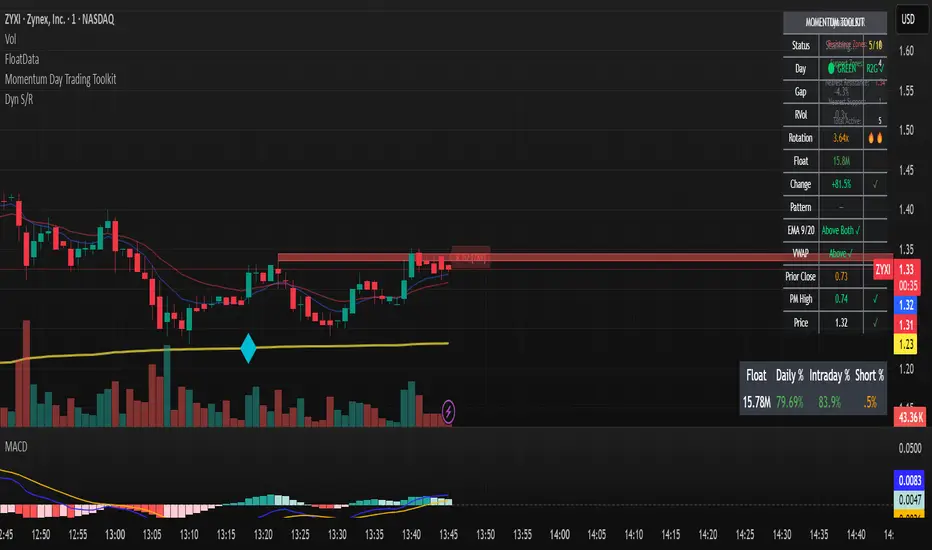
Momentum Day Trading ToolkitMomentum Day Trading Toolkit
Complete User Guide
Table of Contents
Overview
Quick Start
The Dashboard
Module 1: 5 Pillars Screener
Module 2: Gap & Go
Module 3: Bull Flag / Flat Top
Module 4: Float Rotation
Module 5: R2G / G2R
Module 6: Micro Pullback
Signal Reference
Quality Score
Settings Guide
Alerts Setup
Trading Workflows
Troubleshooting
Overview
The Momentum Day Trading Toolkit combines 6 powerful indicators into one unified system for day trading momentum stocks.
ModulePurpose① 5 PillarsConfirms stock is "in play"② Gap & GoPre-market levels & gap analysis③ Bull Flag / Flat TopClassic breakout patterns④ Float RotationMeasures true interest level⑤ R2G / G2RTracks prior close crosses⑥ Micro PullbackPrecision continuation entries
All modules work together - the dashboard shows you everything at a glance, and you can enable/disable any module you don't need.
Quick Start
Step 1: Add to Chart
Add the indicator to any stock chart
Recommended timeframes: 1-minute, 5-minute, or 15-minute
Step 2: Check the Dashboard (Top Right)
Look for:
Status = Current state (Scanning, Entry Signal, etc.)
Quality Score = Setup rating out of 10
Green checkmarks (✓) = Criteria passing
Step 3: Watch for Entry Signals
Triangles, circles, diamonds below bars = Entry signals
Arrows = R2G/G2R crosses
Step 4: Set Alerts
Right-click chart → Add Alert
Select "Momentum Day Trading Toolkit"
Choose your alert condition
The Dashboard
The dashboard in the top-right corner gives you instant analysis:
┌─────────────────────────────┐
│ MOMENTUM TOOLKIT │
├─────────────────────────────┤
│ Status │ 🎯 ENTRY SIGNAL │
│ Day │ 🟢 GREEN │
│ Gap │ +8.5% 🔥 │
│ RVol │ 3.2x ✓ │
│ Rotation │ 1.45x 🔥 │
│ Float │ 5.2M 🔥 │
│ Change │ +12.3% ✓ │
│ Pattern │ BULL FLAG! │
│ EMA 9/20 │ Above Both ✓ │
│ VWAP │ Above ✓ │
│ Prior Cl │ 5.91 │
│ PM High │ 9.11 ✓ │
│ Price │ 9.46 ✓ │
└─────────────────────────────┘
Dashboard Row Reference
RowWhat It ShowsGood ValuesStatusCurrent state🎯 ENTRY SIGNALDayGreen/Red vs prior close🟢 GREENGapGap % from prior close🔥 (5%+) or 🔥🔥 (10%+)RVolRelative volume✓ (2x+) or ✓✓ (5x+)RotationFloat rotation🔥 (1x) or 🔥🔥 (2x+)FloatFloat in millions🔥 (<5M) or Low (<10M)ChangeDaily % change✓ (meets minimum)PatternPattern statusBREAKOUT!EMA 9/20Trend positionAbove Both ✓VWAPVWAP positionAbove ✓Prior CloseKey R2G levelReference pricePM HighPre-market high✓ = Above itPriceCurrent price✓ = In range
Status Messages
StatusMeaningActionScanning...Looking for setupsWait✅ ALL PILLARSStock qualifiesWatch for pattern⏳ PATTERN FORMINGSetup developingGet ready🎯 ENTRY SIGNALSignal triggeredExecute trade
Module 1: 5 Pillars Screener
What It Does
Confirms the stock meets basic criteria to be worth trading.
The 5 Pillars
PillarDefaultWhy It MattersRelative Volume2x+ (5x for "strong")Confirms unusual interestDaily Change5%+Stock is movingPrice Range$1-$20Sweet spot for momentumFloat Size<20M sharesLower float = bigger moves
Visual Indicator
Green background appears when ALL pillars pass
Dashboard Shows
Individual pillar status with ✓ checkmarks
Quality score includes pillar factors
Settings
SettingDefaultDescriptionMin RVol2.0xMinimum relative volumeStrong RVol5.0xVolume for full qualificationMin Change5%Minimum daily moveMin Price$1Minimum stock priceMax Price$20Maximum stock priceMax Float20MMaximum float size
Module 2: Gap & Go
What It Does
Analyzes pre-market gaps and displays key price levels.
Key Levels Displayed
LevelColorDescriptionPrior CloseOrangeYesterday's close - THE key levelPM HighGreenPre-market high - breakout levelPM LowRedPre-market low - support
Gap Classification
Gap SizeRatingMeaning5-9.9%🔥 QualifyingWorth watching10%+🔥🔥 StrongHigh priority
Entry Signal
Small green triangle = PM High Breakout
How to Trade
Stock gaps up in pre-market
Wait for market open
Look for break above PM High
Enter on breakout with stop below PM Low
Settings
SettingDefaultDescriptionMin Gap %5%Qualifying gap thresholdStrong Gap %10%Strong gap thresholdShow PM LevelsONDisplay PM high/low lines
Module 3: Bull Flag / Flat Top
What It Does
Detects classic continuation patterns and signals breakouts.
Bull Flag Pattern
▲ BREAKOUT (Entry Signal)
│
┌────┴────┐
│ Pullback │ ← 2-5 red candles
│ (flag) │ Max 50% retrace
└─────────┘
│
┌────┴────┐
│ Pole │ ← 3+ green candles
│ (move) │ Strong momentum
└─────────┘
Flat Top Pattern
═══════════════ Resistance (2+ touches)
│
▲ BREAKOUT above resistance
Entry Signals
SignalShapeColorPatternBull Flag Breakout▲ TriangleLimeFlag breaks upFlat Top Breakout◆ DiamondAquaResistance breaks
How to Trade Bull Flag
See 3+ green candles (the pole)
Price pulls back 2-5 red candles
Pullback stays above 50% of move
Enter on break above pullback high
Stop below pullback low
Settings
SettingDefaultDescriptionMin Pole Candles3Green candles neededMax Pullback5Max red candles allowedMax Retrace50%Max pullback depthFT Touches2Resistance touches neededFT Lookback10Bars to check for resistance
Module 4: Float Rotation
What It Does
Tracks how many times the entire float has traded hands today.
The Formula
Rotation = Cumulative Day Volume ÷ Float
Rotation Levels
RotationEmojiMeaning0.5x—Half float traded1.0x🔥FULL rotation - significant!2.0x🔥🔥Double rotation - extreme3.0x+🔥🔥🔥Triple rotation - rare event
Why It Matters
High rotation = Extreme interest
Everyone who owns shares has likely traded
Often precedes explosive moves
Shows "real" demand beyond just volume
Dashboard Shows
Current rotation level
Fire emojis for milestones
Settings
SettingDefaultDescriptionFloat SourceAutoAuto-detect or manualManual Float10MIf auto fails, use thisAlert Level1.0xAlert when rotation hits this
Module 5: R2G / G2R
What It Does
Tracks when price crosses the prior day's close - a key psychological level.
Red to Green (R2G) 🟢
Prior Close ─────────────────
↗ CROSS TO GREEN
↗
(opened red)
Stock opened below prior close (red)
Crosses above prior close (green)
BULLISH signal
Green to Red (G2R) 🔴
(opened green)
↘
↘ CROSS TO RED
Prior Close ─────────────────
Stock opened above prior close (green)
Crosses below prior close (red)
BEARISH signal
Entry Signals
SignalShapeColorMeaningR2G↑ ArrowLimeCrossed to greenG2R↓ ArrowRedCrossed to red
Why R2G Matters
Bears who shorted get squeezed
Creates FOMO buying
Prior close becomes support
Momentum often continues
Dashboard Shows
Current day status (🟢 GREEN / 🔴 RED)
Whether R2G or G2R occurred (R2G ✓ or G2R ✓)
Settings
SettingDefaultDescriptionRequire Opposite OpenONR2G needs red openShow Prior CloseONDisplay the line
Module 6: Micro Pullback
What It Does
Finds precision entries on brief 1-3 candle pullbacks after strong moves.
The Pattern
▲ ENTRY (break pullback high)
│
┌──┴───┐
│ 1-3 │ ← Micro pullback (brief!)
│ red │ Stop = low of this
└──────┘
│
┌──┴───┐
│ 3+ │ ← Strong move
│green │ Momentum building
└──────┘
Why Micro Pullbacks Work
Tight stop = Pullback low is close
Momentum intact = Only paused briefly
Early entry = Catch continuation early
Clear trigger = Break of pullback high
Entry Signal
SignalShapeColorMicro Pullback Entry● CircleYellow
How to Trade
See 3+ green candles (strong move)
1-3 red candles (brief pause)
Pullback stays above 50% retrace
Enter when green candle breaks pullback high
Stop at pullback low
Settings
SettingDefaultDescriptionMin Green Candles3Candles before pullbackMax Pullback3Max red candlesMax Retrace50%Max pullback depth
Signal Reference
All Entry Signals (Below Bar)
ShapeColorSignalModule▲ Large TriangleLimeBull Flag BreakoutPatterns◆ DiamondAquaFlat Top BreakoutPatterns● CircleYellowMicro Pullback EntryMicro PB▲ Small TriangleGreenPM High BreakoutGap & Go↑ ArrowLimeRed to GreenR2G/G2R
Warning Signals (Above Bar)
ShapeColorSignalModule↓ ArrowRedGreen to RedR2G/G2R
Optional Forming Signals (Disabled by Default)
ShapeColorSignal🚩 FlagFaded LimeBull Flag Forming● CircleFaded YellowMicro PB Forming
Enable "Show 'Forming' Markers" in settings to see these
Quality Score
The quality score (0-10) rates the overall setup strength.
Scoring Breakdown
FactorPointsRVol 5x++2RVol 2x++1Daily change 5%++1Low float (<20M)+1Strong gap (10%+)+2Qualifying gap (5%+)+1Rotation 1x++2Rotation 0.5x++1Above EMA 20+1
Score Interpretation
ScoreGradeAction8-10A+Best setups - full position6-7AGood setups - standard size4-5BAverage - reduced size0-3CWeak - skip or paper trade
Settings Guide
Module Toggles
Turn each module ON/OFF:
SettingDefaultDescription① 5 Pillars ScreenerONStock qualification② Gap & Go AnalysisONGap & level analysis③ Bull Flag / Flat TopONPattern detection④ Float RotationONRotation tracking⑤ R2G / G2R TrackerONPrior close crosses⑥ Micro PullbackONPullback entries
Visual Settings
SettingDefaultDescriptionShow DashboardONDisplay info tableTable SizeNormalSmall/Normal/LargeShow Entry SignalsONDisplay entry shapesShow 'Forming' MarkersOFFShow pattern formingShow Key LevelsONPrior close, PM levelsShow EMA 9/20ONTrend EMAsShow VWAPONVWAP line
Recommended Presets
Minimal (Clean Chart)
Show Dashboard: ON
Show Entry Signals: ON
Show 'Forming' Markers: OFF
Show Key Levels: OFF
Show EMA: OFF
Show VWAP: OFF
Standard (Balanced)
All defaults
Full Analysis
All settings ON
Alerts Setup
Available Alerts
AlertTriggerAny Bullish EntryAny entry signal firesBull Flag BreakoutBull flag breaks outFlat Top BreakoutFlat top breaks outMicro Pullback EntryMicro PB triggersPM High BreakoutBreaks above PM highRed to GreenR2G crossGreen to RedG2R crossFloat RotationHits rotation level5 Pillars PassAll pillars qualifyPattern FormingPattern starts formingHigh Quality EntryEntry with score 7+/10
How to Set Alerts
Right-click on chart
Select "Add Alert"
Condition: "Momentum Day Trading Toolkit"
Select alert type from dropdown
Set expiration and notifications
Click "Create"
Recommended Alerts
For Active Trading:
Any Bullish Entry
High Quality Entry
For Watchlist Monitoring:
5 Pillars Pass
Float Rotation
Trading Workflows
Workflow 1: Full Qualification
Step 1: 5 PILLARS
└─→ Wait for "✅ ALL PILLARS" status
Step 2: CHECK SETUP
└─→ Quality score 6+?
└─→ Above EMA and VWAP?
Step 3: WAIT FOR ENTRY
└─→ Bull Flag, Flat Top, or Micro PB signal
Step 4: EXECUTE
└─→ Enter on signal
└─→ Stop below pattern low
└─→ Target 2:1 minimum
Workflow 2: Gap & Go
Step 1: PRE-MARKET
└─→ Stock gaps 5%+ (shows in Gap row)
Step 2: MARKET OPEN
└─→ Note PM High level (green line)
Step 3: WAIT FOR BREAK
└─→ PM High Breakout signal (small triangle)
Step 4: CONFIRM
└─→ R2G if opened red (double confirmation)
└─→ RVol 2x+
Step 5: EXECUTE
└─→ Enter on PM High break
└─→ Stop below PM Low
Workflow 3: Micro Pullback Scalp
Step 1: FIND MOMENTUM
└─→ Stock moving, 3+ green candles
Step 2: WAIT FOR PAUSE
└─→ 1-3 red candles (brief pullback)
Step 3: ENTRY
└─→ Yellow circle signal appears
Step 4: QUICK TRADE
└─→ Enter at signal
└─→ Tight stop at pullback low
└─→ Quick target (1:1 to 2:1)
Troubleshooting
Q: Lines are moving/jumping on real-time chart?
A: This was fixed in latest version. Make sure you have the newest code. Lines now lock in place at market open.
Q: Too many signals, chart is cluttered?
A:
Turn off "Show 'Forming' Markers"
Disable modules you don't need
Use "Minimal" visual preset
Q: No signals appearing?
A:
Check if "Show Entry Signals" is ON
Make sure relevant module is enabled
Stock may not meet pattern criteria
Q: Dashboard shows wrong float?
A:
TradingView float data isn't available for all stocks
Switch Float Source to "Manual"
Enter correct float in millions
Q: PM High/Low not showing?
A:
Only appears during market hours
Needs pre-market data to calculate
Check if "Show Key Levels" is ON
Q: Quality score seems wrong?
A:
Score updates in real-time
Check individual factors in dashboard
RVol and rotation change throughout day
Q: Alert not triggering?
A:
Make sure alert is set on correct symbol
Check alert hasn't expired
Verify condition is set correctly
Quick Reference Card
Entry Signals
▲ Lime Triangle = Bull Flag Breakout
◆ Aqua Diamond = Flat Top Breakout
● Yellow Circle = Micro Pullback
▲ Green Triangle = PM High Break
↑ Lime Arrow = R2G (bullish)
↓ Red Arrow = G2R (bearish)
Dashboard Quick Read
🎯 = Entry signal active
✅ = All pillars pass
🟢 = Day is green
🔥 = Strong (gap/rotation)
✓ = Criteria met
✗ = Criteria failed
Quality Score
8-10 = A+ (Best)
6-7 = A (Good)
4-5 = B (Average)
0-3 = C (Weak)
Key Levels
Orange Line = Prior Close (R2G level)
Green Line = PM High (breakout level)
Red Line = PM Low (support)
Purple Line = VWAP
Yellow/Orange = EMA 9/20
Happy Trading! 🎯📈
For questions or issues, use TradingView's comment section on the indicator page.

Pivot Reversal Signals - Multi ConfirmationPivot Reversal Signals - Multi-Confirmation System
Overview
A comprehensive reversal detection indicator designed for daytraders that combines six independent technical signals to identify high-probability pivot points. The indicator uses a scoring system to classify signal strength as Weak, Medium, or Strong based on the number of confirmations present.
How It Works
The indicator monitors six key reversal signals simultaneously:
1. RSI Divergence - Detects when price makes new highs/lows but RSI shows weakening momentum
2. MACD Divergence - Identifies divergence between price action and MACD histogram
3. Key Level Touch - Confirms price is at significant support/resistance (previous day high/low, premarket high/low, VWAP, 50 SMA)
4. Reversal Candlestick Patterns - Recognizes bullish/bearish engulfing, hammers, and shooting stars
5. Moving Average Confluence - Validates bounces/rejections at stacked moving averages (9/20/50)
6. Volume Spike - Confirms increased participation (default: 1.5x average volume)
Signal Strength Classification
• Weak (3/6 confirmations) - Small circles for situational awareness only
• Medium (4/6 confirmations) - Regular triangles, viable entry signals
• Strong (5-6/6 confirmations) - Large triangles with background highlight, highest probability setups
Visual Features
• Entry Signals: Green triangles (up) for long entries, red triangles (down) for short entries
• Exit Warnings: Orange X markers when opposing signals appear
• Signal Labels: Show confirmation score (e.g., "5/6") and strength level
• Key Levels Displayed:
o Previous Day High/Low - Solid green/red lines (uses actual daily data)
o Premarket High/Low - Blue/orange circles (4:00 AM - 9:30 AM EST)
o VWAP - Purple line
o Moving Averages - 9 EMA (blue), 20 EMA (orange), 50 SMA (red)
• Background Tinting: Subtle color on strongest reversal zones
Key Level Detection
The indicator uses request.security() to accurately fetch previous day's high/low from daily timeframe data, ensuring precise level placement. Premarket high/low levels are dynamically tracked during premarket sessions (4:00 AM - 9:30 AM EST) and plotted throughout the trading day, providing critical support/resistance zones that often influence price action during regular hours.
Customizable Parameters
• Signal strength thresholds (adjust required confirmations)
• RSI settings (length, overbought/oversold levels)
• MACD parameters (fast/slow/signal lengths)
• Moving average periods
• Volume spike multiplier
• Toggle individual display elements (levels, MAs, labels)
Best Practices
• Use on 5-minute charts for entries, confirm on 15-minute for direction
• Focus on Medium and Strong signals; Weak signals provide context only
• Strong signals (5-6 confirmations) have the highest win rate
• Pay special attention to reversals at premarket high/low - these levels frequently hold
• Previous day high/low often acts as major support/resistance
• Always use proper risk management and stop losses
• Works best in moderately trending markets
Alert Capabilities
Set custom alerts for:
• Strong long/short signals
• All entry signals (medium + strong)
• Exit warnings for open positions
Ideal For
• Daytraders and scalpers (especially SPY, QQQ, and liquid equities)
• Swing traders seeking precise entries
• Traders who prefer confirmation-based systems
• Anyone looking to reduce false signals with multi-factor validation
• Traders who utilize premarket levels in their strategy
Technical Notes
• Uses Pine Script v6
• Premarket hours: 4:00 AM - 9:30 AM EST
• Previous day levels pulled from daily timeframe for accuracy
• Maximum 500 labels to maintain chart performance
• All key levels update dynamically in real-time
________________________________________
Note: This indicator provides signal analysis only and should be used as part of a complete trading strategy. Past performance does not guarantee future results. Always practice proper risk management.
