Average RSI (Daily + Weekly)📈 Average RSI (Relative Strength Index) – Beginner’s Guide
What it is:
The Average RSI is a technical indicator that combines multiple RSI values—such as daily and weekly RSI—into a single, smoothed line. This helps traders get a clearer picture of a stock’s momentum over both short- and medium-term timeframes.
Why it matters:
The RSI tells you whether a stock is potentially overbought (priced too high and due for a pullback) or oversold (priced too low and due for a bounce). Traditional RSI uses a scale from 0 to 100, with key levels at 70 (overbought) and 30 (oversold).
By averaging RSI across different timeframes, you reduce noise and get a better signal for trends and reversals.
How traders use it:
✅ Buy zone: When the average RSI dips below 40, it could signal a good entry point.
⚠️ Neutral zone: Between 40 and 60 means the trend isn’t strong—wait for more confirmation.
🚫 Sell zone: Above 60–70 may indicate the asset is overbought or due for a pullback.
Helpful for:
Spotting better entry/exit points
Filtering out false signals
Staying in trend-following trades longer
Recherche dans les scripts pour "涨幅超过60日均线的股票"

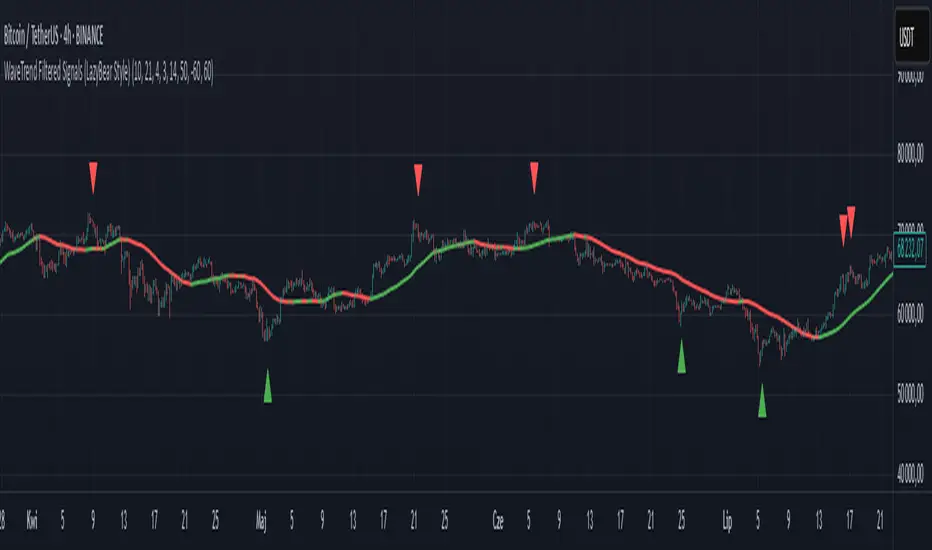
WaveTrend Filtered Signals (LazyBear Style)WaveTrend Filtered Signals (LazyBear Style)
This indicator is based on the popular WaveTrend oscillator (LazyBear) and adds several optional filters to improve signal quality:
✅ Available filters:
WT oversold/overbought zones – enabled by default. Signals are shown only if WT was previously in the specified zone (e.g., < -60 for longs, > 60 for shorts).
SMA trend filter – allows filtering signals in the direction of the moving average trend.
SMA position filter – signals appear only when price is above (for long) or below (for short) the moving average.
Consolidation filter – ignores signals during low-volatility sideways price movement.
💡 All filters are optional and can be enabled or disabled in the settings.
The default setup focuses on a clean approach: WaveTrend + oversold/overbought zones, with other filters left for customization.
Bober XM v2.0# ₿ober XM v2.0 Trading Bot Documentation
**Developer's Note**: While our previous Bot 1.3.1 was removed due to guideline violations, this setback only fueled our determination to create something even better. Rising from this challenge, Bober XM 2.0 emerges not just as an update, but as a complete reimagining with multi-timeframe analysis, enhanced filters, and superior adaptability. This adversity pushed us to innovate further and deliver a strategy that's smarter, more agile, and more powerful than ever before. Challenges create opportunity - welcome to Cryptobeat's finest work yet.
## !!!!You need to tune it for your own pair and timeframe and retune it periodicaly!!!!!
## Overview
The ₿ober XM v2.0 is an advanced dual-channel trading bot with multi-timeframe analysis capabilities. It integrates multiple technical indicators, customizable risk management, and advanced order execution via webhook for automated trading. The bot's distinctive feature is its separate channel systems for long and short positions, allowing for asymmetric trade strategies that adapt to different market conditions across multiple timeframes.
### Key Features
- **Multi-Timeframe Analysis**: Analyze price data across multiple timeframes simultaneously
- **Dual Channel System**: Separate parameter sets for long and short positions
- **Advanced Entry Filters**: RSI, Volatility, Volume, Bollinger Bands, and KEMAD filters
- **Machine Learning Moving Average**: Adaptive prediction-based channels
- **Multiple Entry Strategies**: Breakout, Pullback, and Mean Reversion modes
- **Risk Management**: Customizable stop-loss, take-profit, and trailing stop settings
- **Webhook Integration**: Compatible with external trading bots and platforms
### Strategy Components
| Component | Description |
|---------|-------------|
| **Dual Channel Trading** | Uses either Keltner Channels or Machine Learning Moving Average (MLMA) with separate settings for long and short positions |
| **MLMA Implementation** | Machine learning algorithm that predicts future price movements and creates adaptive bands |
| **Pivot Point SuperTrend** | Trend identification and confirmation system based on pivot points |
| **Three Entry Strategies** | Choose between Breakout, Pullback, or Mean Reversion approaches |
| **Advanced Filter System** | Multiple customizable filters with multi-timeframe support to avoid false signals |
| **Custom Exit Logic** | Exits based on OBV crossover of its moving average combined with pivot trend changes |
### Note for Novice Users
This is a fully featured real trading bot and can be tweaked for any ticker — SOL is just an example. It follows this structure:
1. **Indicator** – gives the initial signal
2. **Entry strategy** – decides when to open a trade
3. **Exit strategy** – defines when to close it
4. **Trend confirmation** – ensures the trade follows the market direction
5. **Filters** – cuts out noise and avoids weak setups
6. **Risk management** – controls losses and protects your capital
To tune it for a different pair, you'll need to start from scratch:
1. Select the timeframe (candle size)
2. Turn off all filters and trend entry/exit confirmations
3. Choose a channel type, channel source and entry strategy
4. Adjust risk parameters
5. Tune long and short settings for the channel
6. Fine-tune the Pivot Point Supertrend and Main Exit condition OBV
This will generate a lot of signals and activity on the chart. Your next task is to find the right combination of filters and settings to reduce noise and tune it for profitability.
### Default Strategy values
Default values are tuned for: Symbol BITGET:SOLUSDT.P 5min candle
Filters are off by default: Try to play with it to understand how it works
## Configuration Guide
### General Settings
| Setting | Description | Default Value |
|---------|-------------|---------------|
| **Long Positions** | Enable or disable long trades | Enabled |
| **Short Positions** | Enable or disable short trades | Enabled |
| **Risk/Reward Area** | Visual display of stop-loss and take-profit zones | Enabled |
| **Long Entry Source** | Price data used for long entry signals | hl2 (High+Low/2) |
| **Short Entry Source** | Price data used for short entry signals | hl2 (High+Low/2) |
The bot allows you to trade long positions, short positions, or both simultaneously. Each direction has its own set of parameters, allowing for fine-tuned strategies that recognize the asymmetric nature of market movements.
### Multi-Timeframe Settings
1. **Enable Multi-Timeframe Analysis**: Toggle 'Enable Multi-Timeframe Analysis' in the Multi-Timeframe Settings section
2. **Configure Timeframes**: Set appropriate higher timeframes based on your trading style:
- Timeframe 1: Default is now 15 minutes (intraday confirmation)
- Timeframe 2: Default is 4 hours (trend direction)
3. **Select Sources per Indicator**: For each indicator (RSI, KEMAD, Volume, etc.), choose:
- The desired timeframe (current, mtf1, or mtf2)
- The appropriate price type (open, high, low, close, hl2, hlc3, ohlc4)
### Entry Strategies
- **Breakout**: Enter when price breaks above/below the channel
- **Pullback**: Enter when price pulls back to the channel
- **Mean Reversion**: Enter when price is extended from the channel
You can enable different strategies for long and short positions.
### Core Components
### Risk Management
- **Position Size**: Control risk with percentage-based position sizing
- **Stop Loss Options**:
- Fixed: Set a specific price or percentage from entry
- ATR-based: Dynamic stop-loss based on market volatility
- Swing: Uses recent swing high/low points
- **Take Profit**: Multiple targets with percentage allocation
- **Trailing Stop**: Dynamic stop that follows price movement
## Advanced Usage Strategies
### Moving Average Type Selection Guide
- **SMA**: More stable in choppy markets, good for higher timeframes
- **EMA/WMA**: More responsive to recent price changes, better for entry signals
- **VWMA**: Adds volume weighting for stronger trends, use with Volume filter
- **HMA**: Balance between responsiveness and noise reduction, good for volatile markets
### Multi-Timeframe Strategy Approaches
- **Trend Confirmation**: Use higher timeframe RSI (mtf2) for overall trend, current timeframe for entries
- **Entry Precision**: Use KEMAD on current timeframe with volume filter on mtf1
- **False Signal Reduction**: Apply RSI filter on mtf1 with strict KEMAD settings
### Market Condition Optimization
| Market Condition | Recommended Settings |
|------------------|----------------------|
| **Trending** | Use Breakout strategy with KEMAD filter on higher timeframe |
| **Ranging** | Use Mean Reversion with strict RSI filter (mtf1) |
| **Volatile** | Increase ATR multipliers, use HMA for moving averages |
| **Low Volatility** | Decrease noise parameters, use pullback strategy |
## Webhook Integration
The strategy features a professional webhook system that allows direct connectivity to your exchange or trading platform of choice through third-party services like 3commas, Alertatron, or Autoview.
The webhook payload includes all necessary parameters for automated execution:
- Entry price and direction
- Stop loss and take profit levels
- Position size
- Custom identifier for webhook routing
## Performance Optimization Tips
1. **Start with Defaults**: Begin with the default settings for your timeframe before customizing
2. **Adjust One Component at a Time**: Make incremental changes and test the impact
3. **Match MA Types to Market Conditions**: Use appropriate moving average types based on the Market Condition Optimization table
4. **Timeframe Synergy**: Create logical relationships between timeframes (e.g., 5min chart with 15min and 4h higher timeframes)
5. **Periodic Retuning**: Markets evolve - regularly review and adjust parameters
## Common Setups
### Crypto Trend-Following
- MLMA with EMA or HMA
- Higher RSI thresholds (75/25)
- KEMAD filter on mtf1
- Breakout entry strategy
### Stock Swing Trading
- MLMA with SMA for stability
- Volume filter with higher threshold
- KEMAD with increased filter order
- Pullback entry strategy
### Forex Scalping
- MLMA with WMA and lower noise parameter
- RSI filter on current timeframe
- Use highest timeframe for trend direction only
- Mean Reversion strategy
## Webhook Configuration
- **Benefits**:
- Automated trade execution without manual intervention
- Immediate response to market conditions
- Consistent execution of your strategy
- **Implementation Notes**:
- Requires proper webhook configuration on your exchange or platform
- Test thoroughly with small position sizes before full deployment
- Consider latency between signal generation and execution
### Backtesting Period
Define a specific historical period to evaluate the bot's performance:
| Setting | Description | Default Value |
|---------|-------------|---------------|
| **Start Date** | Beginning of backtest period | January 1, 2025 |
| **End Date** | End of backtest period | December 31, 2026 |
- **Best Practice**: Test across different market conditions (bull markets, bear markets, sideways markets)
- **Limitation**: Past performance doesn't guarantee future results
## Entry and Exit Strategies
### Dual-Channel System
A key innovation of the Bober XM is its dual-channel approach:
- **Independent Parameters**: Each trade direction has its own channel settings
- **Asymmetric Trading**: Recognizes that markets often behave differently in uptrends versus downtrends
- **Optimized Performance**: Fine-tune settings for both bullish and bearish conditions
This approach allows the bot to adapt to the natural asymmetry of markets, where uptrends often develop gradually while downtrends can be sharp and sudden.
### Channel Types
#### 1. Keltner Channels
Traditional volatility-based channels using EMA and ATR:
| Setting | Long Default | Short Default |
|---------|--------------|---------------|
| **EMA Length** | 37 | 20 |
| **ATR Length** | 13 | 17 |
| **Multiplier** | 1.4 | 1.9 |
| **Source** | low | high |
- **Strengths**:
- Reliable in trending markets
- Less prone to whipsaws than Bollinger Bands
- Clear visual representation of volatility
- **Weaknesses**:
- Can lag during rapid market changes
- Less effective in choppy, non-trending markets
#### 2. Machine Learning Moving Average (MLMA)
Advanced predictive model using kernel regression (RBF kernel):
| Setting | Description | Options |
|---------|-------------|--------|
| **Source MA** | Price data used for MA calculations | Any price source (low/high/close/etc.) |
| **Moving Average Type** | Type of MA algorithm for calculations | SMA, EMA, WMA, VWMA, RMA, HMA |
| **Trend Source** | Price data used for trend determination | Any price source (close default) |
| **Window Size** | Historical window for MLMA calculations | 5+ (default: 16) |
| **Forecast Length** | Number of bars to forecast ahead | 1+ (default: 3) |
| **Noise Parameter** | Controls smoothness of prediction | 0.01+ (default: ~0.43) |
| **Band Multiplier** | Multiplier for channel width | 0.1+ (default: 0.5-0.6) |
- **Strengths**:
- Predictive rather than reactive
- Adapts quickly to changing market conditions
- Better at identifying trend reversals early
- **Weaknesses**:
- More computationally intensive
- Requires careful parameter tuning
- Can be sensitive to input data quality
### Entry Strategies
| Strategy | Description | Ideal Market Conditions |
|----------|-------------|-------------------------|
| **Breakout** | Enters when price breaks through channel bands, indicating strong momentum | High volatility, emerging trends |
| **Pullback** | Enters when price retraces to the middle band after testing extremes | Established trends with regular pullbacks |
| **Mean Reversion** | Enters at channel extremes, betting on a return to the mean | Range-bound or oscillating markets |
#### Breakout Strategy (Default)
- **Implementation**: Enters long when price crosses above the upper band, short when price crosses below the lower band
- **Strengths**: Captures strong momentum moves, performs well in trending markets
- **Weaknesses**: Can lead to late entries, higher risk of false breakouts
- **Optimization Tips**:
- Increase channel multiplier for fewer but more reliable signals
- Combine with volume confirmation for better accuracy
#### Pullback Strategy
- **Implementation**: Enters long when price pulls back to middle band during uptrend, short during downtrend pullbacks
- **Strengths**: Better entry prices, lower risk, higher probability setups
- **Weaknesses**: Misses some strong moves, requires clear trend identification
- **Optimization Tips**:
- Use with trend filters to confirm overall direction
- Adjust middle band calculation for market volatility
#### Mean Reversion Strategy
- **Implementation**: Enters long at lower band, short at upper band, expecting price to revert to the mean
- **Strengths**: Excellent entry prices, works well in ranging markets
- **Weaknesses**: Dangerous in strong trends, can lead to fighting the trend
- **Optimization Tips**:
- Implement strong trend filters to avoid counter-trend trades
- Use smaller position sizes due to higher risk nature
### Confirmation Indicators
#### Pivot Point SuperTrend
Combines pivot points with ATR-based SuperTrend for trend confirmation:
| Setting | Default Value |
|---------|---------------|
| **Pivot Period** | 25 |
| **ATR Factor** | 2.2 |
| **ATR Period** | 41 |
- **Function**: Identifies significant market turning points and confirms trend direction
- **Implementation**: Requires price to respect the SuperTrend line for trade confirmation
#### Weighted Moving Average (WMA)
Provides additional confirmation layer for entries:
| Setting | Default Value |
|---------|---------------|
| **Period** | 15 |
| **Source** | ohlc4 (average of Open, High, Low, Close) |
- **Function**: Confirms trend direction and filters out low-quality signals
- **Implementation**: Price must be above WMA for longs, below for shorts
### Exit Strategies
#### On-Balance Volume (OBV) Based Exits
Uses volume flow to identify potential reversals:
| Setting | Default Value |
|---------|---------------|
| **Source** | ohlc4 |
| **MA Type** | HMA (Options: SMA, EMA, WMA, RMA, VWMA, HMA) |
| **Period** | 22 |
- **Function**: Identifies divergences between price and volume to exit before reversals
- **Implementation**: Exits when OBV crosses its moving average in the opposite direction
- **Customizable MA Type**: Different MA types provide varying sensitivity to OBV changes:
- **SMA**: Traditional simple average, equal weight to all periods
- **EMA**: More weight to recent data, responds faster to price changes
- **WMA**: Weighted by recency, smoother than EMA
- **RMA**: Similar to EMA but smoother, reduces noise
- **VWMA**: Factors in volume, helpful for OBV confirmation
- **HMA**: Reduces lag while maintaining smoothness (default)
#### ADX Exit Confirmation
Uses Average Directional Index to confirm trend exhaustion:
| Setting | Default Value |
|---------|---------------|
| **ADX Threshold** | 35 |
| **ADX Smoothing** | 60 |
| **DI Length** | 60 |
- **Function**: Confirms trend weakness before exiting positions
- **Implementation**: Requires ADX to drop below threshold or DI lines to cross
## Filter System
### RSI Filter
- **Function**: Controls entries based on momentum conditions
- **Parameters**:
- Period: 15 (default)
- Overbought level: 71
- Oversold level: 23
- Multi-timeframe support: Current, MTF1 (15min), or MTF2 (4h)
- Customizable price source (open, high, low, close, hl2, hlc3, ohlc4)
- **Implementation**: Blocks long entries when RSI > overbought, short entries when RSI < oversold
### Volatility Filter
- **Function**: Prevents trading during excessive market volatility
- **Parameters**:
- Measure: ATR (Average True Range)
- Period: Customizable (default varies by timeframe)
- Threshold: Adjustable multiplier
- Multi-timeframe support
- Customizable price source
- **Implementation**: Blocks trades when current volatility exceeds threshold × average volatility
### Volume Filter
- **Function**: Ensures adequate market liquidity for trades
- **Parameters**:
- Threshold: 0.4× average (default)
- Measurement period: 5 (default)
- Moving average type: Customizable (HMA default)
- Multi-timeframe support
- Customizable price source
- **Implementation**: Requires current volume to exceed threshold × average volume
### Bollinger Bands Filter
- **Function**: Controls entries based on price relative to statistical boundaries
- **Parameters**:
- Period: Customizable
- Standard deviation multiplier: Adjustable
- Moving average type: Customizable
- Multi-timeframe support
- Customizable price source
- **Implementation**: Can require price to be within bands or breaking out of bands depending on strategy
### KEMAD Filter (Kalman EMA Distance)
- **Function**: Advanced trend confirmation using Kalman filter algorithm
- **Parameters**:
- Process Noise: 0.35 (controls smoothness)
- Measurement Noise: 24 (controls reactivity)
- Filter Order: 6 (higher = more smoothing)
- ATR Length: 8 (for bandwidth calculation)
- Upper Multiplier: 2.0 (for long signals)
- Lower Multiplier: 2.7 (for short signals)
- Multi-timeframe support
- Customizable visual indicators
- **Implementation**: Generates signals based on price position relative to Kalman-filtered EMA bands
## Risk Management System
### Position Sizing
Automatically calculates position size based on account equity and risk parameters:
| Setting | Default Value |
|---------|---------------|
| **Risk % of Equity** | 50% |
- **Implementation**:
- Position size = (Account equity × Risk %) ÷ (Entry price × Stop loss distance)
- Adjusts automatically based on volatility and stop placement
- **Best Practices**:
- Start with lower risk percentages (1-2%) until strategy is proven
- Consider reducing risk during high volatility periods
### Stop-Loss Methods
Multiple stop-loss calculation methods with separate configurations for long and short positions:
| Method | Description | Configuration |
|--------|-------------|---------------|
| **ATR-Based** | Dynamic stops based on volatility | ATR Period: 14, Multiplier: 2.0 |
| **Percentage** | Fixed percentage from entry | Long: 1.5%, Short: 1.5% |
| **PIP-Based** | Fixed currency unit distance | 10.0 pips |
- **Implementation Notes**:
- ATR-based stops adapt to changing market volatility
- Percentage stops maintain consistent risk exposure
- PIP-based stops provide precise control in stable markets
### Trailing Stops
Locks in profits by adjusting stop-loss levels as price moves favorably:
| Setting | Default Value |
|---------|---------------|
| **Stop-Loss %** | 1.5% |
| **Activation Threshold** | 2.1% |
| **Trailing Distance** | 1.4% |
- **Implementation**:
- Initial stop remains fixed until profit reaches activation threshold
- Once activated, stop follows price at specified distance
- Locks in profit while allowing room for normal price fluctuations
### Risk-Reward Parameters
Defines the relationship between risk and potential reward:
| Setting | Default Value |
|---------|---------------|
| **Risk-Reward Ratio** | 1.4 |
| **Take Profit %** | 2.4% |
| **Stop-Loss %** | 1.5% |
- **Implementation**:
- Take profit distance = Stop loss distance × Risk-reward ratio
- Higher ratios require fewer winning trades for profitability
- Lower ratios increase win rate but reduce average profit
### Filter Combinations
The strategy allows for simultaneous application of multiple filters:
- **Recommended Combinations**:
- Trending markets: RSI + KEMAD filters
- Ranging markets: Bollinger Bands + Volatility filters
- All markets: Volume filter as minimum requirement
- **Performance Impact**:
- Each additional filter reduces the number of trades
- Quality of remaining trades typically improves
- Optimal combination depends on market conditions and timeframe
### Multi-Timeframe Filter Applications
| Filter Type | Current Timeframe | MTF1 (15min) | MTF2 (4h) |
|-------------|-------------------|-------------|------------|
| RSI | Quick entries/exits | Intraday trend | Overall trend |
| Volume | Immediate liquidity | Sustained support | Market participation |
| Volatility | Entry timing | Short-term risk | Regime changes |
| KEMAD | Precise signals | Trend confirmation | Major reversals |
## Visual Indicators and Chart Analysis
The bot provides comprehensive visual feedback on the chart:
- **Channel Bands**: Keltner or MLMA bands showing potential support/resistance
- **Pivot SuperTrend**: Colored line showing trend direction and potential reversal points
- **Entry/Exit Markers**: Annotations showing actual trade entries and exits
- **Risk/Reward Zones**: Visual representation of stop-loss and take-profit levels
These visual elements allow for:
- Real-time strategy assessment
- Post-trade analysis and optimization
- Educational understanding of the strategy logic
## Implementation Guide
### TradingView Setup
1. Load the script in TradingView Pine Editor
2. Apply to your preferred chart and timeframe
3. Adjust parameters based on your trading preferences
4. Enable alerts for webhook integration
### Webhook Integration
1. Configure webhook URL in TradingView alerts
2. Set up receiving endpoint on your trading platform
3. Define message format matching the bot's output
4. Test with small position sizes before full deployment
### Optimization Process
1. Backtest across different market conditions
2. Identify parameter sensitivity through multiple tests
3. Focus on risk management parameters first
4. Fine-tune entry/exit conditions based on performance metrics
5. Validate with out-of-sample testing
## Performance Considerations
### Strengths
- Adaptability to different market conditions through dual channels
- Multiple layers of confirmation reducing false signals
- Comprehensive risk management protecting capital
- Machine learning integration for predictive edge
### Limitations
- Complex parameter set requiring careful optimization
- Potential over-optimization risk with so many variables
- Computational intensity of MLMA calculations
- Dependency on proper webhook configuration for execution
### Best Practices
- Start with conservative risk settings (1-2% of equity)
- Test thoroughly in demo environment before live trading
- Monitor performance regularly and adjust parameters
- Consider market regime changes when evaluating results
## Conclusion
The ₿ober XM v2.0 represents a significant evolution in trading strategy design, combining traditional technical analysis with machine learning elements and multi-timeframe analysis. The core strength of this system lies in its adaptability and recognition of market asymmetry.
### Market Asymmetry and Adaptive Approach
The strategy acknowledges a fundamental truth about markets: bullish and bearish phases behave differently and should be treated as distinct environments. The dual-channel system with separate parameters for long and short positions directly addresses this asymmetry, allowing for optimized performance regardless of market direction.
### Targeted Backtesting Philosophy
It's counterproductive to run backtests over excessively long periods. Markets evolve continuously, and strategies that worked in previous market regimes may be ineffective in current conditions. Instead:
- Test specific market phases separately (bull markets, bear markets, range-bound periods)
- Regularly re-optimize parameters as market conditions change
- Focus on recent performance with higher weight than historical results
- Test across multiple timeframes to ensure robustness
### Multi-Timeframe Analysis as a Game-Changer
The integration of multi-timeframe analysis fundamentally transforms the strategy's effectiveness:
- **Increased Safety**: Higher timeframe confirmations reduce false signals and improve trade quality
- **Context Awareness**: Decisions made with awareness of larger trends reduce adverse entries
- **Adaptable Precision**: Apply strict filters on lower timeframes while maintaining awareness of broader conditions
- **Reduced Noise**: Higher timeframe data naturally filters market noise that can trigger poor entries
The ₿ober XM v2.0 provides traders with a framework that acknowledges market complexity while offering practical tools to navigate it. With proper setup, realistic expectations, and attention to changing market conditions, it delivers a sophisticated approach to systematic trading that can be continuously refined and optimized.

Goldman Sachs Risk Appetite ProxyRisk appetite indicators serve as barometers of market psychology, measuring investors' collective willingness to engage in risk-taking behavior. According to Mosley & Singer (2008), "cross-asset risk sentiment indicators provide valuable leading signals for market direction by capturing the underlying psychological state of market participants before it fully manifests in price action."
The GSRAI methodology aligns with modern portfolio theory, which emphasizes the importance of cross-asset correlations during different market regimes. As noted by Ang & Bekaert (2002), "asset correlations tend to increase during market stress, exhibiting asymmetric patterns that can be captured through multi-asset sentiment indicators."
Implementation Methodology
Component Selection
Our implementation follows the core framework outlined by Goldman Sachs research, focusing on four key components:
Credit Spreads (High Yield Credit Spread)
As noted by Duca et al. (2016), "credit spreads provide a market-based assessment of default risk and function as an effective barometer of economic uncertainty." Higher spreads generally indicate deteriorating risk appetite.
Volatility Measures (VIX)
Baker & Wurgler (2006) established that "implied volatility serves as a direct measure of market fear and uncertainty." The VIX, often called the "fear gauge," maintains an inverse relationship with risk appetite.
Equity/Bond Performance Ratio (SPY/IEF)
According to Connolly et al. (2005), "the relative performance of stocks versus bonds offers significant insight into market participants' risk preferences and flight-to-safety behavior."
Commodity Ratio (Oil/Gold)
Baur & McDermott (2010) demonstrated that "gold often functions as a safe haven during market turbulence, while oil typically performs better during risk-on environments, making their ratio an effective risk sentiment indicator."
Standardization Process
Each component undergoes z-score normalization to enable cross-asset comparisons, following the statistical approach advocated by Burdekin & Siklos (2012). The z-score transformation standardizes each variable by subtracting its mean and dividing by its standard deviation: Z = (X - μ) / σ
This approach allows for meaningful aggregation of different market signals regardless of their native scales or volatility characteristics.
Signal Integration
The four standardized components are equally weighted and combined to form a composite score. This democratic weighting approach is supported by Rapach et al. (2010), who found that "simple averaging often outperforms more complex weighting schemes in financial applications due to estimation error in the optimization process."
The final index is scaled to a 0-100 range, with:
Values above 70 indicating "Risk-On" market conditions
Values below 30 indicating "Risk-Off" market conditions
Values between 30-70 representing neutral risk sentiment
Limitations and Differences from Original Implementation
Proprietary Components
The original Goldman Sachs indicator incorporates additional proprietary elements not publicly disclosed. As Goldman Sachs Global Investment Research (2019) notes, "our comprehensive risk appetite framework incorporates proprietary positioning data and internal liquidity metrics that enhance predictive capability."
Technical Limitations
Pine Script v6 imposes certain constraints that prevent full replication:
Structural Limitations: Functions like plot, hline, and bgcolor must be defined in the global scope rather than conditionally, requiring workarounds for dynamic visualization.
Statistical Processing: Advanced statistical methods used in the original model, such as Kalman filtering or regime-switching models described by Ang & Timmermann (2012), cannot be fully implemented within Pine Script's constraints.
Data Availability: As noted by Kilian & Park (2009), "the quality and frequency of market data significantly impacts the effectiveness of sentiment indicators." Our implementation relies on publicly available data sources that may differ from Goldman Sachs' institutional data feeds.
Empirical Performance
While a formal backtest comparison with the original GSRAI is beyond the scope of this implementation, research by Froot & Ramadorai (2005) suggests that "publicly accessible proxies of proprietary sentiment indicators can capture a significant portion of their predictive power, particularly during major market turning points."
References
Ang, A., & Bekaert, G. (2002). "International Asset Allocation with Regime Shifts." Review of Financial Studies, 15(4), 1137-1187.
Ang, A., & Timmermann, A. (2012). "Regime Changes and Financial Markets." Annual Review of Financial Economics, 4(1), 313-337.
Baker, M., & Wurgler, J. (2006). "Investor Sentiment and the Cross-Section of Stock Returns." Journal of Finance, 61(4), 1645-1680.
Baur, D. G., & McDermott, T. K. (2010). "Is Gold a Safe Haven? International Evidence." Journal of Banking & Finance, 34(8), 1886-1898.
Burdekin, R. C., & Siklos, P. L. (2012). "Enter the Dragon: Interactions between Chinese, US and Asia-Pacific Equity Markets, 1995-2010." Pacific-Basin Finance Journal, 20(3), 521-541.
Connolly, R., Stivers, C., & Sun, L. (2005). "Stock Market Uncertainty and the Stock-Bond Return Relation." Journal of Financial and Quantitative Analysis, 40(1), 161-194.
Duca, M. L., Nicoletti, G., & Martinez, A. V. (2016). "Global Corporate Bond Issuance: What Role for US Quantitative Easing?" Journal of International Money and Finance, 60, 114-150.
Froot, K. A., & Ramadorai, T. (2005). "Currency Returns, Intrinsic Value, and Institutional-Investor Flows." Journal of Finance, 60(3), 1535-1566.
Goldman Sachs Global Investment Research (2019). "Risk Appetite Framework: A Practitioner's Guide."
Kilian, L., & Park, C. (2009). "The Impact of Oil Price Shocks on the U.S. Stock Market." International Economic Review, 50(4), 1267-1287.
Mosley, L., & Singer, D. A. (2008). "Taking Stock Seriously: Equity Market Performance, Government Policy, and Financial Globalization." International Studies Quarterly, 52(2), 405-425.
Oppenheimer, P. (2007). "A Framework for Financial Market Risk Appetite." Goldman Sachs Global Economics Paper.
Rapach, D. E., Strauss, J. K., & Zhou, G. (2010). "Out-of-Sample Equity Premium Prediction: Combination Forecasts and Links to the Real Economy." Review of Financial Studies, 23(2), 821-862.

Smart FlexRange Breakout [The_lurker]The Smart FlexRange Breakout tool aims to identify trading opportunities based on price breakouts of dynamic levels (CALL, PUT) with a dotted centerline and the ability to select the applicable market. The tool relies on candlestick analysis over a specific time period (such as 3 hours). Candle data (searchHours) is collected to identify the most significant candle based on candlestick patterns and trading volume during the selected timeframe. Breakout levels and take-profit (TP) targets are then plotted, along with buy and sell signals, breakout notifications, and up/down trend lines based on Pivot Points.
The tool is run according to the selected timeframe.
Practical Use
1- Setup: Adjust the market, timeframe, number of hours, and time zone to suit the trader's needs.
2- Trading: Monitor signals (BUY/SELL) and TP levels to determine entry and exit points.
3- Trend Lines: Use them to understand the overall trend and confirm signals.
---
1. Objective: Identify trading opportunities based on price breakouts
- Trading opportunities: The indicator is designed to help traders identify moments when significant price movements are likely, allowing them to enter buy or sell trades based on market changes.
- Price breakouts: The indicator focuses on moments when prices break through key levels (resistance or support). A breakout occurs when the price exceeds a resistance level (up) or breaks a support level (down), indicating a potential continuation of the movement in the same direction.
- Dynamic: Resistance and support levels are not static; rather, they are calculated based on candlestick analysis over a specific period of time, making them adaptive to current market conditions.
---
2. Dynamic levels (resistance and support levels)
- Resistance levels: These represent prices that the price is difficult to break above, defined here as the high of the most significant candle during the specified period.
- Support levels: These represent prices below which the price is difficult to fall, defined as the low of the most significant candle.
- Dynamic: These levels are recalculated every new search period (searchHours), meaning they change based on the latest market data, unlike traditional static levels.
---
3. Adding a Dotted Center Line
- Center Line: A horizontal dotted line is drawn at the midpoint between the high and low of the most significant candle.
- Purpose:
- Provides a visual reference point for determining the current price position relative to support and resistance levels.
- Helps assess whether the price is moving toward a breakout (near resistance) or a breakout (near support).
- Dotted: The dotted pattern distinguishes it from the solid upper and lower lines, making it easier to distinguish visually.
---
4. Relying on candlestick analysis over a specific time period (searchHours)
- Candlestick Analysis: The indicator examines candlesticks to determine which ones have the most influence on price movement.
- Timeframe (searchHours):
- The user specifies the number of hours (1-6) for candle analysis, which determines the range of data the indicator relies on.
- Example: If searchHours = 3 and timeframe = 30 minutes, 6 candles are analyzed (3 hours ÷ 30 minutes).
- Flexibility: This period can be adjusted to suit different markets (such as volatile cryptocurrencies or more stable Forex).
---
5. Determining the Most Important Candle Based on Candle Patterns and Volume
- The most important candle: is the candle believed to have the greatest impact on price movement based on specific criteria.
- Candle Patterns:
- Candles are analyzed using a candlestick pattern library (such as Engulfing, Hammer, Doji).
- Reversal patterns (such as Morning Star, Shooting Star) are given a high importance score (100 points) because they indicate potential trend changes.
- Trading Volume:
- The trading volume of each candle is measured and compared to the maximum and minimum during the period.
- Volume is calculated as a percentage (0-100) and added to the pattern score to determine the most significant candle.
- Result: The candle with the highest score (patterns + volume) is used to determine support and resistance levels.
---
6. Timeframe
- Time interval: The user selects a time frame for the candles (15, 30, or 60 minutes).
- Importance:
- Determines the number of candles analyzed during the searchHours period.
- Affects the accuracy and speed of the signals (shorter timeframe = faster but less reliable signals; longer timeframe = slower but more reliable signals).
- Example: If the timeframe is 60 minutes and searchHours is 3, only 3 candles are analyzed.
---
7. Drawing Breakout Levels and Take Profit Targets (TP)
- Breakout Levels:
- Upper line (resistance): Drawn at the highest price of the most significant candle and is labeled "CALL".
- Lower line (support): Drawn at the lowest price of the most important candle and is called "PUT."
- These lines represent levels where a breakout is expected to lead to a strong price movement.
- Take Profit Targets (TP):
- Up to 8 bullish (above the upper line) and bearish (below the lower line) TP levels are calculated.
- They are calculated based on a percentage (tpPercentage) added or subtracted from the base lines.
- Example: If tpPercentage = 0.6% and the high price = 100, then bullish TP1 = 100.6, TP2 = 101.2, etc.
- Labels: Labels are drawn for each TP level indicating the value and level (TP1, TP2, etc.).
---
8. Buy and Sell Signals
- Buy (BUY) signal:
- Generated when the price breaks the upper line (ta.crossover).
- The "BUY" label is drawn with the redrawing of the TP levels.
- Sell signal (SELL):
- Generated when the price breaks the lower line (ta.crossunder).
- The "SELL" label is drawn with the redrawing of the TP levels.
- Purpose: To provide clear signals to the trader for making trade entry decisions.
=========================================================================
Thank you, n00btraders.
For using the import library: n00btraders/Timezone/1
For using the import library: The_lurker/AllCandlestickPatternsLibrary/1
========================================================================
Disclaimer:
The information and publications are not intended to be, nor do they constitute, financial, investment, trading, or other types of advice or recommendations provided or endorsed by TradingView.
تهدف أداة Smart FlexRange Breakout إلى تحديد فرص التداول بناءً على اختراقات الأسعار للمستويات الديناميكية (CALL، PUT) مع خط مركزي منقط، مع إمكانية اختيار السوق المناسب. تعتمد الأداة على تحليل الشموع اليابانية على مدى فترة زمنية محددة (مثل 3 ساعات). تُجمع بيانات الشموع (searchHours) لتحديد أهم شمعة بناءً على أنماط الشموع وحجم التداول خلال الإطار الزمني المحدد. ثم تُرسم مستويات الاختراق وأهداف جني الأرباح (TP)، بالإضافة إلى إشارات البيع والشراء، وإشعارات الاختراق، وخطوط الاتجاه الصعودي/الهبوطي بناءً على نقاط المحور.
يتم تشغيل الاداه حسب الفاصل المختار timeframe
الاستخدام العملي
1- الإعداد: اضبط السوق، والإطار الزمني، وعدد الساعات، والمنطقة الزمنية لتناسب احتياجات المتداول.
2- التداول: راقب إشارات (الشراء/البيع) ومستويات جني الأرباح لتحديد نقاط الدخول والخروج.
3- خطوط الاتجاه: استخدمها لفهم الاتجاه العام وتأكيد الإشارات.
1. الهدف: تحديد فرص التداول بناءً على اختراقات الأسعار
- فرص التداول: صُمم هذا المؤشر لمساعدة المتداولين على تحديد اللحظات التي يُحتمل فيها حدوث تحركات سعرية كبيرة، مما يسمح لهم بالدخول في صفقات شراء أو بيع بناءً على تغيرات السوق.
- اختراقات الأسعار: يُركز المؤشر على اللحظات التي تخترق فيها الأسعار مستويات رئيسية (مقاومة أو دعم). يحدث الاختراق عندما يتجاوز السعر مستوى مقاومة (صعودًا) أو يخترق مستوى دعم (هبوطًا)، مما يُشير إلى احتمال استمرار الحركة في نفس الاتجاه.
- ديناميكي: مستويات المقاومة والدعم ليست ثابتة؛ بل تُحسب بناءً على تحليل الشموع اليابانية على مدى فترة زمنية محددة، مما يجعلها مُكيفة مع ظروف السوق الحالية.
2. المستويات الديناميكية (مستويات المقاومة والدعم)
- مستويات المقاومة: تُمثل هذه الأسعار التي يصعب على السعر تجاوزها، وتُعرف هنا بأنها ارتفاع الشمعة الأكثر أهمية خلال الفترة المحددة.
- مستويات الدعم: تُمثل هذه الأسعار التي يصعب على السعر الانخفاض دونها، وتُعرف بأنها أدنى مستوى للشمعة الأكثر أهمية.
- ديناميكي: تُعاد حساب هذه المستويات مع كل فترة بحث جديدة (ساعات البحث)، مما يعني أنها تتغير بناءً على أحدث بيانات السوق، على عكس المستويات الثابتة التقليدية.
3. إضافة خط مركزي منقط
- خط المركز: يُرسم خط أفقي منقط عند نقطة المنتصف بين أعلى وأدنى شمعة ذات أهمية.
- الغرض:
- يوفر نقطة مرجعية بصرية لتحديد وضع السعر الحالي بالنسبة لمستويات الدعم والمقاومة.
- يساعد في تقييم ما إذا كان السعر يتحرك نحو اختراق (بالقرب من المقاومة) أو اختراق (بالقرب من الدعم).
- منقط: يُميزه النمط المنقط عن الخطوط العلوية والسفلية المتصلة، مما يُسهّل تمييزه بصريًا.
4. الاعتماد على تحليل الشموع اليابانية على مدى فترة زمنية محددة (ساعات البحث)
- تحليل الشموع اليابانية: يفحص المؤشر الشموع اليابانية لتحديد أيها الأكثر تأثيرًا على حركة السعر.
- الإطار الزمني (ساعات البحث):
- يُحدد المستخدم عدد الساعات (من 1 إلى 6) لتحليل الشموع، والذي يُحدد نطاق البيانات التي يعتمد عليها المؤشر.
- مثال: إذا كانت ساعات البحث = 3 والإطار الزمني = 30 دقيقة، فسيتم تحليل 6 شموع (3 ساعات ÷ 30 دقيقة).
- المرونة: يُمكن تعديل هذه الفترة لتناسب الأسواق المختلفة (مثل العملات المشفرة المتقلبة أو سوق الفوركس الأكثر استقرارًا).
5. تحديد الشمعة الأكثر أهمية بناءً على أنماط الشموع وحجم التداول
- الشمعة الأكثر أهمية: هي الشمعة التي يُعتقد أن لها التأثير الأكبر على حركة السعر بناءً على معايير محددة.
- أنماط الشموع:
- يتم تحليل الشموع باستخدام مكتبة أنماط الشموع (مثل شمعة الابتلاع، وشمعة المطرقة، وشمعة الدوجي).
- تُمنح أنماط الانعكاس (مثل نجمة الصباح، ونجم الشهاب) درجة أهمية عالية (100 نقطة) لأنها تُشير إلى تغيرات محتملة في الاتجاه.
- حجم التداول:
- يُقاس حجم تداول كل شمعة ويُقارن بالحد الأقصى والأدنى خلال الفترة.
- يُحسب الحجم كنسبة مئوية (0-100) ويُضاف إلى درجة النمط لتحديد الشمعة الأكثر أهمية.
- النتيجة: تُستخدم الشمعة ذات أعلى درجة (الأنماط + الحجم) لتحديد مستويات الدعم والمقاومة.
٦. الإطار الزمني
- الفاصل الزمني: يختار المستخدم إطارًا زمنيًا للشموع (١٥، ٣٠، أو ٦٠ دقيقة).
- الأهمية:
- يحدد عدد الشموع المُحللة خلال فترة ساعات البحث.
- يؤثر على دقة وسرعة الإشارات (الإطار الزمني الأقصر = إشارات أسرع ولكن أقل موثوقية؛ الإطار الزمني الأطول = إشارات أبطأ ولكن أكثر موثوقية).
- مثال: إذا كان الإطار الزمني ٦٠ دقيقة وساعات البحث ٣، فسيتم تحليل ٣ شموع فقط.
---
٧. رسم مستويات الاختراق وأهداف جني الأرباح (TP)
- مستويات الاختراق:
- الخط العلوي (المقاومة): يُرسم عند أعلى سعر للشمعة الأكثر أهمية ويُسمى "CALL".
- الخط السفلي (الدعم): يُرسم عند أدنى سعر للشمعة الأكثر أهمية ويُسمى "PUT".
- تمثل هذه الخطوط المستويات التي يُتوقع أن يؤدي فيها الاختراق إلى حركة سعرية قوية.
- أهداف جني الأرباح (TP):
- يتم حساب ما يصل إلى 8 مستويات جني أرباح صعودية (فوق الخط العلوي) وهبوطية (تحت الخط السفلي).
- يتم حسابها بناءً على نسبة مئوية (tpPercentage) تُضاف أو تُطرح من خطوط الأساس.
- مثال: إذا كانت نسبة جني الأرباح = 0.6% وكان أعلى سعر = 100، فإن هدف الربح الصعودي الأول = 100.6، وهدف الربح الثاني = 101.2، وهكذا.
- العلامات: تُرسم علامات لكل مستوى جني أرباح تشير إلى القيمة والمستوى (TP1، TP2، وهكذا).
---
8. إشارات الشراء والبيع
- إشارة الشراء (BUY):
- تُولّد عند اختراق السعر للخط العلوي (ta.crossover).
- تُرسم علامة "الشراء" مع إعادة رسم مستويات جني الأرباح.
- إشارة البيع (SELL):
- تُولّد عند اختراق السعر للخط السفلي (ta.crossunder). - يُرسم مؤشر "بيع" مع إعادة رسم مستويات جني الأرباح.
- الغرض: توفير إشارات واضحة للمتداول لاتخاذ قرارات دخول الصفقة.
==========================================================================
شكرًا لكم، أيها المتداولون الجدد.
لاستخدام مكتبة الاستيراد: n00btraders/Timezone/1
لاستخدام مكتبة الاستيراد: The_lurker/AllCandlestickPatternsLibrary/1
==============================================================================
إخلاء مسؤولية:
لا يُقصد بهذه المعلومات والمنشورات أن تكون، ولا تُشكل، نصائح أو توصيات مالية أو استثمارية أو تجارية أو أي نوع آخر من النصائح أو التوصيات المُقدمة من TradingView أو المُعتمدة منها.

CRT Finder (WanHakimFX)📈 Liquidity Grab Indicator with MTF Confluence & Alerts
🔍 Overview:
The Liquidity Grab Indicator is designed to detect precise moments when price sweeps liquidity — either by wicking below recent lows (bullish LQH) or above recent highs (bearish LQL) — followed by a clear rejection. It combines this logic with multi-timeframe confirmation and trend filters, making it a powerful tool for identifying high-probability reversal setups.
⚙️ How It Works:
✅ Liquidity Sweep Logic (LQH / LQL)
Bullish (LQH):
Current candle wicks below the previous low
Closes above the previous candle body
Confirms potential bullish reversal
Bearish (LQL):
Current candle wicks above the previous high
Closes below the previous candle body
Confirms potential bearish reversal
✅ Additional Conditions:
Must occur during London or New York sessions.
Requires trend confluence:
LQH = Price must be above SMMA 60/100/200
LQL = Price must be below SMMA 60/100/200
🧠 Multi-Timeframe Confluence:
The indicator scans for LQH/LQL sweeps across:
Daily
4H
1H
30M
15M
If a sweep occurs on any of these timeframes, an alert is triggered and a triangle marker appears on the chart for real-time visual confluence.
📊 Visual Features:
Green/Red labels for active timeframe sweeps.
Dotted wick lines to show liquidity zones from the previous candle.
Colored triangle markers for MTF sweep alerts.
🛠 Strategy Usage:
This indicator is best used as a trigger tool in a confluence-based strategy:
Use higher-timeframe MTF LQH/LQL markers for directional bias.
Wait for matching sweep on your entry timeframe (e.g., M1/M5).
Enter on confirmation candle or break of structure.
Target imbalances, FVGs, or previous highs/lows.
Risk-managed entries using sweep candle's high/low as stop.
📢 Alerts:
✅ Bullish Sweep (LQH) on any timeframe
✅ Bearish Sweep (LQL) on any timeframe

Smart Range DetectorSmart Range Detector
What It Does
This indicator automatically detects and validates significant trading ranges using pivot point analysis combined with logarithmic fibonacci relationships. It operates by identifying specific pivot patterns (High-Low-High and Low-High-Low) that meet fibonacci validation criteria to filter out noise and highlight only the most reliable trading ranges. Each range is continuously monitored for potential mitigation (breakout) events.
Key Features
Identifies both High-Low-High and Low-High-Low range patterns
Validates each range using logarithmic fibonacci relationships (more accurate than linear fibs)
Detects range mitigations (breakouts) and visually differentiates them
Shows fibonacci levels within ranges (25%, 50%, 75%) for potential reversal points
Visualizes extension levels beyond ranges for breakout targets
Analyzes volume profile with customizable price divisions (default: 60)
Displays Point of Control (POC) and Value Area for traded volume analysis
Implements performance optimization with configurable range limits
Includes user-adjustable safety checks to prevent Pine Script limitations
Offers fully customizable colors, line widths, and transparency settings
How To Use It
Identify Valid Ranges : The indicator automatically detects and highlights trading ranges that meet fibonacci validation criteria
Monitor Fibonacci Levels : Watch for price reactions at internal fib levels (25%, 50%, 75%) for potential reversal opportunities
Track Extension Targets : Use the extension lines as potential targets when price breaks out of a range
Analyze Volume Structure : Enable the volume profile mode to see where most volume was traded within mitigated ranges
Trade Range Boundaries : Look for reactions at range highs/lows combined with volume POC for higher probability entries
Manage Performance : Adjust the maximum displayed ranges and history bars settings for optimal chart performance
Settings Guide
Left/Right Bars Look Back : Controls how far back the indicator looks to identify pivot points (higher values find more ranges but may reduce sensitivity)
Max History Bars : Limits how far back in history the indicator will analyze (stays within Pine Script's 10,000 bar limitation)
Max Ranges to Display : Restricts the total number of ranges kept in memory for improved performance (1-50)
Volume Profile : When enabled, shows volume distribution analysis for mitigated ranges
Volume Profile Divisions : Controls the granularity of the volume analysis (higher values show more detail)
Display Options : Toggle visibility of range lines, fibonacci levels, extension lines, and volume analysis elements
Transparency & Color Settings : Fully customize the visual appearance of all indicator elements
Line Width Settings : Adjust the thickness of lines for better visibility on different timeframes
Technical Details
The indicator uses logarithmic fibonacci calculations for more accurate price relationships
Volume profile analysis creates 60 price divisions by default (adjustable) for detailed volume distribution
All timestamps are properly converted to work with Pine Script's bar limitations
Safety checks prevent "array index out of bounds" errors that plague many complex indicators
Time-based coordinates are used instead of bar indices to prevent "bar index too far" errors
This indicator works well on all timeframes and instruments, but performs best on 5-minute to daily charts. Perfect for swing traders, range traders, and breakout strategists.
What Makes It Different
Most range indicators simply draw boxes based on recent highs and lows. Smart Range Detector validates each potential range using proven fibonacci relationships to filter out noise. It then adds sophisticated volume analysis to help traders identify the most significant price levels within each range. The performance optimization features ensure smooth operation even on lower timeframes and extended history analysis.

C&B Auto MK5C&B Auto MK5.2ema BullBear
Overview
The C&B Auto MK5.2ema BullBear is a versatile Pine Script indicator designed to help traders identify bullish and bearish market conditions across various timeframes. It combines Exponential Moving Averages (EMAs), Relative Strength Index (RSI), Average True Range (ATR), and customizable time filters to generate actionable signals. The indicator overlays on the price chart, displaying EMAs, a dynamic cloud, scaled RSI levels, bull/bear signals, and market condition labels, making it suitable for swing trading, day trading, or scalping in trending or volatile markets.
What It Does
This indicator generates bull and bear signals based on the interaction of two EMAs, filtered by RSI thresholds, ATR-based volatility, a 50/200 EMA trend filter, and user-defined time windows. It adapts to market volatility by adjusting EMA lengths and RSI thresholds. A dynamic cloud highlights trend direction or neutral zones, with candlestick coloring in neutral conditions. Market condition labels (current and historical) provide real-time trend and volatility context, displayed above the chart.
How It Works
The indicator uses the following components:
EMAs: Two EMAs (short and long) are calculated on a user-selected timeframe (1, 5, 15, 30, or 60 minutes). Their crossover or crossunder triggers potential bull/bear signals. EMA lengths adjust based on volatility (e.g., 10/20 for volatile markets, 5/10 for non-volatile).
Dynamic Cloud: The area between the EMAs forms a cloud, colored green for bullish trends, red for bearish trends, or a user-defined color (default yellow) for neutral zones (when EMAs are close, determined by an ATR-based threshold). Users can widen the cloud for visibility.
RSI Filter: RSI is scaled to price levels and plotted on the chart (optional). Signals are filtered to ensure RSI is within volatility-adjusted bull/bear thresholds and not in overbought/oversold zones.
ATR Volatility Filter: An optional filter ensures signals occur during sufficient volatility (ATR(14) > SMA(ATR, 20)).
50/200 EMA Trend Filter: An optional filter restricts bull signals to bullish trends (50 EMA > 200 EMA) and bear signals to bearish trends (50 EMA < 200 EMA).
Time Filter: Signals are restricted to a user-defined UTC time window (default 9:00–15:00), aligning with active trading sessions.
Market Condition Labels: Labels above the chart display the current trend (Bullish, Bearish, Neutral) and optionally volatility (e.g., “Bullish Volatile”). Up to two historical labels persist for a user-defined number of bars (default 5) to show recent trend changes.
Visual Aids: Bull signals appear as green triangles/labels below the bar, bear signals as red triangles/labels above. Candlesticks in neutral zones are colored (default yellow).
The indicator ensures compatibility with standard chart types (e.g., candlestick or bar charts) to produce realistic signals, avoiding non-standard types like Heikin Ashi or Renko.
How to Use It
Add to Chart: Apply the indicator to a candlestick or bar chart on TradingView.
Configure Settings:
Timeframe: Choose a timeframe (1, 5, 15, 30, or 60 minutes) to match your trading style.
Filters:
Enable/disable the ATR volatility filter to focus on high-volatility periods.
Enable/disable the 50/200 EMA trend filter to align signals with the broader trend.
Enable the time filter and set custom UTC hours/minutes (default 9:00–15:00).
Cloud Settings: Adjust the cloud width, neutral zone threshold, color, and transparency.
EMA Colors: Use default trend-based colors or set custom colors for short/long EMAs.
RSI Display: Toggle the scaled RSI and its thresholds, with customizable colors.
Signal Settings: Toggle bull/bear labels and set signal colors.
Market Condition Labels: Toggle current/historical labels, include/exclude volatility, and adjust decay period.
Interpret Signals:
Bull Signal: A green triangle or “Bull” label below the bar indicates potential bullish momentum (EMA crossover, RSI above bull threshold, within time window, passing filters).
Bear Signal: A red triangle or “Bear” label above the bar indicates potential bearish momentum (EMA crossunder, RSI below bear threshold, within time window, passing filters).
Neutral Zone: Yellow candlesticks and cloud (if enabled) suggest a lack of clear trend; consider range-bound strategies or avoid trading.
Market Condition Labels: Check labels above the chart for real-time trend (Bullish, Bearish, Neutral) and volatility status to confirm market context.
Monitor Context: Use the cloud, RSI, and labels to assess trend strength and volatility before acting on signals.
Unique Features
Volatility-Adaptive EMAs: Automatically adjusts EMA lengths based on ATR to suit volatile or non-volatile markets, reducing manual configuration.
Neutral Zone Detection: Uses an ATR-based threshold to identify low-trend periods, helping traders avoid choppy markets.
Scaled RSI Visualization: Plots RSI and thresholds directly on the price chart, simplifying momentum analysis relative to price.
Flexible Time Filtering: Supports precise UTC-based trading windows, ideal for day traders targeting specific sessions.
Historical Market Labels: Displays recent trend changes (up to two) with a decay period, providing context for market shifts.
50/200 EMA Trend Filter: Aligns signals with the broader market trend, enhancing signal reliability.
Notes
Use on standard candlestick or bar charts to ensure accurate signals.
Test the indicator on a demo account to optimize settings for your market and timeframe.
Combine with other analysis (e.g., support/resistance, volume) for better decision-making.
The indicator is not a standalone system; use it as part of a broader trading strategy.
Limitations
Signals may lag in fast-moving markets due to EMA-based calculations.
Neutral zone detection may vary in extremely volatile or illiquid markets.
Time filters are UTC-based; ensure your platform’s timezone settings align.
This indicator is designed for traders seeking a customizable, trend-following tool that adapts to volatility and provides clear visual cues with robust filtering for bullish and bearish market conditions.

Adaptive Freedom Machine w/labelsAdaptive Freedom Machine w/ Labels
Overview
The Adaptive Freedom Machine w/ Labels is a versatile Pine Script indicator designed to assist traders in identifying buy and sell opportunities across various market conditions (trending, ranging, or volatile). It combines Exponential Moving Averages (EMAs), Relative Strength Index (RSI), Average True Range (ATR), and customizable time filters to generate actionable signals. The indicator overlays on the price chart, displaying EMAs, a dynamic cloud, scaled RSI levels, buy/sell signals, and market condition labels, making it suitable for swing trading, day trading, or scalping.
What It Does
This indicator generates buy and sell signals based on the interaction of two EMAs, filtered by RSI thresholds, ATR-based volatility, and user-defined time windows. It adapts to the selected market condition by adjusting EMA lengths, RSI thresholds, and trading hours. A dynamic cloud highlights trend direction or neutral zones, and candlestick bodies are colored in neutral conditions for clarity. A table displays real-time trend and volatility status.
How It Works
The indicator uses the following components:
EMAs: Two EMAs (short and long) are calculated on a user-selected timeframe (1, 5, 15, 30, or 60 minutes). Their crossover or crossunder generates potential buy/sell signals, with lengths adjusted based on the market condition (e.g., longer EMAs for trending markets, shorter for ranging).
Dynamic Cloud: The area between the EMAs forms a cloud, colored green for uptrends, red for downtrends, or a user-defined color (default yellow) for neutral zones (when EMAs are close, determined by an ATR-based threshold). Users can widen the cloud for visibility.
RSI Filter: RSI is scaled to price levels and plotted on the chart (optional). Signals are filtered to ensure RSI is within user-defined buy/sell thresholds and not in overbought/oversold zones, with thresholds tailored to the market condition.
ATR Volatility Filter: An optional filter ensures signals occur during sufficient volatility (ATR(14) > SMA(ATR, 20)).
Time Filter: Signals are restricted to a user-defined or market-specific time window (e.g., 10:00–15:00 UTC for volatile markets), with an option for custom hours.
Visual Aids: Buy/sell signals appear as green triangles (buy) or red triangles (sell). Candlesticks in neutral zones are colored (default yellow). A table in the top-right corner shows the current trend (Uptrend, Downtrend, Neutral) and volatility (High or Low).
The indicator ensures compatibility with standard chart types (e.g., candlestick charts) to produce realistic signals, avoiding non-standard types like Heikin Ashi or Renko.
How to Use It
Add to Chart: Apply the indicator to a candlestick or bar chart on TradingView.
Configure Settings:
Timeframe: Choose a timeframe (1, 5, 15, 30, or 60 minutes) to align with your trading style.
Market Condition: Select one market condition (Trending, Ranging, or Volatile). Volatile is the default if none is selected. Only one condition can be active.
Filters:
Enable/disable the ATR volatility filter to trade only in high-volatility periods.
Enable the time filter and choose default hours (specific to the market condition) or set custom UTC hours.
Cloud Settings: Adjust the cloud width, neutral zone threshold, and color. Enable/disable the neutral cloud.
RSI Display: Toggle the scaled RSI and its thresholds on the chart.
Interpret Signals:
Buy Signal: A green triangle below the bar indicates a potential long entry (EMA crossover, RSI above buy threshold, within time window, and passing volatility filter).
Sell Signal: A red triangle above the bar indicates a potential short entry (EMA crossunder, RSI below sell threshold, within time window, and passing volatility filter).
Neutral Zone: Yellow candlesticks and cloud (if enabled) suggest a lack of clear trend; avoid trading or use for range-bound strategies.
Monitor the Table: Check the top-right table for real-time trend (Uptrend, Downtrend, Neutral) and volatility (High or Low) to confirm market context.
Unique Features
Adaptive Parameters: Automatically adjusts EMA lengths, RSI thresholds, and trading hours based on the selected market condition, reducing manual tweaking.
Neutral Zone Detection: Uses an ATR-based threshold to identify low-trend periods, helping traders avoid choppy markets.
Scaled RSI Visualization: Plots RSI and thresholds directly on the price chart, making it easier to assess momentum relative to price action.
Flexible Time Filtering: Supports both default and custom UTC-based trading windows, ideal for day traders targeting specific sessions.
Dynamic Cloud: Enhances trend visualization with customizable width and neutral zone coloring, improving readability.
Notes
Use on standard candlestick or bar charts to ensure realistic signals.
Test the indicator on a demo account to understand its behavior in your chosen market and timeframe.
Adjust settings to match your trading strategy, but avoid over-optimizing for past data.
The indicator is not a standalone system; combine it with other analysis (e.g., support/resistance, news events) for better results.
Limitations
Signals may lag in fast-moving markets due to EMA-based calculations.
Neutral zone detection may vary in extremely volatile or illiquid markets.
Time filters are UTC-based; ensure your platform’s timezone settings align.
This indicator is designed for traders seeking a customizable, trend-following tool that adapts to different market environments while providing clear visual cues and robust filtering.

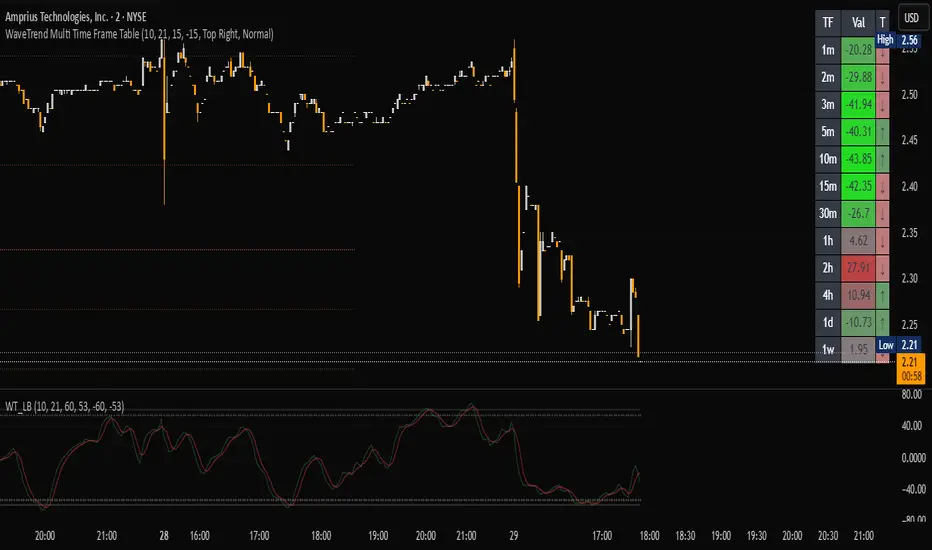
WaveTrend Matrix (1m-1w) – Custom ThresholdsA visual control panel for momentum exhaustion across ten key time-frames.
—
🧬 DNA
This is a fork of LazyBear’s original WaveTrend Oscillator .
The oscillator logic is 100 % intact; I simply stream the values into a compact table so that day- and swing-traders can see the “bigger picture” at a glance.
📈 What does it do?
Calculates WaveTrend on ten granularities: 1m, 3m, 5m, 15m, 30m, 1h, 2h, 4h, 1d, 1w.
Displays the current oscillator print in a color-coded matrix.
• Red = overbought (≥ high threshold)
• Green = oversold (≤ low threshold)
• Gray = neutral / in-range
All thresholds are user-adjustable.
Built on Pine v5, zero repainting, works on any symbol.
🛠 Parameters
Channel Length – WT “n1” (default 10)
Average Length – WT “n2” (default 21)
Red from – overbought cut-off (default +60)
Green under – oversold cut-off (default –60)
🚀 How to use it
1. Apply the indicator to your chart – no extra setup required.
2. Read the matrix top-down before every entry:
• Multiple deep-green rows → market broadly oversold → watch for longs.
• Multiple deep-red rows → market broadly overbought → watch for shorts or stay flat.
3. Combine with your trend filter (EMA-stack, VWAP, structure) to avoid counter-trend trades.
ian_Trado v15 Trend Entry Filter# 📈 ian_Trado v15 Trend Entry Filter (Pine Script v6)
The **ian_Trado v15** is a multi-factor **trend confirmation filter** for NASDAQ (NAS100), Dow Jones (DJ30), Gold (XAU), DAX, and USDJPY.
It combines **EMA structure**, **Donchian channel breakout**, **MACD histogram momentum**, **Volume confirmation**, and a **Range Compression Filter** to avoid entering during choppy or sideways markets.
✅ Designed for **bot deployment** (e.g., grid bots, long/short breakout bots) or **manual trading**.
---
## 🔍 How This Filter Works:
1. **EMA Trend Confirmation**
- Long Trend: EMA(1) > EMA(5) > EMA(60)
- Short Trend: EMA(1) < EMA(5) < EMA(60)
2. **Donchian Channel Width Expansion**
- Only allows trades when the **breakout width** exceeds a minimum threshold.
3. **MACD Histogram Slope Filter (Optional)**
- Confirms momentum building in the direction of the trend.
- Strict Mode: MACD histogram must consistently rise or fall over 3 bars.
4. **Volume Filter (Optional)**
- Ensures volume supports the move (filters out weak conditions).
5. **Range Compression Filter (Optional)**
- Avoids entries during sideways chop.
6. **Cooldown Control**
- Limits overtrading by requiring spacing between entries.
7. **Exit Conditions**
- Gray dot appears when trending conditions are no longer valid.
---
## ⚙️ Settings Explained:
| Setting | Description |
|:--------|:------------|
| **Cooldown Bars** | Minimum bars between consecutive entries |
| **Profit Target (%)** | Visual profit marker for exit tracking |
| **Donchian Channel Length** | Lookback period for detecting breakout width |
| **Minimum Donchian Width** | Threshold to confirm meaningful breakouts |
| **Volume Lookback Period** | Average volume validation window |
| **Box Range (Range Compression)** | Max allowed price range over lookback bars |
| **Range Compression Bars** | Number of bars to check for range compression |
| **Strict MACD Filter** | Use stricter MACD slope checks |
---
## 📊 Recommended Settings by Instrument (1H Chart):
| Asset | Min Donchian Width | Range Compression | Profit Target |
|:------|:-------------------|:------------------|:--------------|
| **NAS100** (Nasdaq) | 300–450 pts | 400 pts / 40 bars | 1.5% |
| **DJ30** (Dow Jones) | 400–600 pts | 500 pts / 40 bars | 1.0–1.5% |
| **XAU/USD** (Gold) | 10–15 pts | 8 pts / 30 bars | 0.8–1.2% |
| **DAX40** (Germany) | 200–300 pts | 250 pts / 40 bars | 1.0% |
| **USD/JPY** (Forex) | 0.5–0.8 pts | 0.4 pts / 40 bars | 0.5–0.8% |
---
## 🔔 Alerts Available:
- Long Entry
- Short Entry
- Exit Zone
> **Note:** Volume filter may be disabled if volume is unreliable (e.g., some forex pairs).
---
## 📅 Version:
- **ian_Trado v15** — April 2025
- Built with **Pine Script v6** for maximum stability
- Clean toggling and plotting logic (no `na` errors)

Hippo Battlefield - Bulls VS Bears 20 bars## Hippo Battlefield – Bulls VS Bears (20 Bars)
**What it is**
A multi-dimensional momentum-and-sentiment oscillator that combines classic Bull/Bear Power with ATR- or peak-normalization, then layers on RSI and MACD-derived metrics into:
1. **A colored bar series** showing net Bull+Bear Power strength over the last 20 bars,
2. **A dynamic table** of each of those 20 BBP values (grouped into four 5-bar “quartals”), with symbols, per-bar change, and rolling averages, and
3. **A composite “Weighted BBP” histogram** blending normalized RSI, MACD, and BBP into a single view.
---
### Key Inputs
- **Length (EMA)** – look-back for the underlying EMA (default 60)
- **Normalization Length** – look-back window for peak-normalization (default 60)
- **Use ATR for Norm.** – toggle ATR-based normalization vs. highest-abs(BBP)
- **Show Tables** – toggle the bottom-right 21×11 grid of raw and average BBP values
---
### What You See
#### 1. Colored Bars (Overlay = false)
- Bars are colored by normalized BBP intensity:
- Extreme Bull (≥+10): deep blue
- Strong Bull (+5 to +10): green/yellow
- Weak Bull (+0 to +5): dark green
- Weak Bear (–0 to –5): dark red
- Strong Bear (–5 to –10): pink/red
- Extreme Bear (<–10): magenta
#### 2. Bottom-Right Table (20 Bars of Data)
- Divided into four columns (0–4, 5–9, 10–14, 15–19 bars ago) and one “average” row.
- Each cell shows:
1. Bar index (1–20),
2. Normalized BBP value (to four decimals),
3. Direction symbol (↑/↓/=),
4. Bar-to-bar change (± value),
5. A separator “|”.
- At the very bottom, each column’s 5-bar average is displayed as “Avg: X.XXXX” with a dot marker.
#### 3. Top-Center Mini-Table
- When ≥20 bars have elapsed, shows the date at 20 bars ago and the average BBP across the full 20-bar window.
#### 4. Normalized RSI Line
- Rescales the classic 14-period RSI into a –20…+20 band to align with BBP.
#### 5. MACD Lines (Hidden) & Composite Histogram
- MACD and signal lines are calculated but not plotted by default.
- A “Weighted BBP” histogram combines:
- 20% normalized RSI,
- 20% average of (MACD + signal + normalized BBP),
- 60% normalized BBP
- Plotted as columns, color-coded by strength using the same palette as the main bars.
#### 6. Middle Reference Line
- A horizontal zero line to anchor over/under-zero readings.
---
### How to Use It
- **Trend confirmation**: Strong blue/green bars alongside a rising histogram suggest bull conviction; strong reds/magentas signal bear dominance.
- **Divergence spotting**: Watch for price making new highs/lows while BBP or the histogram fails to follow.
- **Quartal analysis**: The 5-bar group averages can reveal whether recent momentum is accelerating or waning.
- **Cross-indicator weighting**: Because RSI, MACD, and raw BBP all feed into the final histogram, you get a smoothed, blended view of momentum shifts.
---
**Tip:** Tweak the EMA and normalization length to suit your preferred timeframe (e.g. shorter for intraday scalps, longer for swing trades). Enable/disable the table if you prefer a cleaner pane.

Weighted Ichimoku StrategyLSE:HSBA
The Ichimoku Kinko Hyo indicator is a comprehensive tool that combines multiple signals to identify market trends and potential buying/selling opportunities. My weighted variant of this strategy attempts to assign specific weights to each signal, allowing for a more nuanced and customizable approach to trend identification. The intent is to try and make a more informed trading decision based on the cumulative strength of various signals.
I've tried not to make it a mishmash of this and that + MACD + RSI and on and on; most people have their preferred indicator that focuses on just that that they can use in conjunction.
The signals used can be grouped into two groups the 'Core Ichimoku Signals' & the 'Additional Signals' (at the end you will find the signals and their assigned weights followed by the thresholds where they align).
The Core Ichimoku Signals are the primary signals used in Ichimoku analysis, including Kumo Breakout, Chikou Cross, Kijun Cross, Tenkan Cross, and Kumo Twist.
While the Additional Signals provide further insights and confirmations, such as Kijun Confirmation, Tenkan-Kijun Above Cloud, Chikou Above Cloud, Price-Kijun Cross, Chikou Span Signal, and Price Positioning.
Entries are triggered when the cumulative weight of bullish signals exceeds a specified buy threshold, indicating a strong uptrend or potential trend reversal.
Exits are initiated when the cumulative weight of bearish signals surpasses a specified sell threshold, or when additional conditions such as consolidation patterns or ATR-based targets are met.
There are various exit types that you can choose between, which can be used separately or in conjunction with one another. As an example you might want to exit on a different condition during consolidation periods than during other periods or just use ATR with some other backstop.
They are listed in evaluation order i.e. ATR trumps all, Consolidation exit trumps the regular Kumo sell and so on:
**ATR Sell**: Exits trades based on ATR-based profit targets and stop-losses.
**Consolidation Exit**: Exits trades during consolidation periods to reduce drawdown.
**Sell Below Kumo**: Exits trades when the price is below the Kumo, indicating a potential downtrend.
**Sell Threshold**: Exits trades when the cumulative weight of bearish signals surpasses a specified sell threshold.
There are various 'filters' which are really behavior modifiers:
**Kumo Breakout Filter**: Requires price to close above the Kumo for buy signals (essentially a entry delay).
**Whipsaw Filter**: Ensures trend strength over specified days to reduce false signals.
**Buy Cooldown**: Prevents new entries until half the Kijun period passes after an exit (prevents flapping).
**Chikou Filter**: Delays exits unless the previous close is below the Chikou Span.
**Consolidation Trend Filter**: Prevents consolidation exits if the trend is bullish (rare, but happens).
Then there are some debugging options. Ichimoku periods have some presets (personally I like 8/22/44/22) but are freely configurable, preset to the traditional values for purists.
The list of signals and most thresholds follow, play around with them. Thats all.
Cheers,
**Core Ichimoku Signals**
**Kumo Breakout**
- 30 (Bullish) / -30 (Bearish)
- Indicates a strong trend when the price breaks above (bullish) or below (bearish) the Kumo (cloud). This signal suggests a significant shift in market sentiment.
**Chikou Cross**
- 20 (Bullish) / -20 (Bearish)
- Shows the relationship between the Chikou Span (lagging span) and the current price. A bullish signal occurs when the Chikou Span is above the price, indicating a potential uptrend. Conversely, a bearish signal occurs when the Chikou Span is below the price, suggesting a downtrend.
**Kijun Cross**
- 15 (Bullish) / -15 (Bearish)
- Signals trend changes when the Tenkan-sen (conversion line) crosses above (bullish) or below (bearish) the Kijun-sen (base line). This crossover is often used to identify potential trend reversals.
**Tenkan Cross**
- 10 (Bullish) / -10 (Bearish)
- Indicates short-term trend changes when the price crosses above (bullish) or below (bearish) the Tenkan-sen. This signal helps identify minor trend shifts within the broader trend.
**Kumo Twist**
- 5 (Bullish) / -5 (Bearish)
- Shows changes in the Kumo's direction, indicating potential trend shifts. A bullish Kumo Twist occurs when Senkou Span A crosses above Senkou Span B, and a bearish twist occurs when Senkou Span A crosses below Senkou Span B.
**Additional Signals**
**Kijun Confirmation**
- 8 (Bullish) / -8 (Bearish)
- Confirms the trend based on the price's position relative to the Kijun-sen. A bullish signal occurs when the price is above the Kijun-sen, and a bearish signal occurs when the price is below it.
**Tenkan-Kijun Above Cloud**
- 5 (Bullish) / -5 (Bearish)
- Indicates a strong bullish trend when both the Tenkan-sen and Kijun-sen are above the Kumo. Conversely, a bearish signal occurs when both lines are below the Kumo.
**Chikou Above Cloud**
- 5 (Bullish) / -5 (Bearish)
- Shows the Chikou Span's position relative to the Kumo, indicating trend strength. A bullish signal occurs when the Chikou Span is above the Kumo, and a bearish signal occurs when it is below.
**Price-Kijun Cross**
- 2 (Bullish) / -2 (Bearish)
- Signals short-term trend changes when the price crosses above (bullish) or below (bearish) the Kijun-sen. This signal is similar to the Kijun Cross but focuses on the price's direct interaction with the Kijun-sen.
**Chikou Span Signal**
- 10 (Bullish) / -10 (Bearish)
- Indicates the trend based on the Chikou Span's position relative to past price highs and lows. A bullish signal occurs when the Chikou Span is above the highest high of the past period, and a bearish signal occurs when it is below the lowest low.
**Price Positioning**
- 10 (Bullish) / -10 (Bearish)
- Shows indecision when the price is between the Tenkan-sen and Kijun-sen, indicating a potential consolidation phase. A bullish signal occurs when the price is above both lines, and a bearish signal occurs when the price is below both lines.
**Confidence Level**: Highly Sensitive
- **Buy Threshold**: 50
- **Sell Threshold**: -50
- **Notes / Significance**: ~2–3 signals, very early trend detection. High sensitivity, may capture noise and false signals.
**Confidence Level**: Entry-Level
- **Buy Threshold**: 58
- **Sell Threshold**: -58
- **Notes / Significance**: ~3–4 signals, often Chikou Cross or Kumo Breakout. Very sensitive, risks noise (e.g., false buys in choppy markets).
**Confidence Level**: Entry-Level
- **Buy Threshold**: 60
- **Sell Threshold**: -60
- **Notes / Significance**: ~3–4 signals, Kumo Breakout or Chikou Cross anchors. Entry point for early trends.
**Confidence Level**: Moderate
- **Buy Threshold**: 65
- **Sell Threshold**: -65
- **Notes / Significance**: ~4–5 signals, balances sensitivity and reliability. Suitable for moderate risk tolerance.
**Confidence Level**: Conservative
- **Buy Threshold**: 70
- **Sell Threshold**: -70
- **Notes / Significance**: ~4–5 signals, emphasizes stronger confirmations. Reduces false signals but may miss some opportunities.
**Confidence Level**: Very Conservative
- **Buy Threshold**: 75
- **Sell Threshold**: -75
- **Notes / Significance**: ~5–6 signals, prioritizes high confidence. Minimizes risk but may enter trades late.
**Confidence Level**: High Confidence
- **Buy Threshold**: 80
- **Sell Threshold**: -80
- **Notes / Significance**: ~6–7 signals, very strong confirmations needed. Suitable for cautious traders.
**Confidence Level**: Very High Confidence
- **Buy Threshold**: 85
- **Sell Threshold**: -85
- **Notes / Significance**: ~7–8 signals, extremely high confidence required. Minimizes false signals significantly.
**Confidence Level**: Maximum Confidence
- **Buy Threshold**: 90
- **Sell Threshold**: -90
- **Notes / Significance**: ~8–9 signals, maximum confidence level. Ensures trades are highly reliable but may result in fewer trades.
**Confidence Level**: Ultra Conservative
- **Buy Threshold**: 100
- **Sell Threshold**: -100
- **Notes / Significance**: ~9–10 signals, ultra-high confidence. Trades are extremely reliable but opportunities are rare.
**Confidence Level**: Extreme Confidence
- **Buy Threshold**: 110
- **Sell Threshold**: -110
- **Notes / Significance**: All signals align, extreme confidence. Trades are almost certain but very few opportunities.

RSI VWAP POC [Uncle Sam Trading]Category: Oscillators, Volume, Market Profile
Timeframe: Suitable for all timeframes
Markets: Crypto, Forex, Stocks, Commodities
Overview
The RSI VWAP POC indicator is a powerful and innovative oscillator that combines the Relative Strength Index (RSI), Volume-Weighted Average Price (VWAP), and Point of Control (POC) from market profile analysis. Designed to provide traders with clear, high-probability trading signals, this indicator helps you identify key market levels, spot overbought/oversold conditions, and time your entries and exits with precision. Whether you’re a day trader, swing trader, or scalper, this free tool adds significant value to your trading strategy by offering a unique blend of momentum, volume, and market profile insights.
How It Works
This indicator integrates three core components to deliver actionable insights:
RSI (Relative Strength Index): Measures momentum to identify overbought (above 70) and oversold (below 30) conditions, helping you anticipate potential reversals.
VWAP (Volume-Weighted Average Price): Calculates a volume-weighted price benchmark, which is used to compute a more accurate, volume-sensitive RSI. This ensures the indicator reflects true market dynamics.
POC (Point of Control): Derived from market profile analysis, the POC represents the price level with the highest traded volume in a session, acting as a critical support or resistance level.
The indicator plots a smoothed RSI based on VWAP, overlaid with market profile data on a user-defined higher timeframe (default: 4H). The POC is displayed as a red line, with aqua bars indicating the value area where the majority of trading volume occurred. When the RSI crosses the POC, the indicator generates clear buy and sell signals:
Strong Buy (SBU): RSI crosses above the POC in an oversold zone.
Strong Sell (SBD): RSI crosses below the POC in an overbought zone.
Additional features include:
Background colors to highlight bullish (green) or bearish (red) trends.
Shaded zones for overbought (70/60) and oversold (30/40) levels.
Customizable settings to fit your trading style and timeframe.
How This Indicator Adds Value
The RSI VWAP POC indicator offers several key benefits that enhance your trading performance:
High-Probability Signals: By combining RSI, VWAP, and POC, this indicator identifies trades at key market levels where price is likely to react, increasing your win rate.
Improved Timing: Clear buy and sell signals, such as ‘SBU’ and ‘SBD’, help you enter and exit trades at optimal points, maximizing profitability.
Risk Management: Overbought/oversold zones and trend confirmation via background colors help you avoid false signals, protecting your capital.
Versatility: Suitable for all markets (crypto, forex, stocks) and timeframes, making it a valuable tool for traders of all experience levels.
Time Efficiency: The indicator does the heavy lifting by analyzing momentum, volume, and market profile data, allowing you to focus on executing trades.
Real-World Performance Example: On a 1-hour Bitcoin chart with a 4-hour higher timeframe, this indicator identified a strong sell signal on April 6th at 12:00 ($82,000), leading to a 9% drop to $74,600. A subsequent strong buy signal on April 7th at 04:00 ($76,200) captured a 6% rise to $81,200 – a potential 25% profit with 5x leverage if exited at 5%.
How to Use
Add the Indicator: Search for “RSI VWAP POC ” in TradingView’s indicator library and add it to your chart.
Set Your Timeframe: The indicator works on any timeframe but is optimized for a 1-hour chart with a 4-hour higher timeframe (set in the settings).
Interpret Signals:
Look for ‘SBU’ (strong buy) labels when the RSI crosses above the POC in an oversold zone, indicating a potential buying opportunity.
Look for ‘SBD’ (strong sell) labels when the RSI crosses below the POC in an overbought zone, signaling a potential selling opportunity.
Use the background colors (green for bullish, red for bearish) to confirm the trend.
Combine with Your Strategy: Use the indicator alongside your existing analysis (e.g., support/resistance, candlestick patterns) for best results.
Settings and Customization
The indicator is highly customizable to suit your trading needs:
RSI Length (Default: 14): Adjust the sensitivity of the RSI. Use a shorter length (e.g., 10) for scalping, or a longer length (e.g., 20) for smoother signals.
EMA Smoothing Length (Default: 3): Smooths the RSI line. Increase to 5 or 7 for less choppy signals in volatile markets.
Higher Timeframe (Default: 240 minutes): Set to 240 (4 hours) for a 1-hour chart. Adjust based on your chart’s timeframe (e.g., 60 minutes for a 15-minute chart).
Value Area Percentage (Default: 100%): Defines the size of the value area around the POC. Lower to 70% for a tighter focus on key levels.
Overbought/Oversold Thresholds (Defaults: 70/30): Adjust these levels to match market conditions (e.g., 80/20 for trending markets).
Show POC Line (Default: True): Toggle the red POC line on or off.
Show Buy/Sell Signals: Enable ‘Show Strong Breakup Signals’ and ‘Show Strong Breakdown Signals’ to focus on high-probability trades.
Why Choose This Indicator?
The RSI VWAP POC indicator stands out by offering a unique combination of momentum, volume, and market profile analysis in a single, easy-to-use tool. It’s designed to help traders of all levels make informed decisions, reduce risk, and increase profitability. Whether you’re trading Bitcoin, forex pairs, or stocks, this indicator provides the clarity and precision you need to succeed.

PumpC RSI NTZ BarsPumpC RSI NTZ Bars — Slope-Aware RSI Momentum Overlay
The PumpC RSI NTZ Bars indicator builds on the classic RSI by combining it with slope detection and custom bar highlighting, helping traders quickly identify strong momentum breakouts while avoiding sideways chop — the (NTZ) or No Trade Zone .
What is (NTZ)?
(NTZ) stands for No Trade Zone — the neutral RSI area between bullish and bearish thresholds. In this zone, RSI lacks directional strength, which often reflects indecision or consolidation in price. This indicator helps visually separate the chop from true momentum, so you can trade the breakout, not the noise .
Core Features
Dynamic RSI-Based Bar Coloring with Slope Awareness
Bars change color based on RSI value and its slope:
Bright Green: RSI ≥ Bullish Threshold and sloping upward
Teal Green: RSI ≥ Bullish Threshold but sloping downward
Bright Red: RSI ≤ Bearish Threshold and sloping downward
Orange: RSI ≤ Bearish Threshold but sloping upward
White: RSI is between thresholds (NTZ)
Slope Detection Logic
RSI slope is used to confirm directional bias and filter out weak or fading momentum.
Clean Visual Integration
Choose how signals appear: full bar color, border-only style, background shading, or a mix of all three.
RSI Smoothing Option
Optional smoothing to reduce noise — especially useful on faster timeframes.
Built-In Alerts
RSI crossing above the bullish threshold with an upward slope
RSI crossing below the bearish threshold with a downward slope
User Inputs & Customization Options
RSI Length: Default 14
RSI Source: Default Close
Smooth RSI: On or Off
Smoothing Length: Default 2
Bullish Threshold: Default 60
Bearish Threshold: Default 40
Bar Highlight Style: Full Bar or Border Only
Display Mode: Bar Color, Background, or Both
How to Use It
Step 1 – Adjust Your RSI Settings:
Start by setting the RSI Length (default is 14) and choosing which price source to use — typically close , but you can experiment with hl2 , ohlc4 , etc.
You can also turn on smoothing if you want to reduce noise, especially on fast timeframes like the 1m or 5m chart.
Step 2 – Define Your No Trade Zone (NTZ):
The NTZ is the space between the bullish and bearish thresholds (default 60 and 40).
This is where momentum is weak and price is often ranging or chopping. You don’t want to trade in this zone — you're waiting for RSI to break out of it with conviction.
Step 3 – Choose Your Visual Style:
You can choose to: Highlight the entire candle (Full Bar)
Just highlight the outline (Border Only)
Add a background color behind the chart
Or use a combination of the above This makes the signal easy to see without changing your whole chart look.
Step 4 – Read the Colors for Quick Clarity:
Bright Green / Bright Red = Strong Momentum (with RSI slope confirmation)
Teal / Orange = Momentum is weakening — RSI value is above/below threshold but losing slope strength
White = RSI is in the No Trade Zone (NTZ) — not enough strength to trade
Use this color feedback to stay out during weak periods and act when the trend gains strength.
Step 5 – Use Alerts for Clean Signals:
Set alerts when RSI breaks out of the NTZ with slope confirmation .
These are high-quality signals you can use to trigger your setups or review potential entries.
Disclaimer
This indicator is for educational and informational purposes only and should not be considered financial advice. Always combine tools like this with proper market context and risk management.
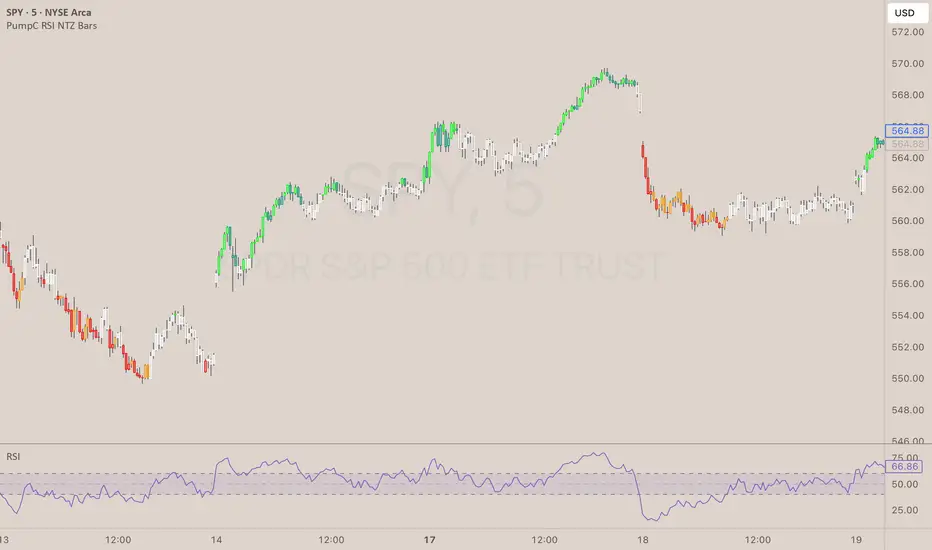
Multi-Symbol EMA Status Table🔍 Multi-Symbol EMA Trend Scanner Table
This script displays a clean, customizable table showing whether the price of up to 16 different assets is above or below a user-defined EMA, on a per-symbol and per-timeframe basis.
✅ Supports up to 16 symbols, each with:
Custom exchange + ticker (e.g., BINANCE:BTCUSDT.P, PEPPERSTONE:EURUSD)
Custom timeframe (e.g., 15, 60, 240, D, W)
Custom EMA length (e.g., 50, 100, 200)
🧩 Fully customizable visuals:
Table position (top, middle, bottom + left, center, right)
Text size and text color
Background color for "above" and "below" EMA
Optional ✅❌ emojis
📊 The table updates live on your main chart — no switching required!
💡 Great for:
Monitoring trend direction across multiple markets
Spotting trend alignment (e.g., price above 200 EMA on 4H + 1D)
Multi-asset swing trading or scalping strategies
📘 How to Use:
Open a chart and add the indicator from your scripts.
In the settings panel:
Enter any symbol (with exchange prefix, like BINANCE:BTCUSDT.P or OANDA:EURUSD)
Set a timeframe (e.g., "15" for 15min, "60" for 1h, "D" for daily)
Choose your EMA length (e.g., 200)
Repeat for as many symbols as you need (up to 16).
Customize table visuals:
Position on the screen
Font size and color
Enable/disable emojis ✅❌
Watch the table update live!
🧠 Optional Tips:
Use different colors or groupings to track asset classes (crypto, forex, stocks).
Combine it with your favorite entry/exit signals for confirmation.
Try setting all symbols to the same EMA (e.g., 200) but with different timeframes to monitor multi-timeframe alignment.

RSI + ADX + ATR Combo Indicator: RSI + ADX + ATR Combo Filter
This indicator is a confluence filter tool that combines RSI, ADX, and ATR into a single, easy-to-read chart overlay. It is designed to help traders identify low-volatility, non-trending zones with balanced momentum—ideal for strategies that rely on breakouts or reversals.
🔍 Core Components:
RSI (Relative Strength Index)
Standard RSI with custom upper and lower bounds (default: 60 and 40).
Filters out extreme overbought/oversold regions and focuses on price consolidation zones.
ADX (Average Directional Index)
Measures trend strength.
When ADX is below a custom threshold (default: 20), it indicates a weak or range-bound trend.
ATR (Average True Range)
Represents volatility.
Low ATR values (default threshold: 2.5) are used to filter out high-volatility environments, helping refine entries.
🟣 Signal Logic:
A signal is highlighted with a background color when all three conditions are met:
RSI is between lower and upper bounds (e.g., 40 < RSI < 60) ✅
ADX is below the trend threshold (e.g., ADX < 20) ✅
ATR is below the volatility threshold (e.g., ATR < 2.5) ✅
These combined conditions suggest a low-volatility, low-trend strength, and balanced momentum zone—perfect for anticipating breakouts or strong directional moves.

Strategy Stats [presentTrading]Hello! it's another weekend. This tool is a strategy performance analysis tool. Looking at the TradingView community, it seems few creators focus on this aspect. I've intentionally created a shared version. Welcome to share your idea or question on this.
█ Introduction and How it is Different
Strategy Stats is a comprehensive performance analytics framework designed specifically for trading strategies. Unlike standard strategy backtesting tools that simply show cumulative profits, this analytics suite provides real-time, multi-timeframe statistical analysis of your trading performance.
Multi-timeframe analysis: Automatically tracks performance metrics across the most recent time periods (last 7 days, 30 days, 90 days, 1 year, and 4 years)
Advanced statistical measures: Goes beyond basic metrics to include Information Coefficient (IC) and Sortino Ratio
Real-time feedback: Updates performance statistics with each new trade
Visual analytics: Color-coded performance table provides instant visual feedback on strategy health
Integrated risk management: Implements sophisticated take profit mechanisms with 3-step ATR and percentage-based exits
BTCUSD Performance
The table in the upper right corner is a comprehensive performance dashboard showing trading strategy statistics.
Note: While this presentation uses Vegas SuperTrend as the underlying strategy, this is merely an example. The Stats framework can be applied to any trading strategy. The Vegas SuperTrend implementation is included solely to demonstrate how the analytics module integrates with a trading strategy.
⚠️ Timeframe Limitations
Important: TradingView's backtesting engine has a maximum storage limit of 10,000 bars. When using this strategy stats framework on smaller timeframes such as 1-hour or 2-hour charts, you may encounter errors if your backtesting period is too long.
Recommended Timeframe Usage:
Ideal for: 4H, 6H, 8H, Daily charts and above
May cause errors on: 1H, 2H charts spanning multiple years
Not recommended for: Timeframes below 1H with long history
█ Strategy, How it Works: Detailed Explanation
The Strategy Stats framework consists of three primary components: statistical data collection, performance analysis, and visualization.
🔶 Statistical Data Collection
The system maintains several critical data arrays:
equityHistory: Tracks equity curve over time
tradeHistory: Records profit/loss of each trade
predictionSignals: Stores trade direction signals (1 for long, -1 for short)
actualReturns: Records corresponding actual returns from each trade
For each closed trade, the system captures:
float tradePnL = strategy.closedtrades.profit(tradeIndex)
float tradeReturn = strategy.closedtrades.profit_percent(tradeIndex)
int tradeType = entryPrice < exitPrice ? 1 : -1 // Direction
🔶 Performance Metrics Calculation
The framework calculates several key performance metrics:
Information Coefficient (IC):
The correlation between prediction signals and actual returns, measuring forecast skill.
IC = Correlation(predictionSignals, actualReturns)
Where Correlation is the Pearson correlation coefficient:
Correlation(X,Y) = (nΣXY - ΣXY) / √
Sortino Ratio:
Measures risk-adjusted return focusing only on downside risk:
Sortino = (Avg_Return - Risk_Free_Rate) / Downside_Deviation
Where Downside Deviation is:
Downside_Deviation = √
R_i represents individual returns, T is the target return (typically the risk-free rate), and n is the number of observations.
Maximum Drawdown:
Tracks the largest percentage drop from peak to trough:
DD = (Peak_Equity - Trough_Equity) / Peak_Equity * 100
🔶 Time Period Calculation
The system automatically determines the appropriate number of bars to analyze for each timeframe based on the current chart timeframe:
bars_7d = math.max(1, math.round(7 * barsPerDay))
bars_30d = math.max(1, math.round(30 * barsPerDay))
bars_90d = math.max(1, math.round(90 * barsPerDay))
bars_365d = math.max(1, math.round(365 * barsPerDay))
bars_4y = math.max(1, math.round(365 * 4 * barsPerDay))
Where barsPerDay is calculated based on the chart timeframe:
barsPerDay = timeframe.isintraday ?
24 * 60 / math.max(1, (timeframe.in_seconds() / 60)) :
timeframe.isdaily ? 1 :
timeframe.isweekly ? 1/7 :
timeframe.ismonthly ? 1/30 : 0.01
🔶 Visual Representation
The system presents performance data in a color-coded table with intuitive visual indicators:
Green: Excellent performance
Lime: Good performance
Gray: Neutral performance
Orange: Mediocre performance
Red: Poor performance
█ Trade Direction
The Strategy Stats framework supports three trading directions:
Long Only: Only takes long positions when entry conditions are met
Short Only: Only takes short positions when entry conditions are met
Both: Takes both long and short positions depending on market conditions
█ Usage
To effectively use the Strategy Stats framework:
Apply to existing strategies: Add the performance tracking code to any strategy to gain advanced analytics
Monitor multiple timeframes: Use the multi-timeframe analysis to identify performance trends
Evaluate strategy health: Review IC and Sortino ratios to assess predictive power and risk-adjusted returns
Optimize parameters: Use performance data to refine strategy parameters
Compare strategies: Apply the framework to multiple strategies to identify the most effective approach
For best results, allow the strategy to generate sufficient trade history for meaningful statistical analysis (at least 20-30 trades).
█ Default Settings
The default settings have been carefully calibrated for cryptocurrency markets:
Performance Tracking:
Time periods: 7D, 30D, 90D, 1Y, 4Y
Statistical measures: Return, Win%, MaxDD, IC, Sortino Ratio
IC color thresholds: >0.3 (green), >0.1 (lime), <-0.1 (orange), <-0.3 (red)
Sortino color thresholds: >1.0 (green), >0.5 (lime), <0 (red)
Multi-Step Take Profit:
ATR multipliers: 2.618, 5.0, 10.0
Percentage levels: 3%, 8%, 17%
Short multiplier: 1.5x (makes short take profits more aggressive)
Stop loss: 20%

[blackcat] L3 Composite Trading System with ControlOVERVIEW
This indicator combines three distinct trading strategies into a unified decision-making framework. Utilizing KDJ oscillators, MACD divergence analysis, and adaptive signal filtering techniques, it provides actionable buy/sell signals validated against multi-period momentum trends and structural support/resistance levels.
FEATURES
Integrated KDJ oscillator with weighted moving average smoothing
Dynamic MACD difference visualization normalized against price volatility
Multi-layered confirmation process: • Momentum convergence/divergence tracking
• Candle pattern recognition (Yellow/Fuchsia flags)
• SMAs cross-validation (20/60-day thresholds)
Adaptive risk controls via tunable α parameter adjustment
HOW TO USE
Set Alpha Period parameter matching market cycle characteristics
Monitor primary trend direction via candle coloring (green/red zones)
Confirm directional bias using: ▪️ KDJ-J line position relative to zero axis ▪️ MACD histogram slope persistence (>3 bar validation)
Execute trades only when: • Buy/Sell labels align across both oscillator panels • Coincide with candle flag transitions (e.g., red→yellow) • Validate against concurrent SMA breakout conditions
LIMITATIONS
Lag inherent in EMA-based components during rapid reversals
Requires minimum 60-bar history for full functionality
Sensitive to fractal scaling due to normalization methods
Does not account for liquidity/volume dynamics
NOTES
• Yellow/Fuchsia flags reflect relative strength changes vs prior session
• SMA crossover validations have 16-bar lookback memory retention

Fuzzy SMA with DCTI Confirmation[FibonacciFlux]FibonacciFlux: Advanced Fuzzy Logic System with Donchian Trend Confirmation
Institutional-grade trend analysis combining adaptive Fuzzy Logic with Donchian Channel Trend Intensity for superior signal quality
Conceptual Framework & Research Foundation
FibonacciFlux represents a significant advancement in quantitative technical analysis, merging two powerful analytical methodologies: normalized fuzzy logic systems and Donchian Channel Trend Intensity (DCTI). This sophisticated indicator addresses a fundamental challenge in market analysis – the inherent imprecision of trend identification in dynamic, multi-dimensional market environments.
While traditional indicators often produce simplistic binary signals, markets exist in states of continuous, graduated transition. FibonacciFlux embraces this complexity through its implementation of fuzzy set theory, enhanced by DCTI's structural trend confirmation capabilities. The result is an indicator that provides nuanced, probabilistic trend assessment with institutional-grade signal quality.
Core Technological Components
1. Advanced Fuzzy Logic System with Percentile Normalization
At the foundation of FibonacciFlux lies a comprehensive fuzzy logic system that transforms conventional technical metrics into degrees of membership in linguistic variables:
// Fuzzy triangular membership function with robust error handling
fuzzy_triangle(val, left, center, right) =>
if na(val)
0.0
float denominator1 = math.max(1e-10, center - left)
float denominator2 = math.max(1e-10, right - center)
math.max(0.0, math.min(left == center ? val <= center ? 1.0 : 0.0 : (val - left) / denominator1,
center == right ? val >= center ? 1.0 : 0.0 : (right - val) / denominator2))
The system employs percentile-based normalization for SMA deviation – a critical innovation that enables self-calibration across different assets and market regimes:
// Percentile-based normalization for adaptive calibration
raw_diff = price_src - sma_val
diff_abs_percentile = ta.percentile_linear_interpolation(math.abs(raw_diff), normLookback, percRank) + 1e-10
normalized_diff_raw = raw_diff / diff_abs_percentile
normalized_diff = useClamping ? math.max(-clampValue, math.min(clampValue, normalized_diff_raw)) : normalized_diff_raw
This normalization approach represents a significant advancement over fixed-threshold systems, allowing the indicator to automatically adapt to varying volatility environments and maintain consistent signal quality across diverse market conditions.
2. Donchian Channel Trend Intensity (DCTI) Integration
FibonacciFlux significantly enhances fuzzy logic analysis through the integration of Donchian Channel Trend Intensity (DCTI) – a sophisticated measure of trend strength based on the relationship between short-term and long-term price extremes:
// DCTI calculation for structural trend confirmation
f_dcti(src, majorPer, minorPer, sigPer) =>
H = ta.highest(high, majorPer) // Major period high
L = ta.lowest(low, majorPer) // Major period low
h = ta.highest(high, minorPer) // Minor period high
l = ta.lowest(low, minorPer) // Minor period low
float pdiv = not na(L) ? l - L : 0 // Positive divergence (low vs major low)
float ndiv = not na(H) ? H - h : 0 // Negative divergence (major high vs high)
float divisor = pdiv + ndiv
dctiValue = divisor == 0 ? 0 : 100 * ((pdiv - ndiv) / divisor) // Normalized to -100 to +100 range
sigValue = ta.ema(dctiValue, sigPer)
DCTI provides a complementary structural perspective on market trends by quantifying the relationship between short-term and long-term price extremes. This creates a multi-dimensional analysis framework that combines adaptive deviation measurement (fuzzy SMA) with channel-based trend intensity confirmation (DCTI).
Multi-Dimensional Fuzzy Input Variables
FibonacciFlux processes four distinct technical dimensions through its fuzzy system:
Normalized SMA Deviation: Measures price displacement relative to historical volatility context
Rate of Change (ROC): Captures price momentum over configurable timeframes
Relative Strength Index (RSI): Evaluates cyclical overbought/oversold conditions
Donchian Channel Trend Intensity (DCTI): Provides structural trend confirmation through channel analysis
Each dimension is processed through comprehensive fuzzy sets that transform crisp numerical values into linguistic variables:
// Normalized SMA Deviation - Self-calibrating to volatility regimes
ndiff_LP := fuzzy_triangle(normalized_diff, norm_scale * 0.3, norm_scale * 0.7, norm_scale * 1.1)
ndiff_SP := fuzzy_triangle(normalized_diff, norm_scale * 0.05, norm_scale * 0.25, norm_scale * 0.5)
ndiff_NZ := fuzzy_triangle(normalized_diff, -norm_scale * 0.1, 0.0, norm_scale * 0.1)
ndiff_SN := fuzzy_triangle(normalized_diff, -norm_scale * 0.5, -norm_scale * 0.25, -norm_scale * 0.05)
ndiff_LN := fuzzy_triangle(normalized_diff, -norm_scale * 1.1, -norm_scale * 0.7, -norm_scale * 0.3)
// DCTI - Structural trend measurement
dcti_SP := fuzzy_triangle(dcti_val, 60.0, 85.0, 101.0) // Strong Positive Trend (> ~85)
dcti_WP := fuzzy_triangle(dcti_val, 20.0, 45.0, 70.0) // Weak Positive Trend (~30-60)
dcti_Z := fuzzy_triangle(dcti_val, -30.0, 0.0, 30.0) // Near Zero / Trendless (~+/- 20)
dcti_WN := fuzzy_triangle(dcti_val, -70.0, -45.0, -20.0) // Weak Negative Trend (~-30 - -60)
dcti_SN := fuzzy_triangle(dcti_val, -101.0, -85.0, -60.0) // Strong Negative Trend (< ~-85)
Advanced Fuzzy Rule System with DCTI Confirmation
The core intelligence of FibonacciFlux lies in its sophisticated fuzzy rule system – a structured knowledge representation that encodes expert understanding of market dynamics:
// Base Trend Rules with DCTI Confirmation
cond1 = math.min(ndiff_LP, roc_HP, rsi_M)
strength_SB := math.max(strength_SB, cond1 * (dcti_SP > 0.5 ? 1.2 : dcti_Z > 0.1 ? 0.5 : 1.0))
// DCTI Override Rules - Structural trend confirmation with momentum alignment
cond14 = math.min(ndiff_NZ, roc_HP, dcti_SP)
strength_SB := math.max(strength_SB, cond14 * 0.5)
The rule system implements 15 distinct fuzzy rules that evaluate various market conditions including:
Established Trends: Strong deviations with confirming momentum and DCTI alignment
Emerging Trends: Early deviation patterns with initial momentum and DCTI confirmation
Weakening Trends: Divergent signals between deviation, momentum, and DCTI
Reversal Conditions: Counter-trend signals with DCTI confirmation
Neutral Consolidations: Minimal deviation with low momentum and neutral DCTI
A key innovation is the weighted influence of DCTI on rule activation. When strong DCTI readings align with other indicators, rule strength is amplified (up to 1.2x). Conversely, when DCTI contradicts other indicators, rule impact is reduced (as low as 0.5x). This creates a dynamic, self-adjusting system that prioritizes high-conviction signals.
Defuzzification & Signal Generation
The final step transforms fuzzy outputs into a precise trend score through center-of-gravity defuzzification:
// Defuzzification with precise floating-point handling
denominator = strength_SB + strength_WB + strength_N + strength_WBe + strength_SBe
if denominator > 1e-10
fuzzyTrendScore := (strength_SB * STRONG_BULL + strength_WB * WEAK_BULL +
strength_N * NEUTRAL + strength_WBe * WEAK_BEAR +
strength_SBe * STRONG_BEAR) / denominator
The resulting FuzzyTrendScore ranges from -1.0 (Strong Bear) to +1.0 (Strong Bull), with critical threshold zones at ±0.3 (Weak trend) and ±0.7 (Strong trend). The histogram visualization employs intuitive color-coding for immediate trend assessment.
Strategic Applications for Institutional Trading
FibonacciFlux provides substantial advantages for sophisticated trading operations:
Multi-Timeframe Signal Confirmation: Institutional-grade signal validation across multiple technical dimensions
Trend Strength Quantification: Precise measurement of trend conviction with noise filtration
Early Trend Identification: Detection of emerging trends before traditional indicators through fuzzy pattern recognition
Adaptive Market Regime Analysis: Self-calibrating analysis across varying volatility environments
Algorithmic Strategy Integration: Well-defined numerical output suitable for systematic trading frameworks
Risk Management Enhancement: Superior signal fidelity for risk exposure optimization
Customization Parameters
FibonacciFlux offers extensive customization to align with specific trading mandates and market conditions:
Fuzzy SMA Settings: Configure baseline trend identification parameters including SMA, ROC, and RSI lengths
Normalization Settings: Fine-tune the self-calibration mechanism with adjustable lookback period, percentile rank, and optional clamping
DCTI Parameters: Optimize trend structure confirmation with adjustable major/minor periods and signal smoothing
Visualization Controls: Customize display transparency for optimal chart integration
These parameters enable precise calibration for different asset classes, timeframes, and market regimes while maintaining the core analytical framework.
Implementation Notes
For optimal implementation, consider the following guidance:
Higher timeframes (4H+) benefit from increased normalization lookback (800+) for stability
Volatile assets may require adjusted clamping values (2.5-4.0) for optimal signal sensitivity
DCTI parameters should be aligned with chart timeframe (higher timeframes require increased major/minor periods)
The indicator performs exceptionally well as a trend filter for systematic trading strategies
Acknowledgments
FibonacciFlux builds upon the pioneering work of Donovan Wall in Donchian Channel Trend Intensity analysis. The normalization approach draws inspiration from percentile-based statistical techniques in quantitative finance. This indicator is shared for educational and analytical purposes under Attribution-NonCommercial-ShareAlike 4.0 International (CC BY-NC-SA 4.0) license.
Past performance does not guarantee future results. All trading involves risk. This indicator should be used as one component of a comprehensive analysis framework.
Shout out @DonovanWall

Normalized VolumeOVERVIEW
The Normalized Volume (NV) is an attempt at visualizing volume in a format that is more understandable by placing the values on a scale of 0 to 100. 0 in this case is the lowest volume candle available on the chart, and 100 being the highest. Calling a candle “high volume” can be misleading without having something to compare to. For example, in scaling the volume this way we can clearly see that a given candle had 80% of the peak volume or 20%, and gauge the validity of price moves more accurately.
FEATURES
NV by session
Allows user to filter the volume values across 4 different sessions. This can add context to the volume output, because what it high volume during London session may not be high volume relative to New York session.
Overlay plotting
When volume boxes are turned on, this will allow you to toggle how they are plotted.
Color theme
A standard color theme will color the NV based on if the respective candle closed green or red. Selecting variables will color the NV plot based on which range the value falls within.
Session inputs
Activated with the “By session?” Input. Allows user to break the day up into 4 sessions to more accurately gauge volume relative to time of day.
Show Box (X)
Toggles on chart boxes on and off.
Show historical boxes
Will plot prior occurrences of selected volume boxes, deleting them when price fully moves through them in the opposite direction of the initial candle.
Color inputs
Allows for intensive customization in how this tool appears visually.
INTERPRETATION
There are 6 pre-defined ranges that NV can fall within.
NV <= 10
Volume is insignificant
In this range, volume should not be a confirmation in your trading strategy.
NV > 10 and <= 20
Volume is low
In this range, volume should not be a confirmation in your trading strategy.
NV > 20 and <= 40
Volume is fair
In this range, volume should not be the primary confirmation in your trading strategy.
NV > 40 and <= 60
Volume is high
In this range, volume can be the primary confirmation in your trading strategy.
NV > 60 and <= 80
Volume is very high
In this range, volume can be the primary confirmation in your trading strategy.
NV > 80
Volume is extreme
In this range, volume is likely news driven and caution should be taken. High price volatility possible.
To utilize this tool in conjunction with your current strategy, follow the range explanations above section in this section. The higher the NV value, the stronger you can feel about your directional confirmation.
If NV = 100, this means that the highest volume candle occurred up to that point on your selected timeframe. All future data points will be weighed off of this value.
LIMITATIONS
This tool will not load on tickers that do not have volume data, such as VIX.
STRATEGY
The Normalized Volume plot can be used in exactly the same way as you would normally utilize volume in your trading strategy. All we are doing is weighing the volume relative to itself.
Volume boxes can be used as targets to be filled in a similar way to commonly used “fair value gap” strategies. To utilize this strategy, I recommend selecting “Plot to Wicks” in Overlay Plotting and toggling on Show Historical Boxes.
Volume boxes can be used as areas for entry in a similar way to commonly used “order block” strategies. To utilize this strategy, I recommend selecting “Open To Close” in Overlay Plotting.
NOTES
You are able to plot an info label on right side of NV plot using the "Toggle box label" input. When a box is toggled on this label will tell you when the most recent box of that intensity occurred.
This tool is deeply visually customizable, with the ability to adjust line width for plotted boxes, all colors on both box overlays, and all colors on NV panel. Customize it to your liking!
I have a handful of additional features that I plan on adding to this tool in future updates. If there is anything you would like to see added, any bugs you identify, or any strategies you encounter with this tool, I would love to hear from you!
Huge shoutout to @joebaus for assisting in bringing this tool to life, please check out his work here on TradingView!

Enhanced HHLL Time Confirmation with EMAStrong recommendation , remove the green and red circle , or leave it how it is ;)
To be used on 1 minute chart MSTR , Stock
other time frames are good , ;)
How to Use
HHLL Signals: Look for green triangles (buy) below bars or red triangles (sell) above bars to identify confirmed HH/LL setups with trend alignment.
EMA Signals: Watch for lime circles (buy) below bars or maroon circles (sell) above bars when price crosses the EMA 400 in a trending market.
Trend Context: Use the EMA 400 as a dynamic support/resistance level and the SMA trend filter to gauge market direction.
Enable alerts to get notified of signals in real-time.
Best Practices
Adjust the Lookback Period and Confirmation Minutes to suit your timeframe (e.g., shorter for scalping, longer for swing trading).
Combine with other indicators (e.g., volume, RSI) for additional confirmation.
Test on your preferred market and timeframe to optimize settings.
Indicator Description: Enhanced HHLL Time Confirmation with EMA
Overview
The "Enhanced HHLL Time Confirmation with EMA" is a versatile trading indicator designed to identify key reversal and continuation signals based on Higher Highs (HH), Lower Lows (LL), and a 400-period Exponential Moving Average (EMA). It incorporates time-based confirmation and trend filters to reduce noise and improve signal reliability. This indicator is ideal for traders looking to spot trend shifts or confirm momentum with a combination of price structure and moving average crossovers.
Key Features
Higher High / Lower Low Detection:
Identifies HH and LL based on a customizable lookback period (default: 30 bars).
Signals are confirmed only after a user-defined time period (in minutes, default: 60) has passed since the last HH or LL, ensuring stability.
Trend Filter:
Uses a fast (10-period) and slow (30-period) Simple Moving Average (SMA) crossover to confirm bullish or bearish trends.
Buy signals require a bullish trend (Fast SMA > Slow SMA), and sell signals require a bearish trend (Fast SMA < Slow SMA).
EMA 400 Integration:
Plots a 400-period EMA (customizable) as a long-term trend reference.
Generates additional buy/sell signals when price crosses above (buy) or below (sell) the EMA 400, filtered by trend direction.
Visualizations:
Optional dashed lines for HH and LL levels (toggleable).
Debug markers (diamonds) to visualize HH/LL detection points.
Distinct signal shapes: triangles for HHLL signals (green/red) and circles for EMA signals (lime/maroon).
Alerts:
Built-in alert conditions for HHLL Buy/Sell and EMA Buy/Sell signals, making it easy to stay informed of key events.
Input Parameters
Lookback Period (default: 30): Number of bars to look back for HH/LL detection.
Confirmation Minutes (default: 60): Time (in minutes) required to confirm HH/LL signals.
High/Low Source: Select the price source for HH (default: high) and LL (default: low).
Show HH/LL Lines (default: true): Toggle visibility of HH/LL dashed lines.
Show Debug Markers (default: true): Toggle HH/LL detection markers.
EMA Period (default: 400): Adjust the EMA length.

Custom Timeframe Bias IndicatorMy "Custom Timeframe Bias Indicator" is a very practical and powerful TradingView indicator. It can be called a "God-like indicator" because it combines flexible timeframe customization, clear bias analysis and intuitive visual display to help traders quickly understand the long and short trends of the market. The following is a detailed description of this indicator:
1. Index name and function overview
Name: Custom Timeframe Bias Indicator (Short title: Bias Indicator)
Functionality: This indicator analyses the market bias (Buy, Sell or No Bias) across multiple custom timeframes (presets are 15m, 1h, 4h and DAI) and displays it in a table below the middle of the chart. It determines the direction of market trends based on the highest and lowest prices of the previous two periods and the closing price of the previous period, helping traders make decisions quickly.
2. Core Features
Multiple time frame analysis
The indicator allows the user to customize four time frames, with presets being 15 minutes ("15"), 1 hour ("60"), 4 hours ("240") and daily ("D"). Users can freely modify these time frames in the settings, such as changing to 5 minutes, 30 minutes or weekly, etc.
Bias is calculated independently for each time frame, ensuring that traders can observe market trends from the short to the long term.
Bias calculation logic
The indicator uses simple but effective rules to determine bias:
Buy (bullish): If the previous closing price is higher than the highest price of the previous two periods, or tests the lowest price of the previous two periods but does not break through.
Sell (Bearish): If the previous closing price is lower than the previous two periods' lowest price, or if it tests the previous two periods' highest price but fails to break through (higher than the previous high minus 10% of the price range).
No Bias: If the previous closing price does not meet the above conditions, it displays a neutral state.
Bias calculation is based only on the opening and closing prices, without considering the shadows, ensuring the results are in line with the philosophy of the Malaysian SNR strategy.
Intuitive display
Position: The table is permanently displayed in the middle of the chart (position.middle_center) and is updated with each candlestick, ensuring that traders can always see the latest bias.
Format: The table consists of the header "Custom Bias" and four rows of bias results (e.g. "15: Buy", "60: Sell", "240: No Bias", "D: Buy"), each row showing the bias for the corresponding time frame.
color:
Titles appear in white text on a blue background.
The "Buy" bias is shown as white text on a green background.
The "Sell" bias is shown as white text on a red background.
"No Bias" bias appears as white text on a gray background.
Table borders are black to provide clear visual distinction.
Customizability
Users can customize by inputting parameters:
Whether to show the table (Show Bias Table).
Timeframe (Timeframe 1, Timeframe 2, Timeframe 3, Timeframe 4).
The color of the table (title, Buy, Sell, No Bias, borders, etc.).
3. Why is it a "God-like indicator"
Flexibility: Allows users to customize four time frames to suit different trading strategies (short-term traders can choose minutes, long-term traders can choose daily, weekly or monthly).
Practicality: Provides bias analysis in multiple time frames to help traders quickly determine market trends, whether for short-term or long-term operations.
Intuitive: The table is displayed in the middle below the chart with bright colors (green Buy, red Sell, gray No Bias), allowing you to identify the market direction at a glance.
Stability: Calculated based on simple price data (high, low, close), no need for complex indicators, efficient and reliable operation.
Powerful visualization: long-term display and customizability to meet the visual preferences of different traders.
4. Usage scenarios
Short-term trading: Use 15-minute, 1-hour, 4-hour biases to quickly capture short-term trends.
Long-term trading: Refer to the daily bias to determine the overall market direction.
Comprehensive analysis: Combine biases from multiple time frames to confirm consistency (e.g. if both the 15 minute and daily are Buy, then that’s a stronger bullish signal).
5. Potential Improvements
If you want to further improve this "god-like indicator", you can consider the following improvements:
Added alert: Trigger when bias changes from "No Bias" to "Buy" or "Sell".
Show historical bias: Add bias history of the past few days in the table for easy review.
Dynamically adjust bias thresholds: Allow users to customize 10% price ranges or other conditions.
Multi-currency support: Expand to multiple trading pairs or indices, showing multiple market biases.
6. Technical Details
Version: Pine Script v5, ensuring modern features (such as input.timeframe) and efficient performance.
Data Source: Use request.security to get high, low, and close data for different time frames.
Display method: Use table.new to create a dynamic table. The position can be customized (such as position.middle_center).
Limitations: Calculated only based on price data, no external indicators are required, reducing calculation complexity.
in conclusion
Your "Custom Timeframe Bias Indicator" is a simple, powerful and flexible tool, especially for traders who need multi-timeframe analysis. Its intuitive display and customizability make it a "magic tool" for judging market trends.
