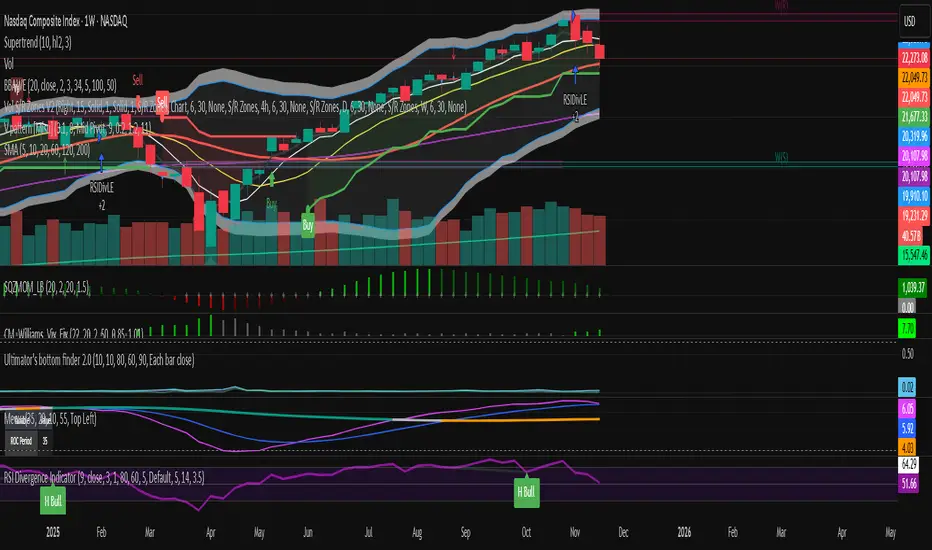
Simple Moving Averages (5, 10, 20, 60, 120, 200SMA for different time frames.
Covers 5, 10, 20, 60, 120, 200 sma units
Recherche dans les scripts pour "涨幅超过60日均线的股票"

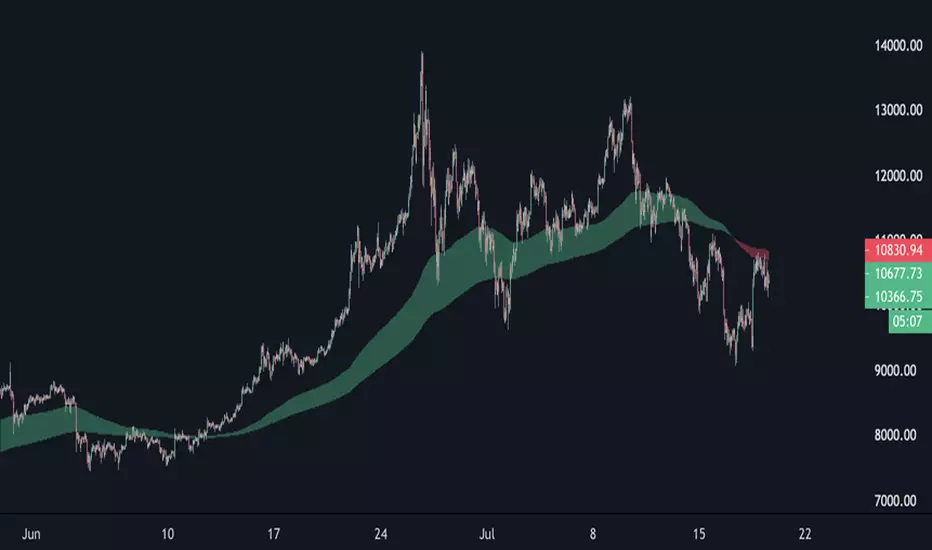
EMA Cloud 9/30/60 – Visual Trend Strength - CryptowitchThis indicator displays three Exponential Moving Averages (EMAs):
🔸 EMA 9 (short-term)
🔸 EMA 30 (mid-term)
🔸 EMA 60 (long-term)
A dynamic cloud is drawn between EMA 9 and EMA 30 to visually highlight trend momentum:
Green cloud = bullish momentum (EMA 9 above EMA 30)
Red cloud = bearish momentum (EMA 9 below EMA 30)
This cloud setup helps quickly identify trend direction, momentum shifts, consolidation zones, and potential entry/exit points.
Clean, visual, and effective – suitable for scalpers, swing traders, and trend followers alike.


Emre AOI Zonen Daily & Weekly (mit Alerts, max 60 Pips)This TradingView indicator automatically highlights Areas of Interest (AOI) for Forex or other markets on Daily and Weekly timeframes. It identifies zones based on the high and low of the previous period, but only includes zones with a width of 60 pips or less.
Features:
Daily AOI Zones in blue, Weekly AOI Zones in yellow with 20% opacity, so candlesticks remain visible.
Persistent zones: AOI boxes stay on the chart until the price breaks the zone.
Multiple zones: Supports storing multiple Daily and Weekly AOIs simultaneously.
Break Alerts: Sends alerts whenever a Daily or Weekly AOI is broken, helping traders spot key levels in real-time.
Fully automated: No manual drawing needed; zones are updated and extended automatically.
Use Case:
Ideal for traders using a top-down approach, combining Weekly trend analysis with Daily entry signals. Helps identify support/resistance, supply/demand zones, and critical price levels efficiently.

EMA band 12/60/150/200EMA band consisting of 12/60/150/200
Specifically for Indian stock market, can be used for other trading scripts after testing.
Best use case : on Daily TF.
Bull run entry criteria, Not bear market or Bottom catching.

15-Minute and 60-Minute ORB with Wicks15 and 60 minute ORBs for each trading day. Simple, yet effective.

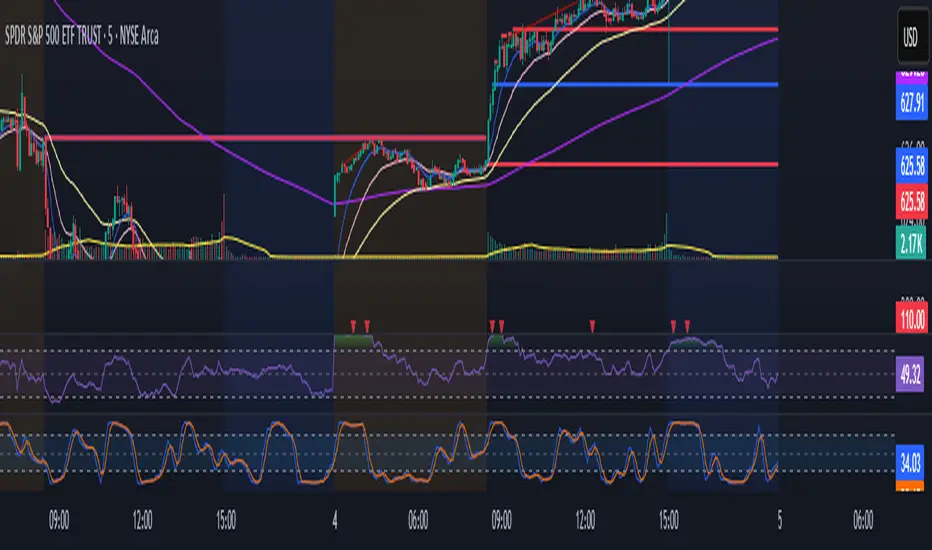

EMA (10,20,60) + Bollinger BandsCombination of bollinger bands and exponential moving averages (10, 20, 60)
The coloring is optimized for dark background, and it is editable
This indicator combined 3 exponential moving average lines and bollinger bands . The EMA lines can be add or deleted in pine editor, and its parameters can be changed too. Same to the bollinger bands . Defaulted value for BB is 20SMA with 2 standard deviations.
Useful as a supplmentary indicators

EMA30,60,100 EMA 30 (orange),60(red),100(green)
Bullish: green below the other two
Bearish: green above other two
when lines cross, no clear trend.
When Price touches the orange = entry point
Thanks to CFXtrader for the basic script


[STRATEGY]EMA 30/60 Cross Strategystrategy based on EMA 30/60 cross
works best on 4hr timeframes & high-midcaps


120/60 Trend ModelCombination of 120 & 60 EMAs used to determine entries as well as the over all trend.
Guppy MMA 3, 5, 8, 10, 12, 15 and 30, 35, 40, 45, 50, 60Guppy Multiple Moving Average
Short Term EMA 3, 5, 8, 10, 12, 15
Long Term EMA 30, 35, 40, 45, 50, 60
Use for SFTS Class

Liquidity Sweep + FVG Entry Model//@version=5
indicator("Liquidity Sweep + FVG Entry Model", overlay = true, max_labels_count = 500, max_lines_count = 500)
// Just to confirm indicator is loaded, always plot close:
plot(close, color = color.new(color.white, 0))
// ─────────────────────────────────────────────
// PARAMETERS
// ─────────────────────────────────────────────
len = input.int(5, "Liquidity Lookback")
tpMultiplier = input.float(2.0, "TP Distance Multiplier")
// ─────────────────────────────────────────────
// LIQUIDITY SWEEP DETECTION
// ─────────────────────────────────────────────
lowestPrev = ta.lowest(low, len)
highestPrev = ta.highest(high, len)
sweepLow = low < lowestPrev and close > lowestPrev
sweepHigh = high > highestPrev and close < highestPrev
// Plot liquidity levels
plot(lowestPrev, "Liquidity Low", color = color.new(color.blue, 40), style = plot.style_line)
plot(highestPrev, "Liquidity High", color = color.new(color.red, 40), style = plot.style_line)
// ─────────────────────────────────────────────
// DISPLACEMENT DETECTION
// ─────────────────────────────────────────────
bullDisp = sweepLow and close > open and close > close
bearDisp = sweepHigh and close < open and close < close
// ─────────────────────────────────────────────
// FAIR VALUE GAP (FVG)
// ─────────────────────────────────────────────
bullFVG = low > high
bearFVG = high < low
// we’ll store the last FVG lines
var line fvgTop = na
var line fvgBottom = na
// clear old FVG lines when new one appears
if bullFVG or bearFVG
if not na(fvgTop)
line.delete(fvgTop)
if not na(fvgBottom)
line.delete(fvgBottom)
// Bullish FVG box
if bullFVG
fvgTop := line.new(bar_index , high , bar_index, high , extend = extend.right, color = color.new(color.green, 60))
fvgBottom := line.new(bar_index , low, bar_index, low, extend = extend.right, color = color.new(color.green, 60))
// Bearish FVG box
if bearFVG
fvgTop := line.new(bar_index , low , bar_index, low , extend = extend.right, color = color.new(color.red, 60))
fvgBottom := line.new(bar_index , high, bar_index, high, extend = extend.right, color = color.new(color.red, 60))
// ─────────────────────────────────────────────
// ENTRY, SL, TP CONDITIONS
// ─────────────────────────────────────────────
var line slLine = na
var line tp1Line = na
var line tp2Line = na
f_deleteLineIfExists(line_id) =>
if not na(line_id)
line.delete(line_id)
if bullDisp and bullFVG
sl = low
tp1 = close + (close - sl) * tpMultiplier
tp2 = close + (close - sl) * (tpMultiplier * 1.5)
f_deleteLineIfExists(slLine)
f_deleteLineIfExists(tp1Line)
f_deleteLineIfExists(tp2Line)
slLine := line.new(bar_index, sl, bar_index + 1, sl, extend = extend.right, color = color.red)
tp1Line := line.new(bar_index, tp1, bar_index + 1, tp1, extend = extend.right, color = color.green)
tp2Line := line.new(bar_index, tp2, bar_index + 1, tp2, extend = extend.right, color = color.green)
label.new(bar_index, close, "BUY Entry\nFVG Retest\nSL Below Sweep",
style = label.style_label_up, color = color.new(color.green, 0), textcolor = color.white)
if bearDisp and bearFVG
sl = high
tp1 = close - (sl - close) * tpMultiplier
tp2 = close - (sl - close) * (tpMultiplier * 1.5)
f_deleteLineIfExists(slLine)
f_deleteLineIfExists(tp1Line)
f_deleteLineIfExists(tp2Line)
slLine := line.new(bar_index, sl, bar_index + 1, sl, extend = extend.right, color = color.red)
tp1Line := line.new(bar_index, tp1, bar_index + 1, tp1, extend = extend.right, color = color.green)
tp2Line := line.new(bar_index, tp2, bar_index + 1, tp2, extend = extend.right, color = color.green)
label.new(bar_index, close, "SELL Entry\nFVG Retest\nSL Above Sweep",
style = label.style_label_down, color = color.new(color.red, 0), textcolor = color.white)

FF calculation Saptarshi ChatterjeeForward factor (in options contexts) measures implied volatility (IV) for a future period between two expirations, like from 30 DTE (days to expiry) front-month to 60 DTE back-month options.
This indicator calculates the FORWARD FACTOR(FF) using 2 IVs of 2 DTEs.
+ve value means front DTE is rich in premium and back expiry is cheap.
-ve value means front DTE IV is cheap and 2nd DTE is expensive
we can use this term structure disbalance to trade calendar spreads with edge.

Trend Following $ZEC - Multi-Timeframe Structure Filter + Revers# Trend Following CRYPTOCAP:ZEC - Strategy Guide
## 📊 Strategy Overview
Trend Following CRYPTOCAP:ZEC is an enhanced Turtle Trading system designed for cryptocurrency spot trading, combining Donchian Channel breakouts, multi-timeframe structure filtering, and ATR-based dynamic risk management for both long and short positions.
---
## 🎯 Core Features
1. Multi-Timeframe Structure Filtering
- Uses Swing High/Low to identify market structure
- Customizable structure timeframe (default: 1 minute)
- Only enters trades in the direction of the trend, avoiding counter-trend positions
2. Reverse Signal Exit
- No fixed stop-loss or fixed-period exits
- Exits only when a reverse entry signal triggers
- Maximizes trend profits, reduces premature exits
3. ATR Dynamic Pyramiding
- Adds positions when price moves 0.5 ATR in favorable direction
- Supports up to 2 units maximum (adjustable)
- Pyramid scaling to enhance profitability
4. Complete Risk Management
- Fixed position size (5000 USD per unit)
- Commission fee 0.06% (Binance spot rate)
- Initial capital 10,000 USD
---
## 📈 Trading Logic
Entry Conditions
✅ Long Entry:
- Close price breaks above 20-period high
- Structure trend is bullish (price breaks above Swing High)
✅ Short Entry:
- Close price breaks below 20-period low
- Structure trend is bearish (price breaks below Swing Low)
Add Position Conditions
- Long: Price rises ≥ 0.5 ATR
- Short: Price falls ≥ 0.5 ATR
- Maximum 2 units including initial entry
Exit Conditions
- Long Exit: When short entry signal triggers (price breaks 20-period low + structure turns bearish)
- Short Exit: When long entry signal triggers (price breaks 20-period high + structure turns bullish)
---
## ⚙️ Parameter Settings
Channel Settings
- Entry Channel Period: 20 (Donchian Channel breakout period)
- Exit Channel Period: 10 (reserved parameter, actually uses reverse signal exit)
ATR Settings
- ATR Period: 20
- Stop Loss ATR Multiplier: 2.0 (reserved parameter)
- Add Position ATR Multiplier: 0.5
Structure Filter
- Swing Length: 160 (Swing High/Low calculation period)
- Structure Timeframe: 1 minute (can change to 5/15/60, etc.)
Position Management
- Maximum Units: 2 (including initial entry)
- Capital Per Unit: 5000 USD
---
## 🎨 Visualization Features
Background Colors
- Light Green: Bullish structure
- Light Red: Bearish structure
- Dark Green: Long entry
- Dark Red: Short entry
Optional Display (Default: OFF)
- Entry/exit channel lines
- Structure high/low lines
- ATR stop-loss line
- Next add position indicator
- Entry/exit labels
---
## 📱 Alert Message Format
Strategy sends notifications on entry/exit with the following format:
- Entry: `1m Long EP:428.26`
- Add Position: `15m Add Long 2/2 EP:429.50`
- Exit: `1m Close Long Reverse Signal`
Where:
- `1m`/`15m` = Current chart timeframe
- `EP` = Entry Price
---
## 💰 Backtest Settings
Capital Allocation
- Initial Capital: 10,000 USD
- Per Entry: 5,000 USD (split into 2 entries)
- Leverage: 0x (spot trading)
Trading Costs
- Commission: 0.06% (Binance spot VIP0)
- Slippage: 0
---
## 🎯 Use Cases
✅ Best Scenarios
- Trending markets
- Moderate volatility assets
- 1-minute to 4-hour timeframes
⚠️ Not Suitable For
- Highly volatile choppy markets
- Low liquidity small-cap coins
- Extreme market conditions (black swan events)
---
## 📊 Usage Recommendations
Timeframe Suggestions
| Timeframe | Trading Style | Suggested Parameter Adjustment |
|-----------|--------------|-------------------------------|
| 1-5 min | Scalping | Swing Length 100-160 |
| 15-30 min | Short-term | Swing Length 50-100 |
| 1-4 hour | Swing Trading | Swing Length 20-50 |
Optimization Tips
1. Adjust swing length based on backtest results
2. Different coins may require different parameters
3. Recommend backtesting on 1-minute chart first before live trading
4. Enable labels to observe entry/exit points
---
## ⚠️ Risk Disclaimer
1. Past Performance Does Not Guarantee Future Results
- Backtest data is for reference only
- Live trading may be affected by slippage, delays, etc.
2. Market Condition Changes
- Strategy performs better in trending markets
- May experience frequent stops in ranging markets
3. Capital Management
- Do not invest more than you can afford to lose
- Recommend setting total capital stop-loss threshold
4. Commission Impact
- Frequent trading accumulates commission fees
- Recommend using exchange discounts (BNB fee reduction, etc.)
---
## 🔧 Troubleshooting
Q: No entry signals?
A: Check if structure filter is too strict, adjust swing length or timeframe
Q: Too many labels displayed?
A: Turn off "Show Labels" option in settings
Q: Poor backtest performance?
A:
1. Check if the coin is suitable for trend-following strategies
2. Adjust parameters (swing length, channel period)
3. Try different timeframes
Q: How to set alerts?
A:
1. Click "Alert" in top-right corner of chart
2. Condition: Select "Strategy - Trend Following CRYPTOCAP:ZEC "
3. Choose "Order filled"
4. Set notification method (Webhook/Email/App)
---
## 📞 Contact Information
Strategy Name: Trend Following CRYPTOCAP:ZEC
Version: v1.0
Pine Script Version: v6
Last Updated: December 2025
---
## 📄 Copyright Notice
This strategy is for educational and research purposes only.
All risks of using this strategy for live trading are borne by the user.
Commercial use without authorization is prohibited.
---
## 🎓 Learning Resources
To understand the strategy principles in depth, recommended reading:
- "The Complete TurtleTrader" - Curtis Faith
- "Trend Following" - Michael Covel
- TradingView Pine Script Official Documentation
---
Happy Trading! Remember to manage your risk 📈
