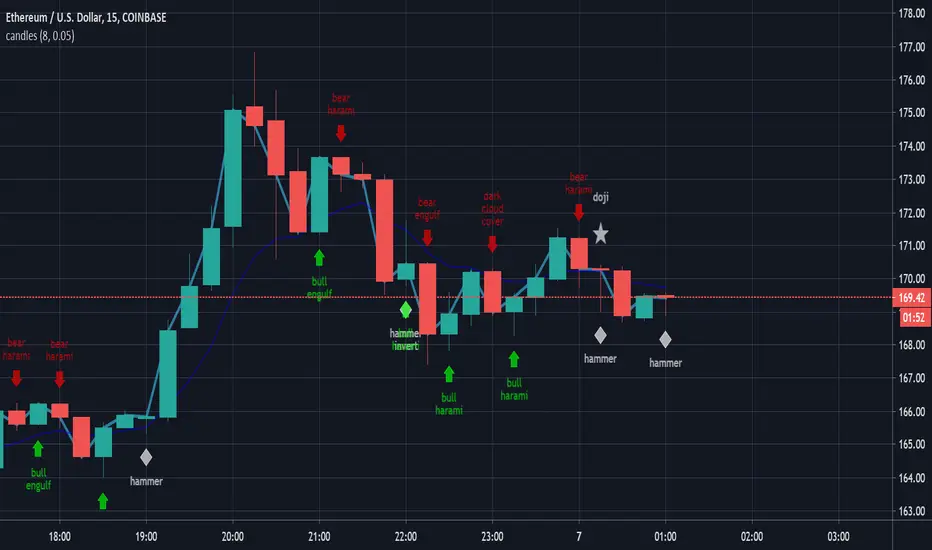
Bullish and Bearish by NicolErazoFThis indicator changes the color of the candlesticks when there’s a change in the trend to the rising or falling trend.
BEARISH ENGULFING: Yellow candlestick. It is an engulfing falling trend reversal; you must make a sell decision.
BEARISH HARAMI: White candlestick. Indicates a possible falling trend change, you must be alert for a possible sale.
BULLISH ENGULFING: Black candlestick. It is a change in the engulfing rising trend, you must make a purchase decision.
BULLISH HARAMI: Blue candlestick. Indicates a possible rising trend change, you should be alert for a possible purchase.
On the chart, you can see the 4 candles, on September 11 the black candle appears indicating a change in the uptrend. But today, the white candle is seen, which appears on September 8, indicating a rebound with a possible change in trend to bearish.
Previous days, on August 26, you see the blue candle with a possible change in the upward trend, which then, on August 28, a yellow candle appears with a change in the downward trend.
The Engulfing indicator (yellow and black) says that the candle has an engulfing change that is radical.
On the other hand, the Harami (blue and white) indicates a possible change in trend that must be previously analyzed.
Harami candles are smaller than Engulfing candles, since Harami in a Japanese term that means pregnancy, where the previous candle is the woman and the next candle is the baby.
___________________________________________________________________________
ESPAÑOL
Este indicador cambia las velas de color cuando ocurre un cambio de tendencia ALCISTA o BAJISTA
BEARISH ENGULFING: Vela de color amarillo. Es una cambio de tendencia bajista envolvente, debes tomar una decisión de venta.
BEARISH HARAMI: Vela de color blanco. Indica un posible cambio de tendencia bajista, debes estar alerta para una posible venta.
BULLISH ENGULFING: Vela de color negro. Es un cambio de tendencia alcista envolvente, debes tomar una decisión de compra.
BULLISH HARAMI: Vela de color azul. Indica un posible cambio de tendencia alcista, debes estar alerta para una posible compra.
En el gráfico, se pueden ver las 4 velas, el 11 de Septiembre aparece la vela negra que indica un cambio de tendencia alcista. Pero hoy, se ve la vela blanca, que aparece el 8 de septiembre, indicando un rebote con un posible cambio de tendencia a bajista.
Días anteriores, el 26 de Agosto, se ve la vela azul con un posible cambio de tendencia alcista, que luego, el 28 de agosto aparece una vela amarilla con cambio de tendencia bajista.
El indicador Engulfing (amarillo y negro) dice que la vela tiene un cambio envolvente que es radical.
En cambio, el Harami (azul y blanco) indica un posible cambio de tendencia que debe ser previamente analizado.
Las velas Harami son más pequeñas que las Engulfing , ya que Harami en un término japonés que significa embarazo, en donde la vela anterior es la mujer y la vela siguiente es el bebé.
Recherche dans les scripts pour "美国11月非农数据"

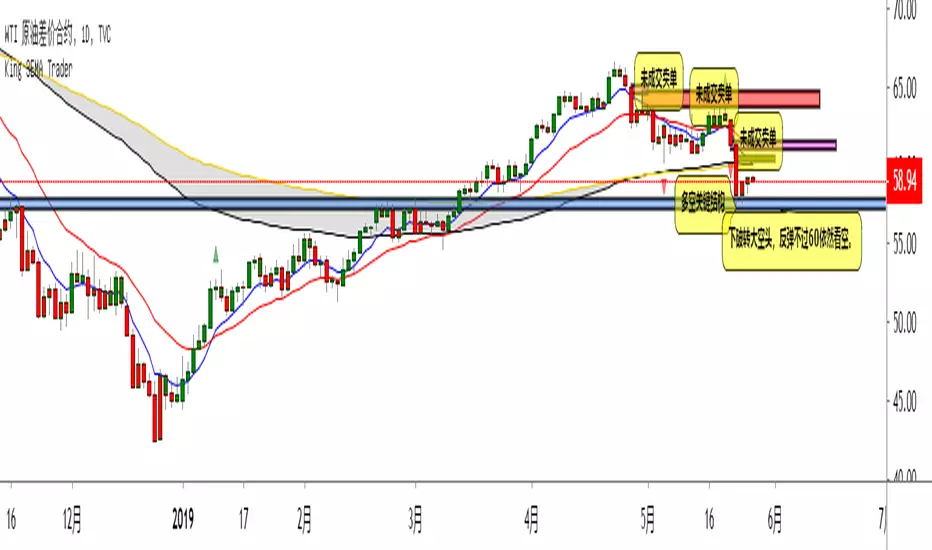
KingEMA21-55ZoneI used the moving average with the habit of 21-55, so added two moving average
When the price runs above 55, it only looks for the buy signal.
When the price runs below 55, it only looks for sell signals.
The first step up through the 55 moving average after the first confirmation can buy homeoply,
The first pull down after crossing the 55 moving average for the first time confirms that it can be sold in line with the trend.
Price horizontal finishing, moving average frequently across the field observation.
The yellow area in the interval from 81to 55 is the homeopathic warehouse addition signal.
When the price is above the 55 moving average, the k-line closes below the 21-day moving average as a callback signal
Prices below the 55 ema close above the 21 - day ema as a rebound signal
After the correction and rebound signals come out, we should make half of the profit and the other half of the stop loss in the break-even place.
Moving average is very suitable for the trend of strong varieties, is not suitable for volatile market.
Only at the end of the shock market moving average upward or downward divergent when it is possible to be used.
1. Repeatedly entangle the mean line of horizontal disk stage and observe it from the field
2. Sell the three EMA moving averages when they can't exceed 89EMA with downward crossing
3, many times can not break the new low when prices go sideways profit
4. Buy when the price reaches 89EMA after the convergence of triangle 3 is broken
5, the Angle of price rise slowed and closed below the 21 moving average when profit
6. Left field observation during transverse oscillation.
Sit tight while news or data cause prices to fall quickly
8. Buy when the price triangle breaks through the 55 moving average upward
9, the price does not rise to slow down when the horizontal closed below the 21 moving average when profit
10, price horizontal shock finishing at the same time the average line also transverse finishing field observation
11, the price of the triangle after finishing through the 89 moving average to buy.At this point all the averages have turned up
12, the second time can not break through the new high when the negative line can profit
13, the price of the first time in the same period of time through 89 after the first step back can be re-bought.
中文翻译
价格在55上面运行时时只找买入信号、
价格在55下面运行时只寻找卖出信号、
第一次向上穿过55均线后的第一次回踩确认可以顺势买入、
第一次向下穿过55均线后的第一次回抽确认可以顺势卖出、
价格横盘整理,均线频繁穿越时离场观察。
21-55区间里面黄色区域为顺势加仓信号,
价格在55均线上面时K线收盘在21天均线下面时为回调信号
价格在55均线下面时K线收盘在21天均线上面时为反弹信号
在回调和反弹信号出来之后我们应该获利一半的头寸,另外一半止损放到盈亏平衡的地方。
均线非常适合趋势性很强的品种,并不适合震荡行情。
只有在震荡行情结束时均线向上或向下发散时才有被运用的可能。
1、横盘阶段均线反复纠缠,离场观察
2、三条EMA均线向下交叉回抽无法超越55EMA时卖出
3、多次不能破新低时价格走横时获利
4、价格在3处三角形收敛被突破后站上了55EMA时买入
5、价格上涨角度变缓并收盘在21均线下面时获利
6、横盘震荡时离场观察。
7、见死不救新闻或数据导致价格快速下跌时观望
8、价格三角形向上突破时穿过55均线时买入
9、价格不升减速走横时收盘于21均线下面时获利
10、价格横盘震荡整理同时均线也横向整理时离场观察
11、价格突破三角形整理后重新穿过89均线时买入。此时所有均线已经向上翘头
12、第二次不能突破新高时收阴线可以获利
13、价格在同一个时间周期内第一次穿过89以后的第一次回踩可以重新买入
14、21-55作为牛熊的分水岭。在21-55区域之下只考虑做空,21-55之上只考虑做多。如果21-55走横则以位置决定高位倾向空低位倾向多。
15、K线会因为指标的设置自动变成两个颜色块,绿色看涨,红色看跌。做趋势看K线颜色。牛市的红色可以当成入场K熊市绿色当成入场K

KingEMA21-55-89-144I used the moving average with the habit of 21-55, so added two moving average, one is the short line 8EMA, the other is the medium and long line 89ema
Explain the application of moving averages through the disk surface:
When the price runs above 89, it only looks for the buy signal.
When the price runs below 89, it only looks for sell signals.
The first step up through the 89 moving average after the first confirmation can buy homeoply,
The first pull down after crossing the 89 moving average for the first time confirms that it can be sold in line with the trend.
Price horizontal finishing, moving average frequently across the field observation.
The yellow area in the interval from 8 to 21 is the homeopathic warehouse addition signal.
When the price is above the 89 moving average, the k-line closes below the 21-day moving average as a callback signal
Prices below the 89 ema close above the 21 - day ema as a rebound signal
After the correction and rebound signals come out, we should make half of the profit and the other half of the stop loss in the break-even place.
Moving average is very suitable for the trend of strong varieties, is not suitable for volatile market.
Only at the end of the shock market moving average upward or downward divergent when it is possible to be used.
1. Repeatedly entangle the mean line of horizontal disk stage and observe it from the field
2. Sell the three EMA moving averages when they can't exceed 89EMA with downward crossing
3, many times can not break the new low when prices go sideways profit
4. Buy when the price reaches 89EMA after the convergence of triangle 3 is broken
5, the Angle of price rise slowed and closed below the 21 moving average when profit
6. Left field observation during transverse oscillation.
Sit tight while news or data cause prices to fall quickly
8. Buy when the price triangle breaks through the 89 moving average upward
9, the price does not rise to slow down when the horizontal closed below the 21 moving average when profit
10, price horizontal shock finishing at the same time the average line also transverse finishing field observation
11, the price of the triangle after finishing through the 89 moving average to buy.At this point all the averages have turned up
12, the second time can not break through the new high when the negative line can profit
13, the price of the first time in the same period of time through 89 after the first step back can be re-bought.
中文翻译
价格在89上面运行时时只找买入信号、
价格在89下面运行时只寻找卖出信号、
第一次向上穿过89均线后的第一次回踩确认可以顺势买入、
第一次向下穿过89均线后的第一次回抽确认可以顺势卖出、
价格横盘整理,均线频繁穿越时离场观察。
8-21区间里面黄色区域为顺势加仓信号,
价格在89均线上面时K线收盘在21天均线下面时为回调信号
价格在89均线下面时K线收盘在21天均线上面时为反弹信号
在回调和反弹信号出来之后我们应该获利一半的头寸,另外一半止损放到盈亏平衡的地方。
均线非常适合趋势性很强的品种,并不适合震荡行情。
只有在震荡行情结束时均线向上或向下发散时才有被运用的可能。
1、横盘阶段均线反复纠缠,离场观察
2、三条EMA均线向下交叉回抽无法超越89EMA时卖出
3、多次不能破新低时价格走横时获利
4、价格在3处三角形收敛被突破后站上了89EMA时买入
5、价格上涨角度变缓并收盘在21均线下面时获利
6、横盘震荡时离场观察。
7、见死不救新闻或数据导致价格快速下跌时观望
8、价格三角形向上突破时穿过89均线时买入
9、价格不升减速走横时收盘于21均线下面时获利
10、价格横盘震荡整理同时均线也横向整理时离场观察
11、价格突破三角形整理后重新穿过89均线时买入。此时所有均线已经向上翘头
12、第二次不能突破新高时收阴线可以获利
13、价格在同一个时间周期内第一次穿过89以后的第一次回踩可以重新买入
14、21-55作为牛熊的分水岭。在21-55区域之下只考虑做空,21-55之上只考虑做多。如果21-55走横则以位置决定高位倾向空低位倾向多。
15、K线会因为指标的设置自动变成两个颜色块,绿色看涨,红色看跌。做趋势看K线颜色。牛市的红色可以当成入场K熊市绿色当成入场K

KingEMA8-21-55-89I used the moving average with the habit of 21-55, so added two moving average, one is the short line 8EMA, the other is the medium and long line 89ema
Explain the application of moving averages through the disk surface:
When the price runs above 89, it only looks for the buy signal.
When the price runs below 89, it only looks for sell signals.
The first step up through the 89 moving average after the first confirmation can buy homeoply,
The first pull down after crossing the 89 moving average for the first time confirms that it can be sold in line with the trend.
Price horizontal finishing, moving average frequently across the field observation.
The yellow area in the interval from 8 to 21 is the homeopathic warehouse addition signal.
When the price is above the 89 moving average, the k-line closes below the 21-day moving average as a callback signal
Prices below the 89 ema close above the 21 - day ema as a rebound signal
After the correction and rebound signals come out, we should make half of the profit and the other half of the stop loss in the break-even place.
Moving average is very suitable for the trend of strong varieties, is not suitable for volatile market.
Only at the end of the shock market moving average upward or downward divergent when it is possible to be used.
1. Repeatedly entangle the mean line of horizontal disk stage and observe it from the field
2. Sell the three EMA moving averages when they can't exceed 89EMA with downward crossing
3, many times can not break the new low when prices go sideways profit
4. Buy when the price reaches 89EMA after the convergence of triangle 3 is broken
5, the Angle of price rise slowed and closed below the 21 moving average when profit
6. Left field observation during transverse oscillation.
Sit tight while news or data cause prices to fall quickly
8. Buy when the price triangle breaks through the 89 moving average upward
9, the price does not rise to slow down when the horizontal closed below the 21 moving average when profit
10, price horizontal shock finishing at the same time the average line also transverse finishing field observation
11, the price of the triangle after finishing through the 89 moving average to buy.At this point all the averages have turned up
12, the second time can not break through the new high when the negative line can profit
13, the price of the first time in the same period of time through 89 after the first step back can be re-bought.
中文翻译
价格在89上面运行时时只找买入信号、
价格在89下面运行时只寻找卖出信号、
第一次向上穿过89均线后的第一次回踩确认可以顺势买入、
第一次向下穿过89均线后的第一次回抽确认可以顺势卖出、
价格横盘整理,均线频繁穿越时离场观察。
8-21区间里面黄色区域为顺势加仓信号,
价格在89均线上面时K线收盘在21天均线下面时为回调信号
价格在89均线下面时K线收盘在21天均线上面时为反弹信号
在回调和反弹信号出来之后我们应该获利一半的头寸,另外一半止损放到盈亏平衡的地方。
均线非常适合趋势性很强的品种,并不适合震荡行情。
只有在震荡行情结束时均线向上或向下发散时才有被运用的可能。
1、横盘阶段均线反复纠缠,离场观察
2、三条EMA均线向下交叉回抽无法超越89EMA时卖出
3、多次不能破新低时价格走横时获利
4、价格在3处三角形收敛被突破后站上了89EMA时买入
5、价格上涨角度变缓并收盘在21均线下面时获利
6、横盘震荡时离场观察。
7、见死不救新闻或数据导致价格快速下跌时观望
8、价格三角形向上突破时穿过89均线时买入
9、价格不升减速走横时收盘于21均线下面时获利
10、价格横盘震荡整理同时均线也横向整理时离场观察
11、价格突破三角形整理后重新穿过89均线时买入。此时所有均线已经向上翘头
12、第二次不能突破新高时收阴线可以获利
13、价格在同一个时间周期内第一次穿过89以后的第一次回踩可以重新买入
14、21-55作为牛熊的分水岭。在21-55区域之下只考虑做空,21-55之上只考虑做多。如果21-55走横则以位置决定高位倾向空低位倾向多。
15、K线会因为指标的设置自动变成两个颜色块,绿色看涨,红色看跌。做趋势看K线颜色。牛市的红色可以当成入场K熊市绿色当成入场K

Bernoulli Process - Binary Entropy FunctionThis indicator is the Bernoulli Process or Wikipedia - Binary Entropy Function . Within Information Theory, Entropy is the measure of available information, here we use a binary variable 0 or 1 (P) and (1-P) (Bernoulli Function/Distribution), and combined with the Shannon Entropy measurement. As you can see below, it produces some wonderful charts and signals, using price, volume, or both summed together. The chart below shows you a couple of options and some critical details on the indicator. The best part about this is the simplicity, all of this information in a couple of lines of code.
Using the indicator:
The longer the Entropy measurement the more information you are capturing, so the analogy is, the shorter the signal, the less information you have available to utilize. You'll run into your Nyquist frequencies below a length of 5. I've found values between 9 and 22 work well to gather enough measurements. You also have an averaging summation that measures the weight or importance of the information over the summation period. This is also used for highlighting when you have an information signal above the 5% level (2 sigma) and then can be adjusted using the Percent Rank Variable. Finally, you can plot the individual signals (Price or Volume) to get another set of measurements to utilize. As can be seen in the chart below, the volume moves before price (but hopefully you already knew that)
At its core, this is taking the Binary Entropy measurement (using a Bernoulli distribution) for price and volume. I've subtracted the volume from the price so that you can use it like a MACD, also for shorter time frames (7, 9, 11) you can get divergences on the histogram. These divergences are primarily due to the weekly nature of the markets (5 days, 10 days is two weeks,...so 9 is measuring the last day of the past two weeks...so 11 is measuring the current day and the past two weeks).
Here are a couple of other examples, assuming you just love BTC, Stocks, or FOREX. I fashioned up a strategy to show the potential of the indicator.
BTC-Strategy
Stock-Strategy (#loveyouNFLX)
FOREX - (for everyone hopped up on 40X leverage)

Divergence Histogram for Many IndicatorHello Traders,
This script analyses divergences for 11 predefined indicators and then draws column on the graph. Red columns for negatif divergence (means prices may go down or trend reversal), Lime columns for positive divergences (means prices may go up or trend reversal)
The script uses Pivot Points and on each bar it checks divergence between last Pivot Point and current High/Low and if it finds any divergence then immediately draws column. There is no Latency/Lag.
There are predefined 11 indicators in the script, which are RSI , MACD , MACD Histogram, Stochastic , CCI , Momentum, OBV, Diosc, VWMACD, CMF and MFI.
Smaller Pivot Point Period check smaller areas and if you use smaller numbers it would be more sensitive and may give alerts very often. So you should set it accordingly.
There is "Check Cut-Through in indicators" option, I recomment you to enable it. it checks that there is cut-through in indicators or not, if no cut-through then it's shown as valid divergence.
You should see following one as well if you haven't yet:
Enjoy!

candlestick patternsCleaning up and updating vcsWo8mh-Candlestick-Patterns-Identified-updated-3-11-15 .
As I learn more candlestick patterns I'll add them in.
Please post requests and any potential implementations I could port to pine script.
I'm applying autopep8 as best I can for readability.
MAC-Z & MACD Leader signal [ChuckBanger]This is a combination of my MACD Leader script and MAC-Z with option to add Laguerre filter. The advantage of the MAC-Z over MACD is that it is a more accurate and “assumption-free” indicator that can more accurately describe how a market actually perform. But you can use this as a regular MACD indicator.
Crossovers signals
The MAC-Z line and signal line can be utilized in the same way as a stochastic oscillator, with the crossover between the two lines providing buy and sell signals. As with most crossover strategies, a buy signal comes when the shorter-term, more reactive line – in this case the MAC-Z line (blue line) crosses above the slower signal line (orange line). For example, when the MAC-Z line crosses below the signal line it provides a bearish sell signal.
Zero line crossing
The zero cross strategy is based on either of the lines crossing the zero line. If the MAC-Z crosses the zero line from below, it is a signal for a possible new uptrend, while the MAC-Z crossing from above is a signal that a new downtrend may be starting. This is special powerful if the lines has a fast up or down movement but the price action doesn't reflect that movement.
Divergences
Bearish and bullish divergences is my favorite signals. When price action and oscillators follow the same path it is called Convergences, when they don’t, it’s called a Divergence. Don't confuse the two because they have not the same meaning. But be aware that for example during consolidation or low liquidity, some small divergences between price and indicators might form, but that doesn't mean we should consider them as real divergences.
There is many different types of divergences. It is easier to show a picture then explaining it so I recommend you to check out the link below. Especially the top image. It sums this up very well
medium.com
MACD Leader
The MACD leader is only showing the crossing of MACD as a vertical line
Green vertical line = MACD Leader Bullish Cross
Red vertical line = MACD Leader Bearish Cross
MACD Leader:
MAC-Z:
More Information
cssanalytics.wordpress.com
en.wikipedia.org
drive.google.com

Edward EMA 8-21-89-144Explain the application of moving averages through the disk surface:
When the price runs above 89, it only looks for the buy signal.
When the price runs below 89, it only looks for sell signals.
The first step up through the 89 moving average after the first confirmation can buy homeoply,
The first pull down after crossing the 89 moving average for the first time confirms that it can be sold in line with the trend.
Price horizontal finishing, moving average frequently across the field observation.
The yellow area in the interval from 8 to 21 is the homeopathic warehouse addition signal.
When the price is above the 89 moving average, the k-line closes below the 21-day moving average as a callback signal
Prices below the 89 ema close above the 21 - day ema as a rebound signal
After the correction and rebound signals come out, we should make half of the profit and the other half of the stop loss in the break-even place.
Moving average is very suitable for the trend of strong varieties, is not suitable for volatile market.
Only at the end of the shock market moving average upward or downward divergent when it is possible to be used.
1. Repeatedly entangle the mean line of horizontal disk stage and observe it from the field
2. Sell the three EMA moving averages when they can't exceed 89EMA with downward crossing
3, many times can not break the new low when prices go sideways profit
4. Buy when the price reaches 89EMA after the convergence of triangle 3 is broken
5, the Angle of price rise slowed and closed below the 21 moving average when profit
6. Left field observation during transverse oscillation.
Sit tight while news or data cause prices to fall quickly
8. Buy when the price triangle breaks through the 89 moving average upward
9, the price does not rise to slow down when the horizontal closed below the 21 moving average when profit
10, price horizontal shock finishing at the same time the average line also transverse finishing field observation
11, the price of the triangle after finishing through the 89 moving average to buy.At this point all the averages have turned up
12, the second time can not break through the new high when the negative line can profit
13, the price of the first time in the same period of time through 89 after the first step back can be re-bought.
通过盘面讲解均线运用:
价格在89上面运行时时只找买入信号、
价格在89下面运行时只寻找卖出信号、
第一次向上穿过89均线后的第一次回踩确认可以顺势买入、
第一次向下穿过89均线后的第一次回抽确认可以顺势卖出、
价格横盘整理,均线频繁穿越时离场观察。
8-21区间里面黄色区域为顺势加仓信号,
价格在89均线上面时K线收盘在21天均线下面时为回调信号
价格在89均线下面时K线收盘在21天均线上面时为反弹信号
在回调和反弹信号出来之后我们应该获利一半的头寸,另外一半止损放到盈亏平衡的地方。
均线非常适合趋势性很强的品种,并不适合震荡行情。
只有在震荡行情结束时均线向上或向下发散时才有被运用的可能。
1、横盘阶段均线反复纠缠,离场观察
2、三条EMA均线向下交叉回抽无法超越89EMA时卖出
3、多次不能破新低时价格走横时获利
4、价格在3处三角形收敛被突破后站上了89EMA时买入
5、价格上涨角度变缓并收盘在21均线下面时获利
6、横盘震荡时离场观察。
7、见死不救新闻或数据导致价格快速下跌时观望
8、价格三角形向上突破时穿过89均线时买入
9、价格不升减速走横时收盘于21均线下面时获利
10、价格横盘震荡整理同时均线也横向整理时离场观察
11、价格突破三角形整理后重新穿过89均线时买入。此时所有均线已经向上翘头
12、第二次不能突破新高时收阴线可以获利
13、价格在同一个时间周期内第一次穿过89以后的第一次回踩可以重新买入
14、89-144作为牛熊的分水岭。在89-144区域之下只考虑做空,89-144只考虑做多。如果89-144走横则以位置决定高位倾向空低位倾向多。
15、K线会因为指标的设置自动变成两个颜色块,绿色看涨,红色看跌。做趋势看K线颜色。牛市的红色可以当成入场K熊市绿色当成入场K
Moving Averages & Bollinger Bands with ForecastsMoving Averages & Bollinger Bands with Forecasts
11 Moving Averages
SMA, EMA, WMA
Highly Customizable
Linear Regression Forecast
Bollonger Bands
Personal Setup: Add indicator twice
1st indicator = SMA using #4, 7, 10, 11 (20, 50, 100, 200 SMAs) with bollonger bands on 20.
2nd indicator = EMA using #1, 2, 3, 5, 6, 8, 9 (5, 8, 13, 21 ,34, 55, 89 EMAs).
This allows easy toggling between SMAs/Bolls and Fib EMAs
Thank you to yatrader2 for the forecast code

[astropark] MACD, RSI+, AO, DMI, ADX, OBV, ADI//******************************************************************************
// Copyright by astropark v4.1.0
// MACD, RSI+, Awesome Oscillator, DMI, ADX, OBV, ADI
// 24/10/2018 Added RSI with Center line to have clear glue of current trend
// 10/12/2018 Added MACD
// 13/12/2018 Added multiplier for MACD in order to make it clearly visible over RSI graph
// 11/01/2019 Added Awesome Ascillator (AO)
// 11/01/2019 Added Directional Movement Index (DMI) with ADX
// 14/01/2019 Added On Balance Volume (OBV)
// 14/01/2019 Added Accelerator Decelerator Indicator (ADI)
//******************************************************************************

[astropark] MACD, RSI+, Awesome Oscillator, DMI, ADX, OBV//******************************************************************************
// Copyright by astropark v4.0.0
// MACD, RSI+, Awesome Oscillator, DMI, ADX, OBV
// 24/10/2018 Added RSI with Center line to have clear glue of current trend
// 10/12/2018 Added MACD
// 13/12/2018 Added multiplier for MACD in order to make it clearly visible over RSI graph
// 11/01/2019 Added Awesome Oscillator (AO)
// 11/01/2019 Added Directional Movement Index (DMI) with ADX
// 14/01/2019 Added On Balance Volume (OBV)
//******************************************************************************

[astropark] MACD, RSI+, Awesome Oscillator, DMI with ADX//******************************************************************************
// Copyright by astropark v3.1.0
// MACD, RSI+, Awesome Oscillator, DMI, ADX
// 24/10/2018 Added RSI with Center line to have clear glue of current trend
// 10/12/2018 Added MACD
// 13/12/2018 Added multiplier for MACD in order to make it clearly visible over RSI graph
// 11/01/2019 Added Awesome Ascillator (AO)
// 11/01/2019 Added Directional Movement Index (DMI) with ADX
//******************************************************************************

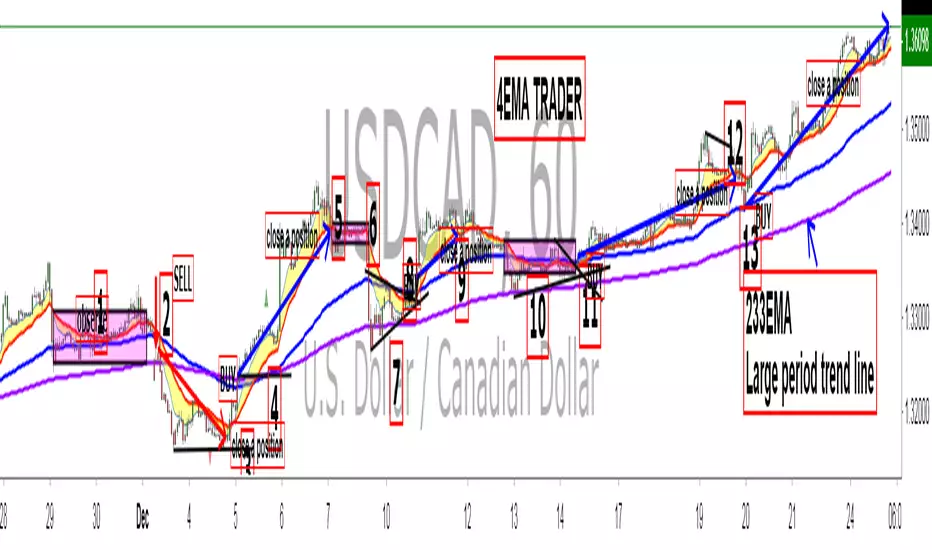
King 4EMA TraderKing 4EMA trader 8/21/89EMA+(233)V3.3
Explain the application of moving averages through the disk surface:
When the price runs above 89, it only looks for the buy signal.
When the price runs below 89, it only looks for sell signals.
The first step up through the 89 moving average after the first confirmation can buy homeoply,
The first pull down after crossing the 89 moving average for the first time confirms that it can be sold in line with the trend.
Price horizontal finishing, moving average frequently across the field observation.
The yellow area in the interval from 8 to 21 is the homeopathic warehouse addition signal.
When the price is above the 89 moving average, the k-line closes below the 21-day moving average as a callback signal
Prices below the 89 ema close above the 21 - day ema as a rebound signal
After the correction and rebound signals come out, we should make half of the profit and the other half of the stop loss in the break-even place.
Moving average is very suitable for the trend of strong varieties, is not suitable for volatile market.
Only at the end of the shock market moving average upward or downward divergent when it is possible to be used.
1. Repeatedly entangle the mean line of horizontal disk stage and observe it from the field
2. Sell the three EMA moving averages when they can't exceed 89EMA with downward crossing
3, many times can not break the new low when prices go sideways profit
4. Buy when the price reaches 89EMA after the convergence of triangle 3 is broken
5, the Angle of price rise slowed and closed below the 21 moving average when profit
6. Left field observation during transverse oscillation.
Sit tight while news or data cause prices to fall quickly
8. Buy when the price triangle breaks through the 89 moving average upward
9, the price does not rise to slow down when the horizontal closed below the 21 moving average when profit
10, price horizontal shock finishing at the same time the average line also transverse finishing field observation
11, the price of the triangle after finishing through the 89 moving average to buy.At this point all the averages have turned up
12, the second time can not break through the new high when the negative line can profit
13, the price of the first time in the same period of time through 89 after the first step back can be re-bought.
通过盘面讲解均线运用:
价格在89上面运行时时只找买入信号、
价格在89下面运行时只寻找卖出信号、
第一次向上穿过89均线后的第一次回踩确认可以顺势买入、
第一次向下穿过89均线后的第一次回抽确认可以顺势卖出、
价格横盘整理,均线频繁穿越时离场观察。
8-21区间里面黄色区域为顺势加仓信号,
价格在89均线上面时K线收盘在21天均线下面时为回调信号
价格在89均线下面时K线收盘在21天均线上面时为反弹信号
在回调和反弹信号出来之后我们应该获利一半的头寸,另外一半止损放到盈亏平衡的地方。
均线非常适合趋势性很强的品种,并不适合震荡行情。
只有在震荡行情结束时均线向上或向下发散时才有被运用的可能。
1、横盘阶段均线反复纠缠,离场观察
2、三条EMA均线向下交叉回抽无法超越89EMA时卖出
3、多次不能破新低时价格走横时获利
4、价格在3处三角形收敛被突破后站上了89EMA时买入
5、价格上涨角度变缓并收盘在21均线下面时获利
6、横盘震荡时离场观察。
7、见死不救新闻或数据导致价格快速下跌时观望
8、价格三角形向上突破时穿过89均线时买入
9、价格不升减速走横时收盘于21均线下面时获利
10、价格横盘震荡整理同时均线也横向整理时离场观察
11、价格突破三角形整理后重新穿过89均线时买入。此时所有均线已经向上翘头
12、第二次不能突破新高时收阴线可以获利
13、价格在同一个时间周期内第一次穿过89以后的第一次回踩可以重新买入。
Bitfinex Longs/Shorts Multi-Coin [acatwithcharts]This script plots the longs/shorts ratio derived from Bitfinex for BTCUSDLONGS, BTCUSDSHORTS, and similar for 11 top cryptocurrencies chosen selected based on marketcap, trading volume on Bitfinex, and the maximum number of times that TradingView would let me call the "security" function in one script. Included coins:
BTC, ETH, LTC, BCH, XRP, EOS, IOT (IOTA), ETC, ZEC, NEO, XMR
In addition to just plotting the ratios for the individual coins, this script also calculates for a customizable selection of the 11 coins both the average ratio and a weighted average weighted by (USD price of coin * sum of long and short positions).
I wrote it both to use both for a big picture overview of leveraged positions across major coins and to use as a Swiss army knife of longs/shorts ratio indicators for individual coins, most of which do not currently have individual scripts published.
I'm an amateur and you definitely shouldn't take anything I say or use any of my scripts as financial advice. I'd appreciate any feedback.

Stochastic Momentum IndexStochastic Momentum Index indicator script. This indicator was originally developed by William Blau (Stocks & Commodities V. 11:1 (11-18)).

🟡 GOLD 4H HUD v12 — Time-Safe Nuclear Edition🟡 GOLD 4H HUD v12 — Time-Safe Nuclear Edition
A full–scale Smart Money Concepts (SMC) analytics engine designed exclusively for XAUUSD on the 4-Hour timeframe.
This script combines market structure, liquidity, displacement, order blocks, imbalance, volume profile, SMT divergence, and institutional behavior modeling into a single unified HUD.
Built with a time-safe architecture, all structural elements (OB/FVG/Sweep) are stored by timestamp to minimize repainting and preserve event integrity.
📌 Core Features (12 Modules + Full HUD)
1 — Market Structure Engine
Automatically detects:
HH / HL / LH / LL
BOS (Break of Structure)
MSS (Market Structure Shift)
CHOCH (Change of Character)
Real swing pivots & trend state
2 — Sweep Engine (Liquidity Grab Detection)
Identifies institutional liquidity grabs:
Break + reclaim of highs/lows
ATR-filtered invalidation
Displacement-backed sweeps
3 — Time-Safe FVG Engine
Detects Bullish/Bearish Fair Value Gaps
ATR-tolerant FVG logic
Automatic right-extension
Auto-delete when filled or invalid
4 — Time-Safe Order Block Engine
Demand & Supply OB detection
Strength classification (Weak vs Strong)
FVG-overlap confirmation
Timestamp-locked (non-repainting)
5 — Volume Profile Engine (HVN / LVN / POC)
Real-time micro-profile:
High Volume Node (HVN)
Low Volume Node (LVN)
Point of Control (POC)
6 — SMT Engine (Gold vs DXY Divergence)
Smart Money Divergence built-in:
Bullish SMT
Bearish SMT
Directional confirmation with zero lag
7 — Displacement Engine
Measures institutional impulse:
Body-based impulse detection
Multi-leg continuation signals
FVG continuation moves
Generates displacement score
8 — Premium / Discount Model
Auto-classifies price into:
Discount (Buy zone)
Premium (Sell zone)
9 — SMC Trend Engine (Score-Based)
Combines 10+ factors:
Structure
FVG
OB power
Displacement
POC positioning
SMT conditions
Outputs:
BULL / BEAR / RANGE
Full scoring system
10 — Institutional Imbalance Model (IMB Engine)
Combines:
PD zones
Sweep direction
Displacement
SMT
OB strength
CHOCH/MSS
A complete institutional bias filter.
11 — Entry Engine (Signal Fusion Model)
Entry conditions fuse:
Sweep
CHOCH
Displacement
OB strength
FVG alignment
SMT confirmation
Also outputs:
Suggested SL/TP
Entry score
12 — Trendline Engine
Auto-draws:
HL → HL bullish trendlines
LH → LH bearish trendlines
+ Full Nuclear HUD
Displays:
Market structure
Trend direction
SMT / CHOCH / MSS
FVG / OB zones
HVN / LVN / POC
Liquidity strength
Entry model
Liquidity Magnet direction
SL/TP map
A complete institutional dashboard in one place.
⚠ Usage Requirement
This script is designed ONLY for the 4H timeframe.
✨ Summary
GOLD 4H HUD v12 — Time-Safe Nuclear Edition
is not just an indicator.
It is a full institutional-grade SMC analysis system, built specifically for Gold.
If you trade XAUUSD on the 4H timeframe —
this is your complete market intelligence HUD

VV Moving Average Convergence Divergence # VMACDv3 - Volume-Weighted MACD with A/D Divergence Detection
## Overview
**VMACDv3** (Volume-Weighted Moving Average Convergence Divergence Version 3) is a momentum indicator that applies volume-weighting to traditional MACD calculations on price, while using the Accumulation/Distribution (A/D) line for divergence detection. This hybrid approach combines volume-weighted price momentum with volume distribution analysis for comprehensive market insight.
## Key Features
- **Volume-Weighted Price MACD**: Traditional MACD calculation on price but weighted by volume for earlier signals
- **A/D Divergence Detection**: Identifies when A/D trend diverges from MACD momentum
- **Volume Strength Filtering**: Distinguishes high-volume confirmations from low-volume noise
- **Color-Coded Histogram**: 4-color system showing momentum direction and volume strength
- **Real-Time Alerts**: Background colors and alert conditions for bullish/bearish divergences
## Difference from ACCDv3
| Aspect | VMACDv3 | ACCDv3 |
|--------|---------|---------|
| **MACD Input** | **Price (Close)** | **A/D Line** |
| **Volume Weighting** | Applied to price | Applied to A/D line |
| **Primary Signal** | Volume-weighted price momentum | Volume distribution momentum |
| **Use Case** | Price momentum with volume confirmation | Volume flow and accumulation/distribution |
| **Sensitivity** | More responsive to price changes | More responsive to volume patterns |
| **Best For** | Trend following, breakouts | Volume analysis, smart money tracking |
**Key Insight**: VMACDv3 shows *where price is going* with volume weight, while ACCDv3 shows *where volume is accumulating/distributing*.
## Components
### 1. Volume-Weighted MACD on Price
Unlike standard MACD that uses simple price EMAs, VMACDv3 weights each price by its corresponding volume:
```
Fast Line = EMA(Price × Volume, 12) / EMA(Volume, 12)
Slow Line = EMA(Price × Volume, 26) / EMA(Volume, 26)
MACD = Fast Line - Slow Line
```
**Benefits of Volume Weighting**:
- High-volume price movements have greater impact
- Filters out low-volume noise and false moves
- Provides earlier trend change signals
- Better reflects institutional activity
### 2. Accumulation/Distribution (A/D) Line
Used for divergence detection, measuring buying/selling pressure:
```
A/D = Σ ((2 × Close - Low - High) / (High - Low)) × Volume
```
- **Rising A/D**: Accumulation (buying pressure)
- **Falling A/D**: Distribution (selling pressure)
- **Doji Handling**: When High = Low, contribution is zero
### 3. Signal Lines
- **MACD Line** (Blue, #2962FF): The fast-slow difference showing momentum
- **Signal Line** (Orange, #FF6D00): EMA or SMA smoothing of MACD
- **Zero Line**: Reference for bullish (above) vs bearish (below) bias
### 4. Histogram Color System
The histogram uses 4 distinct colors based on **direction** and **volume strength**:
| Condition | Color | Meaning |
|-----------|-------|---------|
| Rising + High Volume | **Dark Green** (#1B5E20) | Strong bullish momentum with volume confirmation |
| Rising + Low Volume | **Light Teal** (#26A69A) | Bullish momentum but weak volume (less reliable) |
| Falling + High Volume | **Dark Red** (#B71C1C) | Strong bearish momentum with volume confirmation |
| Falling + Low Volume | **Light Pink** (#FFCDD2) | Bearish momentum but weak volume (less reliable) |
Additional shading:
- **Light Cyan** (#B2DFDB): Positive but not rising (momentum stalling)
- **Bright Red** (#FF5252): Negative and accelerating down
### 5. Divergence Detection
VMACDv3 compares A/D trend against volume-weighted price MACD:
#### Bullish Divergence (Green Background)
- **Condition**: A/D is trending up BUT MACD is negative and trending down
- **Interpretation**: Volume is accumulating while price momentum appears weak
- **Signal**: Smart money accumulation, potential bullish reversal
- **Action**: Look for long entries, especially at support levels
#### Bearish Divergence (Red Background)
- **Condition**: A/D is trending down BUT MACD is positive and trending up
- **Interpretation**: Volume is distributing while price momentum appears strong
- **Signal**: Smart money distribution, potential bearish reversal
- **Action**: Consider exits, avoid new longs, watch for breakdown
## Parameters
| Parameter | Default | Range | Description |
|-----------|---------|-------|-------------|
| **Source** | Close | OHLC/HLC3/etc | Price source for MACD calculation |
| **Fast Length** | 12 | 1-50 | Period for fast EMA (shorter = more sensitive) |
| **Slow Length** | 26 | 1-100 | Period for slow EMA (longer = smoother) |
| **Signal Smoothing** | 9 | 1-50 | Period for signal line (MACD smoothing) |
| **Signal Line MA Type** | EMA | SMA/EMA | Moving average type for signal calculation |
| **Volume MA Length** | 20 | 5-100 | Period for volume average (strength filter) |
## Usage Guide
### Reading the Indicator
1. **MACD Lines (Blue & Orange)**
- **Blue Line (MACD)**: Volume-weighted price momentum
- **Orange Line (Signal)**: Smoothed trend of MACD
- **Crossovers**: Blue crosses above orange = bullish, below = bearish
- **Distance**: Wider gap = stronger momentum
- **Zero Line Position**: Above = bullish bias, below = bearish bias
2. **Histogram Colors**
- **Dark Green (#1B5E20)**: Strong bullish move with high volume - **most reliable buy signal**
- **Light Teal (#26A69A)**: Bullish but low volume - wait for confirmation
- **Dark Red (#B71C1C)**: Strong bearish move with high volume - **most reliable sell signal**
- **Light Pink (#FFCDD2)**: Bearish but low volume - may be temporary dip
3. **Background Divergence Alerts**
- **Green Background**: A/D accumulating while price weak - potential bottom
- **Red Background**: A/D distributing while price strong - potential top
- Most powerful at key support/resistance levels
### Trading Strategies
#### Strategy 1: Volume-Confirmed Trend Following
1. Wait for MACD to cross above zero line
2. Look for **dark green** histogram bars (high volume confirmation)
3. Enter long on second consecutive dark green bar
4. Hold while histogram remains green
5. Exit when histogram turns light green or red appears
6. Set stop below recent swing low
**Example**:
```
Price: 26,400 → 26,450 (rising)
MACD: -50 → +20 (crosses zero)
Histogram: Light teal → Dark green → Dark green
Volume: 50k → 75k → 90k (increasing)
```
#### Strategy 2: Divergence Reversal Trading
1. Identify divergence background (green = bullish, red = bearish)
2. Confirm with price structure (support/resistance, chart patterns)
3. Wait for MACD to cross signal line in divergence direction
4. Enter on first **dark colored** histogram bar after divergence
5. Set stop beyond divergence area
6. Target previous swing high/low
**Example - Bullish Divergence**:
```
Price: Making lower lows (26,350 → 26,300 → 26,250)
A/D: Rising (accumulation)
MACD: Below zero but starting to curve up
Background: Green shading appears
Entry: MACD crosses signal line + dark green bar
Stop: Below 26,230
Target: 26,450 (previous high)
```
#### Strategy 3: Momentum Scalping
1. Trade only in direction of MACD zero line (above = long, below = short)
2. Enter on dark colored bars only
3. Exit on first light colored bar or opposite color
4. Quick in and out (1-5 minute holds)
5. Tight stops (0.2-0.5% depending on instrument)
#### Strategy 4: Histogram Pattern Trading
**V-Bottom Reversal (Bullish)**:
- Red histogram bars start rising (becoming less negative)
- Forms "V" shape at the bottom
- Transitions to light red → light teal → **dark green**
- Entry: First dark green bar
- Signal: Momentum reversal with volume
**Λ-Top Reversal (Bearish)**:
- Green histogram bars start falling (becoming less positive)
- Forms inverted "V" at the top
- Transitions to light green → light pink → **dark red**
- Entry: First dark red bar
- Signal: Momentum exhaustion with volume
### Multi-Timeframe Analysis
**Recommended Approach**:
1. **Higher Timeframe (15m/1h)**: Identify overall trend direction
2. **Trading Timeframe (5m)**: Time entries using VMACDv3 signals
3. **Lower Timeframe (1m)**: Fine-tune entry prices
**Example Setup**:
```
15-minute: MACD above zero (bullish bias)
5-minute: Dark green histogram appears after pullback
1-minute: Enter on break of recent high with volume
```
### Volume Strength Interpretation
The volume filter compares current volume to 20-period average:
- **Volume > Average**: Dark colors (green/red) - high confidence signals
- **Volume < Average**: Light colors (teal/pink) - lower confidence signals
**Trading Rules**:
- ✓ **Aggressive**: Take all dark colored signals
- ✓ **Conservative**: Only take dark colors that follow 2+ light colors of same type
- ✗ **Avoid**: Trading light colored signals during high volatility
- ✗ **Avoid**: Ignoring volume context during news events
## Technical Details
### Volume-Weighted Calculation
```pine
// Volume-weighted fast EMA
fast_ma = ta.ema(src * volume, fast_length) / ta.ema(volume, fast_length)
// Volume-weighted slow EMA
slow_ma = ta.ema(src * volume, slow_length) / ta.ema(volume, slow_length)
// MACD is the difference
macd = fast_ma - slow_ma
// Signal line smoothing
signal = ta.ema(macd, signal_length) // or ta.sma() if SMA selected
// Histogram
hist = macd - signal
```
### Divergence Detection Logic
```pine
// A/D trending up if above its 5-period SMA
ad_trend = ad > ta.sma(ad, 5)
// MACD trending up if above zero
macd_trend = macd > 0
// Divergence when trends oppose each other
divergence = ad_trend != macd_trend
// Specific conditions for alerts
bullish_divergence = ad_trend and not macd_trend and macd < 0
bearish_divergence = not ad_trend and macd_trend and macd > 0
```
### Histogram Coloring Logic
```pine
hist_color = (hist >= 0
? (hist < hist
? (vol_strength ? #1B5E20 : #26A69A) // Rising: dark/light green
: #B2DFDB) // Positive but falling: cyan
: (hist < hist
? (vol_strength ? #B71C1C : #FFCDD2) // Rising (less negative): dark/light red
: #FF5252)) // Falling more: bright red
```
## Alerts
Built-in alert conditions for divergence detection:
### Bullish Divergence Alert
- **Trigger**: A/D trending up, MACD negative and trending down
- **Message**: "Bullish Divergence: A/D trending up but MACD trending down"
- **Use Case**: Potential reversal or continuation after pullback
- **Action**: Look for long entry setups
### Bearish Divergence Alert
- **Trigger**: A/D trending down, MACD positive and trending up
- **Message**: "Bearish Divergence: A/D trending down but MACD trending up"
- **Use Case**: Potential top or trend reversal
- **Action**: Consider exits or short entries
### Setting Up Alerts
1. Click "Create Alert" in TradingView
2. Condition: Select "VMACDv3"
3. Choose alert type: "Bullish Divergence" or "Bearish Divergence"
4. Configure: Email, SMS, webhook, or popup
5. Set frequency: "Once Per Bar Close" recommended
## Comparison Tables
### VMACDv3 vs Standard MACD
| Feature | Standard MACD | VMACDv3 |
|---------|---------------|---------|
| **Price Weighting** | Equal weight all bars | Volume-weighted |
| **Sensitivity** | Fixed | Adaptive to volume |
| **False Signals** | More during low volume | Fewer (volume filter) |
| **Divergence** | Price vs MACD | A/D vs MACD |
| **Volume Analysis** | None | Built-in |
| **Color System** | 2 colors | 4+ colors |
| **Best For** | Simple trend following | Volume-confirmed trading |
### VMACDv3 vs ACCDv3
| Aspect | VMACDv3 | ACCDv3 |
|--------|---------|--------|
| **Focus** | Price momentum | Volume distribution |
| **Reactivity** | Faster to price moves | Faster to volume shifts |
| **Best Markets** | Trending, breakouts | Accumulation/distribution phases |
| **Signal Type** | Where price + volume going | Where smart money positioning |
| **Divergence Meaning** | Volume vs price disagreement | A/D vs momentum disagreement |
| **Use Together?** | ✓ Yes, complementary | ✓ Yes, different perspectives |
## Example Trading Scenarios
### Scenario 1: Strong Bullish Breakout
```
Time: 9:30 AM (market open)
Price: Breaks above 26,400 resistance
MACD: Crosses above zero line
Histogram: Dark green bars (#1B5E20)
Volume: 2x average (150k vs 75k avg)
A/D: Rising (no divergence)
Action: Enter long at 26,405
Stop: 26,380 (below breakout)
Target 1: 26,450 (risk:reward 1:2)
Target 2: 26,500 (risk:reward 1:4)
Result: High probability setup with volume confirmation
```
### Scenario 2: False Breakout (Avoided)
```
Time: 2:30 PM (slow period)
Price: Breaks above 26,400 resistance
MACD: Slightly positive
Histogram: Light teal bars (#26A69A)
Volume: 0.5x average (40k vs 75k avg)
A/D: Flat/declining
Action: Avoid trade
Reason: Low volume, no conviction, potential false breakout
Outcome: Price reverses back below 26,400 within 10 minutes
Saved: Avoided losing trade due to volume filter
```
### Scenario 3: Bullish Divergence Bottom
```
Time: 11:00 AM
Price: Making lower lows (26,350 → 26,300 → 26,280)
MACD: Below zero but curving upward
Histogram: Red bars getting shorter (V-bottom forming)
Background: Green shading (divergence alert)
A/D: Rising despite price falling
Volume: Increasing on down bars
Setup:
1. Divergence appears at 26,280 (green background)
2. Wait for MACD to cross signal line
3. First dark green bar appears at 26,290
4. Enter long: 26,295 (next bar open)
5. Stop: 26,265 (below divergence low)
6. Target: 26,350 (previous swing high)
Result: +55 points (30 point risk, 1.8:1 reward)
Key: Divergence + volume confirmation = high probability reversal
```
### Scenario 4: Bearish Divergence Top
```
Time: 1:45 PM
Price: Making higher highs (26,500 → 26,520 → 26,540)
MACD: Positive but flattening
Histogram: Green bars getting shorter (Λ-top forming)
Background: Red shading (bearish divergence)
A/D: Declining despite rising price
Volume: Decreasing on up bars
Setup:
1. Bearish divergence at 26,540 (red background)
2. MACD crosses below signal line
3. First dark red bar appears at 26,535
4. Enter short: 26,530
5. Stop: 26,555 (above divergence high)
6. Target: 26,475 (support level)
Result: +55 points (25 point risk, 2.2:1 reward)
Key: Distribution while price rising = smart money exiting
```
### Scenario 5: V-Bottom Reversal
```
Downtrend in progress
MACD: Deep below zero (-150)
Histogram: Series of dark red bars
Pattern Development:
Bar 1: Dark red, hist = -80, falling
Bar 2: Dark red, hist = -95, falling
Bar 3: Dark red, hist = -100, falling (extreme)
Bar 4: Light pink, hist = -98, rising!
Bar 5: Light pink, hist = -90, rising
Bar 6: Light teal, hist = -75, rising (crosses to positive momentum)
Bar 7: Dark green, hist = -55, rising + volume
Action: Enter long on Bar 7
Reason: V-bottom confirmed with volume
Stop: Below Bar 3 low
Target: Zero line on histogram (mean reversion)
```
## Best Practices
### Entry Rules
✓ **Wait for dark colors**: High-volume confirmation is key
✓ **Confirm divergences**: Use with price support/resistance
✓ **Trade with zero line**: Long above, short below for best odds
✓ **Multiple timeframes**: Align 1m, 5m, 15m signals
✓ **Watch for patterns**: V-bottoms and Λ-tops are reliable
### Exit Rules
✓ **Partial profits**: Take 50% at first target
✓ **Trail stops**: Use histogram color changes
✓ **Respect signals**: Exit on opposite dark color
✓ **Time stops**: Close positions before major news
✓ **End of day**: Square up before close
### Avoid
✗ **Don't chase light colors**: Low volume = low confidence
✗ **Don't ignore divergence**: Early warning system
✗ **Don't overtrade**: Wait for clear setups
✗ **Don't fight the trend**: Zero line dictates bias
✗ **Don't skip stops**: Always use risk management
## Risk Management
### Position Sizing
- **Dark green/red signals**: 1-2% account risk
- **Light signals**: 0.5% account risk or skip
- **Divergence plays**: 1% account risk (higher uncertainty)
- **Multiple confirmations**: Up to 2% account risk
### Stop Loss Placement
- **Trend trades**: Below/above recent swing (20-30 points typical)
- **Breakout trades**: Below/above breakout level (15-25 points)
- **Divergence trades**: Beyond divergence extreme (25-40 points)
- **Scalp trades**: Tight stops at 10-15 points
### Profit Targets
- **Minimum**: 1.5:1 reward to risk ratio
- **Scalps**: 15-25 points (quick in/out)
- **Swing**: 50-100 points (hold through pullbacks)
- **Runners**: Trail with histogram color changes
## Timeframe Recommendations
| Timeframe | Trading Style | Typical Hold | Advantages | Challenges |
|-----------|---------------|--------------|------------|------------|
| **1-minute** | Scalping | 1-5 minutes | Fast profits, many setups | Noisy, high false signals |
| **5-minute** | Intraday | 15-60 minutes | Balance of speed/clarity | Still requires quick decisions |
| **15-minute** | Swing | 1-4 hours | Clearer trends, less noise | Fewer opportunities |
| **1-hour** | Position | 4-24 hours | Strong signals, less monitoring | Wider stops required |
**Recommendation**: Start with 5-minute for best balance of signal quality and opportunity frequency.
## Combining with Other Indicators
### VMACDv3 + ACCDv3
- **Use**: Confirm volume flow with price momentum
- **Signal**: Both showing dark green = highest conviction long
- **Divergence**: VMACDv3 bullish + ACCDv3 bearish = examine price action
### VMACDv3 + RSI
- **Use**: Overbought/oversold with momentum confirmation
- **Signal**: RSI < 30 + dark green VMACD = strong reversal
- **Caution**: RSI > 70 + light green VMACD = potential false breakout
### VMACDv3 + Elder Impulse
- **Use**: Bar coloring + histogram confirmation
- **Signal**: Green Elder bars + dark green VMACD = aligned momentum
- **Exit**: Blue Elder bars + light colors = momentum stalling
## Limitations
- **Requires volume data**: Will not work on instruments without volume feed
- **Lagging indicator**: MACD inherently follows price (2-3 bar delay)
- **Consolidation noise**: Generates false signals in tight ranges
- **Gap handling**: Large gaps can distort volume-weighted values
- **Not standalone**: Should combine with price action and support/resistance
## Troubleshooting
**Problem**: Too many light colored signals
**Solution**: Increase Volume MA Length to 30-40 for stricter filtering
**Problem**: Missing entries due to waiting for dark colors
**Solution**: Lower Volume MA Length to 10-15 for more signals (accept lower quality)
**Problem**: Divergences not appearing
**Solution**: Verify volume data available; check if A/D line is calculating
**Problem**: Histogram colors not changing
**Solution**: Ensure real-time data feed; refresh indicator
## Version History
- **v3**: Removed traditional MACD, using volume-weighted MACD on price with A/D divergence
- **v2**: Added A/D divergence detection, volume strength filtering, enhanced histogram colors
- **v1**: Basic volume-weighted MACD on price
## Related Indicators
**Companion Tools**:
- **ACCDv3**: Volume-weighted MACD on A/D line (distribution focus)
- **RSIv2**: RSI with A/D divergence detection
- **DMI**: Directional Movement Index with A/D divergence
- **Elder Impulse**: Bar coloring system using volume-weighted MACD
**Use Together**: VMACDv3 (momentum) + ACCDv3 (distribution) + Elder Impulse (bar colors) = complete volume-based trading system
---
*This indicator is for educational purposes. Past performance does not guarantee future results. Always practice proper risk management and never risk more than you can afford to lose.*

⚪ SILVER — RISK MATRIX + UQ vC (Final HUD)Silver RISK MATRIX + UQ vC is an advanced Pine Script v5 indicator for silver futures (SIL) trading, featuring a 3-column bottom-right HUD combining a 7-factor risk matrix with UQ predictive scoring. It quantifies position, structure, trend conflicts, impulse, volume, fake breaks, and VWAP deviation into total risk levels (LOW/MEDIUM/HIGH) while fusing predictive BUY/SELL probabilities with directional risk and multi-timeframe trend boosts.
Risk Matrix Breakdown
Position Risk
Measures % distance to 18-period support/resistance: <0.10% resistance = high risk (🟥🟥), <0.25% = medium (🟧⬜), <0.10% support = safe (🟩⬜). Silver-tuned for tight proximity sensitivity.
Structure Risk
Detects pivot-based CHoCH conflicts (close breaks prior HH/HL but structure opposes) or fake breaks, scoring 2 for conflicts using tight 2-left/2-right pivots suited to silver's volatility.
Other Factors
Trend Conf: 5m vs 30m EMA40 mismatch (2 points).
Impulse: Body >1.2x 4-period EMA abs body (exhaustion).
Volume: >3.2x/2.2x 20-SMA thresholds for extreme/obvious surges.
Fake Break: Wick >1.2x body (top/bottom).
VWAP: >1.2%/0.6% deviation. Total ≥6=HIGH (red), ≥3=MEDIUM (orange).
UQ Predictive Engine
Base Prediction
Averages flow (OBV+price), momentum (RSI/MFI), VWAP, trend (EMA20/50), turbo (BB width expansion) into pred_buy/sell (0-1 normalized).
Directional Risk
BUY risk weights fakeUp wicks, impulse, bear vol, low position; SELL mirrors. Clamped 0-1.
Trend Boost
Adds 15% for 2H alignment, 10% for 30m, 5% for VWAP (directional).
Final Fusion
BUY_FINAL = 55% pred + 25% risk + 20% boost; normalized vs SELL counterpart. Displays blocks (🟩🟩🟩🟩=≥80%) and stars (⭐⭐⭐⭐⭐=≥85%).
HUD Layout & Usage
20-row table separates RISK MATRIX (rows 1-10) from UQ (11-18): metric | visual box/block | Chinese explanation. Perfect for silver's high-volatility scalping, balancing exhaustive risk scanning with probabilistic edge quantification. Ready in both English and Chinese
