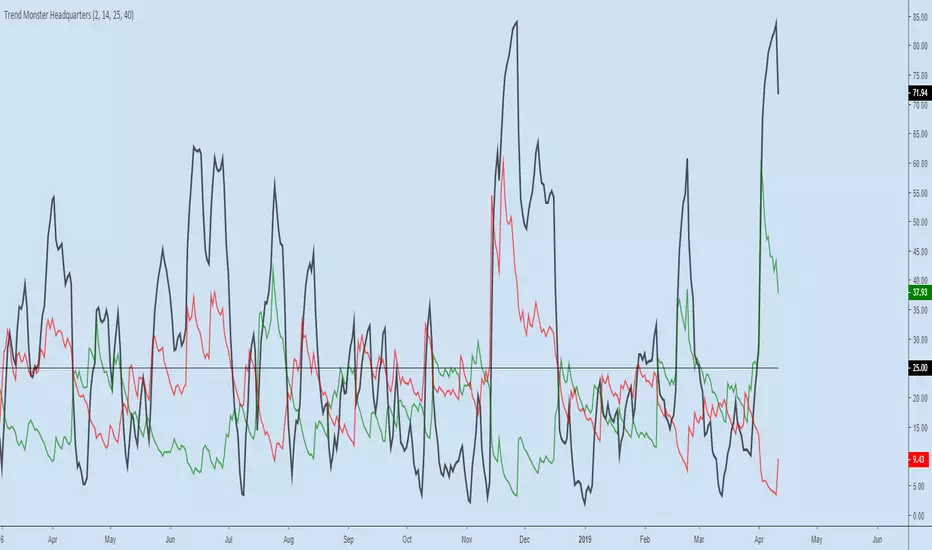
Trend Monster HeadquartersADX-DMI enhanced & modified for faster reaction
ADX (black line) above 80 = mega-trend peaked, reversal imminent, rare case scenario
ADX (black line) above 60 = trend topping out, reversal possible, depending on other indicators
ADX (black line) above 25 threshold = trend strenghening
DMI- (red line) - above 25 - bear trend strenghening
DMI+ (green line) - above 25 - bull trend strenghening
DMI- (red line) - coming off the bottom - bull trend weakening
DMI+ (green line) - coming off the bottom - bear trend weakening
Recherche dans les scripts pour "美联储9月降息25个基点"
BB and RSI Indicator Alert v0.3 by JustUncleLI have just recently revised this indicator alert for public release. This is for the 60sec Bollinger Band break Binary Option traders.
This indicator alert is a variation of one found in a well known Broker's marketing videos. It uses Bollinger bands, RSI and moving averages. Included is a pre-warning alert condition. The strategy and settings are designed for 1min charts and Binary Options, but it could work for up to 15 min charts.
The default settings are BB(14,2) and RSI(11) with 75/25 Levels boundaries. To be a valid trade the RSI needs to be within 75/25 channel. The optional Market direction filter is enabled by default and is calculated by two EMA (200 and 50):
When 200ema rising and 50ema above 200ema then market going up.
When 200ema falling and 50ema below 200ema then market going down.
A potential Bollinger Break reversal trades identified by shapes: The purple diamond is the pre-warning purple alert and the green and red pointers with the PUT/CALL labels are the trade alerts. Make Binary Option trade in specified direction 60sec (or can also use 120sec trade without Martingale).
* Notes and Hints *
The original videos specified a Martingale money management strategy, be careful using this management. When I use Martingale I recommend go to 3 levels: 10, 25, 65 if no win at 65 stop trading this alert and start next alert back at 10, you should recovery loss by future wins given you are able to get a reasonable ITM rate with this strategy. Alternatively instead of using Martingale use 120sec Binary Option trade.
Be wary of break alerts on a steep Bollinger, they tend to keep running away for awhile, especially if steep on both sides of Bollinger channel.
As with most of this style of indicator the alert conditions will redraw until the candle is closed. For me this is okay, as it is an Alert is only to a potential trade and final decision to trade is made by me.
You need to practise this and be aware of market news, sessions boundaries, slow trading periods etc. Plan your periods of when you should trade, I prefer Asian session before lunch and London sessions.

Insync Index [LazyBear]BB Support + Histo mode
-------------------------------
Code: pastebin.com
Show enclosing BB
Show Insync as Histo:
v02 - Configurable levels
---------------------------------
Small update to allow configuring the 95/75/25/5 levels.
Latest source code: pastebin.com
v01 - orginal description
---------------------------------
Insync Index, by Norm North, is a consensus indicator. It uses RSI, MACD, MFI, DPO, ROC, Stoch, CCI and %B to calculate a composite signal. Basically, this index shows that when a majority of underlying indicators is in sync, a turning point is near.
There are couple of ways to use this indicator.
- Buy when crossing up 5, sell when crossing down 95.
- Market is typically bullish when index is above 50, bearish when below 50. This can be a great confirmation signal for price action + trend lines.
Also, since this is typical oscillator, look for divergences between price and index.
Levels 75/25 are early warning levels. Note that, index > 75 (and less than 95) should be considered very bullish and index below 25 (but above 5) as very bearish. Levels 95/5 are equivalent to traditional OB/OS levels.
The various values of the underlying components can be tuned via options page. I have also provided an option to color bars based on the index value.
More info: The Insync Index by Norm North, TASC Jan 1995
drive.google.com
List of my free indicators: bit.ly
List of my app-store indicators: blog.tradingview.com
(Support doc: bit.ly)

Neural Fusion ProNeural Fusion Pro
Overview
Neural Fusion Pro is a multi-factor scoring system that combines numerous technical analysis methods into a single unified score. Rather than requiring traders to monitor multiple indicators separately, this system synthesizes trend strength, momentum oscillators, volume confirmation, price structure, and price action quality into one composite reading that adapts to current market conditions.
The Scoring System
At the heart of this indicator is a weighted scoring algorithm that produces a value between -1.0 and +1.0. Positive scores indicate bullish conditions across the measured factors, while negative scores suggest bearish conditions. The magnitude of the score reflects the strength of conviction across indicators.
The score is calculated from five distinct components, each capturing a different aspect of market behavior. Users can adjust the weight given to each component based on their trading style and market preferences.
Component 1: Trend Strength and Direction
This component uses the Average Directional Index to measure trend strength and the Directional Movement indicators to determine trend direction. When ADX exceeds the trending threshold, indicating a directional market, the component contributes a positive score if the positive directional indicator leads, or a negative score if the negative directional indicator leads. In ranging markets where ADX is low, this component contributes minimally to avoid false trend signals.
Component 2: Multi-Factor Momentum
Rather than relying on a single oscillator, this component synthesizes readings from RSI, MACD histogram, Stochastic, CCI, and Rate of Change. Each oscillator is normalized to a common scale and weighted according to its reliability characteristics. RSI readings are compared against dynamic thresholds that adjust based on trend state, making the indicator more forgiving in uptrends and more demanding in downtrends.
The component also includes divergence detection. When price makes a higher high but RSI makes a lower high (bearish divergence), or when price makes a lower low but RSI makes a higher low (bullish divergence), the divergence score adjusts the momentum component accordingly.
Component 3: Volume Confirmation
Volume provides crucial confirmation of price movements. This component analyzes On-Balance Volume relative to its moving average and measures the slope of OBV to determine whether volume is supporting the price trend. Additionally, it monitors relative volume by comparing current volume to its recent average, adding confirmation when volume spikes accompany price movements.
Component 4: Price Structure and Volatility
This component evaluates where price sits within the dynamic bands and considers the current volatility regime. When price is near the lower band, the component contributes a bullish score, suggesting potential support. When price is near the upper band, it contributes a bearish score, suggesting potential resistance.
The volatility regime assessment uses ATR percentile ranking. Low volatility periods often precede significant moves, while extremely high volatility may indicate unsustainable conditions.
Component 5: Price Action Quality
This component examines the character of recent candles by tracking the ratio of bullish to bearish candles over a lookback period. Consistent bullish price action contributes a positive score, while consistent bearish action contributes negatively. This helps filter signals by confirming that price behavior aligns with other factors.
Dynamic Bands
The indicator plots adaptive bands around a central basis line. The basis can be configured as either a simple or exponential moving average. Band width is determined by ATR multiplied by a dynamic factor that incorporates both ADX (expanding bands in trending markets) and the Chaikin Oscillator (expanding bands during strong accumulation or distribution).
These bands serve multiple purposes: they provide visual context for price position, they define signal trigger zones, and they help identify overextended conditions.
Trend State Detection
The indicator classifies market conditions into three states that affect signal generation and threshold levels.
Strong Uptrend is identified when ADX is rising, ADX exceeds the strong trend threshold, and the positive directional indicator exceeds the negative. This state triggers the most aggressive buy settings, allowing entries on shallow pullbacks.
Downtrend is identified when the negative directional indicator exceeds positive DI and ADX confirms directional movement. This state applies the most conservative buy settings, requiring deep oversold conditions before generating buy signals.
Neutral applies when neither trend condition is met, using moderate threshold settings appropriate for range-bound or transitional markets.
Dynamic RSI Thresholds
A key innovation is the automatic adjustment of RSI thresholds based on trend state. In a strong uptrend, the buy RSI threshold might be set to 50, allowing entries when RSI merely pulls back to neutral rather than requiring oversold conditions. The sell threshold rises to 72, keeping traders in positions longer during favorable conditions.
In downtrends, the buy RSI threshold drops to 25, ensuring buys only trigger on genuine capitulation. The sell threshold drops to 64, making exits easier to trigger.
In neutral markets, traditional oversold and overbought levels apply, with buy triggers around RSI 30 and sell triggers around RSI 68.
This adaptive approach prevents the common problem of indicators that work well in one market environment but fail in others.
Dynamic Cooldown
The signal cooldown period adjusts based on trend strength. During normal conditions, a standard cooldown prevents signal clustering. When ADX exceeds the strong trend threshold and is rising, indicating a powerful trend, the cooldown period extends. This helps traders stay in winning positions longer by reducing the frequency of counter-trend signals.
Cascade Protection
The indicator includes protection mechanisms to prevent overtrading and averaging down into losing positions.
The BBWP (Bollinger Band Width Percentile) monitor tracks current volatility relative to historical levels. When BBWP exceeds a threshold, indicating a volatility spike often associated with sharp moves, all buy signals are frozen. This protects against entering during panic selloffs or blow-off tops.
The consecutive buy counter tracks how many buy signals have occurred without an intervening sell. After reaching the maximum (default 3), no additional buy signals are generated until a sell occurs. This prevents the destructive pattern of repeatedly buying a declining asset.
Both protection mechanisms are displayed in the information panel, allowing traders to understand why signals may or may not be firing.
Signal Generation
Buy signals require price to touch or penetrate the lower band, RSI to be below the dynamic threshold, and the market to be in a trending state (when that filter is enabled). Additionally, the cooldown period must have elapsed and cascade protection must not be blocking buys.
Sell signals require price to touch or penetrate the upper band, RSI to be above the dynamic threshold, and the cooldown to have elapsed.
Signal labels display the entry price, signal type (shallow dip, capitulation, extended, bounce sell, or neutral), and the current position in the consecutive buy count.
Visual Components
The indicator provides multiple layers of visual feedback.
Cloud shading between the bands changes based on whether the composite score is in a buy zone or sell zone. Green clouds indicate bullish score readings, while red clouds indicate bearish readings.
Background coloring reflects the overall market regime. Green background indicates a bullish regime (positive DI leadership with volume confirmation), red indicates bearish regime, and white indicates neutral conditions.
An ADX bar at the bottom of the chart uses color coding: white for ranging (very low ADX), orange for flat, and blue for trending conditions.
The information panel displays the composite score with color coding, current trend state, active RSI thresholds, divergence status, BBWP freeze status, buy counter, market regime, ADX value with trend indicator, current cooldown setting, and live RSI reading color-coded against the active thresholds.
A debug panel can be enabled to show the individual component scores, helping users understand what is driving the composite reading.
How to Use
Monitor the composite score in the information panel. Readings above the buy threshold combined with price near the lower band represent potential long entries. Readings below the sell threshold with price near the upper band suggest exit opportunities.
Pay attention to the trend state. In strong uptrends, be more willing to buy dips and more patient with holding positions. In downtrends, require stronger confirmation before entering and be quicker to take profits on bounces.
Watch the cascade protection status. If BBWP shows frozen or the buy counter is approaching maximum, exercise additional caution regardless of other signals.
Use the dynamic RSI thresholds as context. When the panel shows buy RSI threshold at 50 (strong uptrend), even a pullback to RSI 45 is a potential entry. When the threshold shows 25 (downtrend), wait for genuine capitulation conditions.
Component Weight Adjustment
The relative importance of each scoring component can be adjusted through the settings. The default weights emphasize trend strength (30%) and momentum (25%), with volume (20%), price structure (15%), and price action (10%) providing confirmation.
For trend-following strategies, consider increasing trend and momentum weights. For mean-reversion approaches, increase the price structure weight to emphasize band position. The weights should sum to approximately 1.0 for proper score scaling.
Settings Guidance
The default settings are calibrated for cryptocurrency markets on lower timeframes. For traditional markets or longer timeframes, consider adjusting the ADX trending threshold (lower values for less volatile assets), the dynamic RSI levels for each trend state, and the cascade protection parameters.
The Heikin Ashi option for band calculation can provide smoother bands but may introduce slight lag. The default setting uses standard price data for better real-time accuracy.

Helix Protocol 7Helix Protocol 7
Overview
Helix Protocol 7 is a trend-adaptive signal engine that automatically adjusts its buy and sell criteria based on current market conditions. Rather than using fixed thresholds that work well in some environments but fail in others, Helix detects whether the market is in a strong uptrend, neutral consolidation, or downtrend, then applies the appropriate signal parameters for each state. This adaptive approach helps traders buy dips aggressively in confirmed uptrends while requiring much stricter conditions before buying in downtrends.
Core Philosophy
The fundamental insight behind Helix is that the same indicator readings mean different things in different market contexts. An RSI of 45 during a strong uptrend represents a healthy pullback and buying opportunity. That same RSI of 45 during a confirmed downtrend might just be a brief pause before further decline. Helix encodes this context-awareness directly into its signal logic.
The Money Line
At the center of the indicator is the Money Line, which can be configured as either a linear regression line or a weighted combination of exponential moving averages. Linear regression provides a mathematically optimal fit through recent price data, while the weighted EMA option offers more responsiveness to recent price action. The slope of the Money Line determines whether the immediate price trend is bullish, bearish, or neutral, which affects the color of the bands and cloud shading.
Dynamic Envelope Bands
Upper and lower bands are calculated using Average True Range multiplied by a dynamic factor. When ADX indicates trending conditions, the bands automatically widen to accommodate larger price swings. The Chaikin Accumulation/Distribution indicator also influences band width, with strong accumulation or distribution causing additional band expansion. This dual adaptation helps the bands remain relevant across different volatility regimes.
Trend State Detection
Helix classifies market conditions into four distinct states using a combination of ADX behavior and Directional Movement analysis.
Strong Uptrend requires ADX to be rising (gaining momentum), ADX value above a threshold (default 25), and the positive directional indicator exceeding the negative. This combination confirms not just that price is rising, but that the trend is strengthening.
Strong Downtrend uses the same ADX requirements but with the negative directional indicator dominant. This identifies accelerating downward momentum.
Weak Downtrend is detected when ADX is falling (trend losing steam) but negative DI still exceeds positive DI. This often represents the exhaustion phase of a decline.
Neutral applies when none of the above conditions are met, typically during consolidation or when directional indicators are close together.
Adaptive Signal Thresholds
The indicator uses Fisher Transform and RSI as its primary oscillators, but the trigger levels change based on trend state.
During Strong Uptrend, buy conditions are relaxed significantly. The Fisher threshold might be set to 1.0 (only slightly below neutral) and RSI to 50, allowing entries on minor pullbacks within the established trend. Sell conditions are tightened, requiring Fisher above 2.5 and RSI above 70, letting winning positions run longer.
During Neutral conditions, both buy and sell thresholds return to traditional oversold and overbought levels. Fisher must reach -2.0 for buys and +2.0 for sells, with RSI requirements around 30 and 65 respectively.
During Downtrend, buy conditions become very strict. Fisher must reach extreme oversold levels like -2.5 and RSI must drop below 25, ensuring buys only trigger on genuine capitulation. Sell conditions are loosened, allowing exits on any meaningful bounce.
This asymmetric approach embodies the trading principle of being aggressive when conditions favor you and defensive when they do not.
Band Touch Signals
In addition to oscillator-based signals, Helix generates signals when price touches the dynamic bands. A touch of the lower band indicates potential support and generates a buy signal. A touch of the upper band suggests potential resistance and generates a sell signal. These band-based signals work alongside the oscillator signals, providing entries even when Fisher and RSI have not reached their thresholds.
Extreme Move Detection
Sometimes price moves so violently that it penetrates the bands by an unusual amount. Helix measures this penetration depth as a percentage of ATR and can flag these as "extreme" signals. Extreme signals have special properties: they can fire intra-bar (before the candle closes) to catch wick entries, they can bypass normal cooldown periods, and they can optionally bypass volatility freezes. This allows the indicator to capture panic selling events that might be missed by waiting for candle closes.
Cascade Protection System
A critical feature for risk management is the built-in cascade protection that prevents averaging down into oblivion. The system has two components.
First, it tracks Bollinger Band Width Percentile, which measures current volatility relative to its historical range. When BBWP exceeds a threshold (default 92%), indicating a volatility spike often associated with sharp directional moves, all buy signals are temporarily frozen. This prevents entries during the most dangerous market conditions.
Second, it counts consecutive buy signals without an intervening sell. After reaching the maximum (default 3), no additional buy signals are generated until a sell occurs. This absolute limit prevents the common mistake of repeatedly buying a falling asset.
The protection status is displayed in the information panel, showing current BBWP level and the consecutive buy count.
RSI Divergence Detection
Helix includes automatic detection of RSI divergences, which often precede trend reversals. Regular bullish divergence occurs when price makes a lower low but RSI makes a higher low, suggesting weakening downside momentum. Regular bearish divergence is the opposite pattern at tops. Hidden divergences, which suggest trend continuation rather than reversal, are also detected and can be displayed optionally. Divergence lines are drawn directly on the price chart connecting the relevant pivot points.
Signal Cooldown
To prevent signal clustering and overtrading, a configurable cooldown period prevents new signals for a set number of bars after each signal. This ensures each signal represents a distinct trading opportunity.
Visual Components
The indicator provides comprehensive visual feedback. The Money Line changes color based on slope direction. The cloud shading between bands reflects trend bias. An ADX bar at the bottom of the chart uses color coding to show trend state at a glance: lime for strong uptrend, red for downtrend, white for ranging (very low ADX), orange for flat, and blue for trending but not yet strong.
Price labels appear at signal locations showing the entry or exit price, the trigger type (band touch, uptrend dip, capitulation, etc.), and the current position in the consecutive buy count.
The information panel displays current trend state, divergence status, BBWP freeze status, buy counter, ADX with direction arrow, DI spread, Fisher and RSI values, and the current active thresholds for buy and sell signals. A compact mode is available for mobile devices.
How to Use
In strong uptrends, look for buy signals on pullbacks to the Money Line or lower band. The relaxed thresholds will generate more frequent entries, which is appropriate when trend momentum is confirmed. Consider letting sell signals pass if the trend remains strong.
In neutral markets, treat signals more selectively. Both buy and sell signals require significant oscillator extremes, making them higher-probability but less frequent.
In downtrends, exercise extreme caution with buy signals. The strict requirements mean buys only trigger on major oversold conditions. Respect sell signals promptly, as the loosened thresholds are designed to protect capital.
Always monitor the cascade protection status. If BBWP shows frozen or the buy counter is at maximum, the indicator is warning you that conditions are dangerous for new long entries.
Settings Guidance
The default settings are calibrated for cryptocurrency markets on 5-minute timeframes. For other assets or timeframes, consider adjusting the ADX threshold for strong trend detection (lower for less volatile assets), the Fisher and RSI thresholds for each trend state, and the BBWP freeze level based on the asset's typical volatility profile.
The indicator includes a debug panel that can be enabled to show the detailed state of all conditions, useful for understanding why signals are or are not firing.

Multi-EMA Slope DashboardThis script provides a comprehensive dashboard displayed directly on the chart, allowing you to analyze the underlying trend using 8 Exponential Moving Averages (EMA) ranging from period 20 to 55.
Unlike classic indicators that simply check if the price is above or below the EMA, this tool analyzes the slope of each moving average to determine the true market dynamics.
The indicator calculates the status of 8 distinct EMAs (20, 25, 30, 35, 40, 45, 50, 55). For each EMA, the script determines the direction using the following logic:
Slope Calculation: It compares the current EMA value with its value 3 bars ago (variable nb_bougies).
Neutrality Threshold: To avoid false signals in ranging (flat) markets, a neutrality filter is applied (0.01% of the EMA value).
Dashboard Interpretation
The table is located at the top right of your screen and displays three columns:
EMA: The moving average period (e.g., 20, 55).
State:
H (Hausse / Up): The slope is positive and above the threshold.
B (Baisse / Down): The slope is negative and below the negative threshold.
N (Neutre / Neutral): The slope is weak, indicating no clear trend.
COL (Color): Quick visual indicator.
🔵 Blue: Bullish trend.
🟠 Orange: Bearish trend.
⚪ Gray: Neutral Trend / Ranging.
Trading Usage
Trend Confirmation: Use the "Totaux" (Totals) counter at the bottom of the table. If you see 8/8 H (Blue), the bullish trend is strong and aligned across all timeframes (short and medium term).
Reversal Detection: If fast EMAs (20, 25) turn Orange (B) while slow ones (50, 55) are still Blue (H), this may signal the beginning of a correction or a trend reversal.

Professional Market Dashboard [Master Edition].CRYPTOThe Problem: Trading in a Vacuum Most crypto traders fail not because they can't read a chart, but because they ignore the "Weather Report." They buy an Altcoin breakout while Bitcoin Dominance is skyrocketing, or they long a dip while Tether Dominance is spiking.
This dashboard solves that problem. It is designed to act as a Decision Support System, condensing the entire state of the crypto market into a single, institutional-grade panel. It replaces the need to have 5 different tabs open (BTC.D, USDT.D, TOTAL3, etc.) and allows you to trade with full context.
How It Works (The Logic Behind the Data)
This dashboard is divided into specific zones, designed to be scanned in a "Z" pattern:
1. The Engine (Header & Sentiment)
rVol (Relative Volume) : Compares current volume to the 20-period moving average. If rVol is < 100%, the header turns Grey, signaling a "Quiet Day" (low probability for breakouts).
Net Flow ($) : Unlike standard volume indicators that suffer from "unit bias" (where 1M cheap coins looks equal to 1M expensive coins), this calculates Dollar Turnover. It multiplies volume by price to show the actual capital flowing in or out of the asset in USD.
Sentiment: A smart label that combines Net Flow direction with VWAP (Volume Weighted Average Price) context. It only signals "BULLISH" if price is above VWAP and Net Flow is positive.
2. Market Context (The Macro Layer)
USDT.D (Tether Dominance): The "Fear Gauge" of crypto. When this is rising, traders are fleeing to stablecoins (Risk Off). When falling, capital is deploying into assets (Risk On).
BTC.D (Bitcoin Dominance): The "Cycle Gauge."
Rising: Bitcoin is sucking liquidity from the market (Risk of Alts bleeding).
Falling: Capital is rotating into Alts (Potential Altseason).
R S(BTC): Relative Strength against Bitcoin. This calculates the performance spread between the current asset and BTC. If this is RED, the asset is underperforming Bitcoin, suggesting it may be better to just hold BTC.
3. Sector Flow (Capital Rotation)
TOTAL3: The Market Cap of the top 125 coins excluding BTC and ETH. This is the purest chart for "Altcoin Health."
SOL & ETH: Leaders for the L1 and Smart Contract sectors. Monitoring these helps identify if a move is isolated or sector-wide.
4. Trend & Technicals
ADX (Trend Strength): Measures the intensity of the trend, not the direction. If ADX > 25, the background turns red/green, signaling a trending environment. If < 25 (Grey), the market is chopping.
Smart Levels: Automatically calculates the daily Fibonacci Pivot points based on yesterday's High/Low to project the next major Support or Resistance level.
MAs: A quick-glance view of the 9/21 EMAs and 100/200 SMAs to determine trend alignment across timeframes.
Visual Design The panel uses a "Stealth" color palette (Matte Green/Red and Slate Grey) to reduce eye strain during long sessions and prevent "false signals" from overly bright colors during low-volatility periods.
Disclaimer This tool is for informational and educational purposes only. It does not provide financial advice or guarantee profits. Always perform your own due diligence.

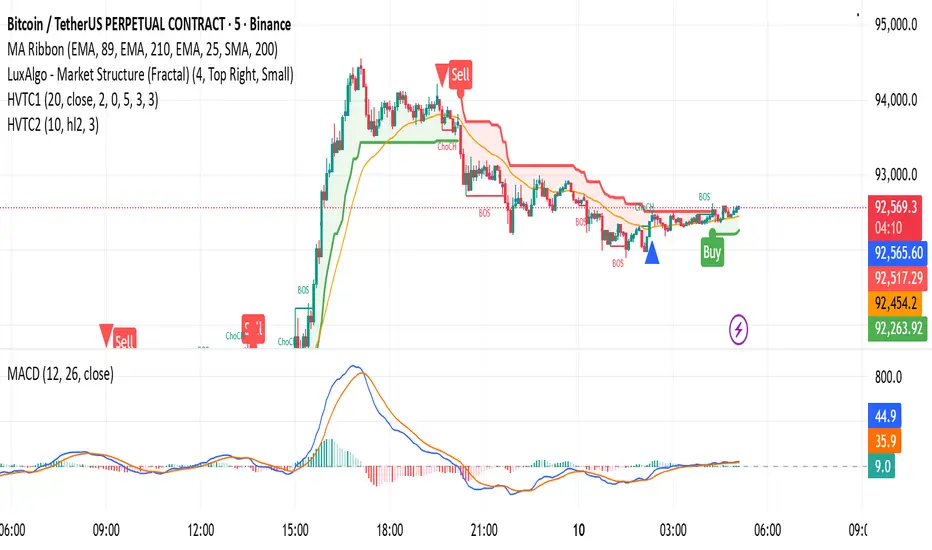
HVTC 1HVTC – SMC Market Structure & Trend Indicator
HVTC is a Smart Money Concepts–based tool that helps traders visualize market structure and trend direction with clarity.
Features:
CHoCH & BOS Detection
Automatically identifies structural shifts using true SMC logic and labels them directly on the chart.
Trend Filter
Confirms bullish or bearish conditions using an internal trend system to keep trades aligned with the major direction.
EMA 25 Guide
EMA 25 acts as dynamic support/resistance, helping define momentum and bias.
Alerts (Optional)
Notify traders when CHoCH/BOS or key retests occur—ideal for those who don’t monitor charts continuously.
Use Cases:
Works for Crypto, Forex, Gold, Indices, and Stocks across all timeframes. Helps improve entries, exits, and overall market understanding based on institutional structure.
Not financial advice. Use with proper risk management.
On Balance Volume [BrightSideTrading]
# On Balance Volume - Complete User Guide
## Overview
This enhanced OBV indicator provides clean, actionable volume analysis with intelligent signal filtering. It combines On-Balance Volume (OBV) with a smoothed signal line to identify shifts in buying and selling pressure without chart clutter.
**Key Features:**
- Real-time OBV and signal line visualization
- Smart crossover detection with confirmation filtering
- Z-Score momentum analysis
- Customizable signal alerts with V-shaped markers
- Window-normalized option for detrended analysis
---
## What is On-Balance Volume (OBV)?
OBV is a volume-based momentum indicator that accumulates volume on up days and subtracts volume on down days. It answers a fundamental question: **Is volume flowing in (buying) or out (selling)?**
**Formula:**
- If Close > Previous Close: OBV = Previous OBV + Volume
- If Close < Previous Close: OBV = Previous OBV - Volume
- If Close = Previous Close: OBV = Previous OBV (unchanged)
**What it tells you:**
- **Rising OBV** = Accumulation (smart money buying)
- **Falling OBV** = Distribution (smart money selling)
- **OBV above zero line** = Net positive buying pressure
- **OBV below zero line** = Net negative selling pressure
---
## Interface & Settings
### **MAIN VISUALIZATION**
**OBV Line (Green/Red Ribbon)**
- Green when OBV is above the signal line (bullish trend)
- Red when OBV is below the signal line (bearish trend)
- Toggles between window-normalized (detrended) and raw values
**Signal Line (Orange)**
- Smoothed average of OBV
- Crossovers with OBV generate buy/sell signals
- Default: 21-period SMA
**V-Shaped Markers**
- Green upward V = Bullish crossover (buy signal)
- Red downward V = Bearish crossover (sell signal)
- Appears at the OBV value when signal is triggered
**Zero Line (Yellow)**
- Center equilibrium point for volume balance
- Acts as support/resistance for OBV
- Separates buying pressure (above) from selling pressure (below)
---
### **SOURCE GROUP**
**Source**
- **Default:** Close
- **Options:** Open, High, Low, or any custom value
- Controls which price value triggers OBV direction changes
- Most traders use Close for standard OBV calculation
---
### **SIGNAL SMOOTHING GROUP**
**Show Signal?**
- **Default:** ON
- Toggle visibility of the signal line
- Disable if you prefer to see raw OBV only
**Smoothing Type**
- **SMA (Simple Moving Average)** - Default, standard smoothing
- **EMA (Exponential Moving Average)** - Faster response, weights recent bars more heavily
- **Choose SMA** for consistent, traditional OBV signals
- **Choose EMA** for faster trend identification (more whipsaws possible)
**Smoothing Length**
- **Default:** 21 bars
- **Range:** 1-200 bars
- **Lower values** (5-14): Faster signals, more noise
- **Higher values** (30-50): Slower signals, fewer false alarms
- **Recommendation:** Use 21-25 for most timeframes
---
### **SIGNAL FILTERING GROUP**
This is your primary control for signal quality and frequency.
**Show Signal Markers?**
- **Default:** ON
- Toggle the V-shaped buy/sell markers on/off
- Disable if markers distract from your analysis
**Signal Filter Type**
- **None** - Shows every single crossover (noisy, best for skilled traders)
- **Confirmation Bars** - Waits N bars before confirming signal (recommended)
- **Strength-Based** - Only signals during strong momentum (filters weakest moves)
#### **CONFIRMATION BARS MODE** (Recommended)
Best for reducing false signals while staying responsive to real moves.
**Confirmation Bars**
- **Default:** 2 bars
- **Range:** 1-10 bars
- Waits for the signal to hold for N consecutive bars after crossover
- **Setting 1:** Every crossover (same as "None")
- **Setting 2:** Wait 1 bar confirmation (good balance)
- **Setting 3:** Wait 2 bars confirmation (filters 50% of noise)
- **Setting 4+:** Very selective, misses quick reversals
**How it works:**
1. OBV crosses signal line → Confirmation counter starts
2. If OBV stays on correct side for 2 bars → V-marker appears
3. If OBV crosses back → Counter resets, no signal
#### **STRENGTH-BASED MODE**
Only signals when momentum is statistically significant.
**Min Z-Score Strength**
- **Default:** 0.3
- **Range:** 0.0-3.0
- Requires OBV deviation from its mean to reach this threshold
- **Setting 0.1-0.3:** More signals, lower quality
- **Setting 0.5-0.8:** Moderate signals, good quality
- **Setting 1.0+:** Only the strongest momentum shifts
**How it works:**
- Calculates how far OBV is from its 50-bar average (Z-score)
- Only shows signals when this distance is meaningful
- Automatically avoids weak, choppy market conditions
---
### **VISUALS & COLORS GROUP**
**Highlight Crossovers?**
- **Default:** ON
- Master toggle for all signal markers
- Turn OFF to see only the OBV/signal lines
**Apply Ribbon Filling?**
- **Default:** ON
- Colors the space between OBV and signal line
- Green fill = OBV above signal (bullish)
- Red fill = OBV below signal (bearish)
- Provides clear visual trend confirmation
- Turn OFF for minimal chart clutter
---
### **STATS & ZONES GROUP**
**Use Window-Normalized OBV (visual only)?**
- **Default:** ON
- Removes long-term trend from OBV for clearer short-term signals
- Detrends the indicator to highlight recent momentum changes
- **ON:** Better for swing trading and identifying reversals
- **OFF:** Better for trend-following strategies
- Note: Z-Score always uses raw OBV for statistical accuracy
**OBV Normalize Window**
- **Default:** 200 bars
- Lookback period for detrending calculation
- Larger values = more aggressive detrending
- Adjust if you want OBV to oscillate more/less around zero
**Show Z-Score (OBV)?**
- **Default:** ON
- Displays statistical momentum indicator below main chart
- Ranges from -3 to +3 (most data within -2 to +2)
- High Z-Score = Strong buying momentum
- Low Z-Score = Strong selling momentum
**Z-Score Lookback**
- **Default:** 50 bars
- Period for calculating Z-Score mean and standard deviation
- Larger = smoother Z-Score, slower response
- Smaller = noisier Z-Score, faster response
**Show ROC (OBV Momentum)?**
- **Default:** OFF
- Rate of Change indicator for OBV velocity
- Useful for identifying momentum turning points
- Enable if you want to see speed of volume changes
**ROC Lookback**
- **Default:** 14 bars
- Period for ROC calculation
**Show Z-Score StdDev Zones?**
- **Default:** ON
- Shaded regions around zero line showing statistical boundaries
- Inner Zone (±1 Z) = Normal variation
- Outer Zone (±2 Z) = Extreme moves, potential reversals
- Helps identify overbought/oversold volume conditions
**Inner Zone (±Z)**
- **Default:** 1.0
- First boundary for standard deviation zones
- Most normal trading occurs within ±1
**Outer Zone (±Z)**
- **Default:** 2.0
- Second boundary for extreme conditions
- Crossing these zones indicates significant momentum shift
---
## Trading Strategy Examples
### **Strategy 1: Signal Line Crossovers (Beginner)**
**Setup:**
- Signal Filter Type: **Confirmation Bars**
- Confirmation Bars: **2-3**
- Show Signal Markers: **ON**
**Rules:**
1. **BUY signal** (green V): When OBV crosses above signal line and holds for 2-3 bars
- Confirms buying pressure is building
- Look for price to follow within 1-3 bars
2. **SELL signal** (red V): When OBV crosses below signal line and holds for 2-3 bars
- Confirms selling pressure is increasing
- Expect price decline
3. **Exit:** Take profits at next signal or use price support/resistance
**Best For:** Swing trading, intraday reversals, timeframes 5m-1h
---
### **Strategy 2: Zero Line Bounce (Intermediate)**
**Setup:**
- Signal Filter Type: **Strength-Based**
- Min Z-Score Strength: **0.5**
- Show Z-Score StdDev Zones: **ON**
**Rules:**
1. **Watch OBV approach zero line** during established trends
- OBV bouncing repeatedly off zero = trend is healthy
- OBV breaking through zero = trend reversal imminent
2. **Enter on bounce:** Buy when OBV bounces from zero line in uptrend
3. **Exit on break:** Close position when OBV breaks below zero line
4. **Confirm with Z-Score:** Only take trades when Z-Score shows momentum (|Z| > 0.5)
**Best For:** Trend traders, identifying trend strength, medium timeframes 15m-4h
---
### **Strategy 3: Momentum Extremes (Advanced)**
**Setup:**
- Signal Filter Type: **None**
- Show Z-Score StdDev Zones: **ON**
- Outer Zone: **2.0**
**Rules:**
1. **Identify extremes:** When Z-Score breaks outer zone (±2.0)
- Indicator is in extreme territory
- Likely overextended
2. **Fade extremes:** Take opposite position when Z-Score hits extreme
- High Z (>2.0) = OBV overbought, expect pullback
- Low Z (<-2.0) = OBV oversold, expect bounce
3. **Confirm:** Wait for crossover signal to enter
4. **Target:** Outer zone of opposite side or zero line
**Best For:** Range trading, mean reversion, experienced traders only
---
## Reading the Indicator in Different Markets
### **Strong Uptrend**
- OBV consistently above signal line (green)
- OBV well above zero line, rising higher lows
- Z-Score positive, trending upward
- **Action:** Buy dips to signal line, sell at resistance
### **Strong Downtrend**
- OBV consistently below signal line (red)
- OBV well below zero line, making lower highs
- Z-Score negative, trending downward
- **Action:** Sell rallies to signal line, cover at support
### **Consolidation/Choppy Market**
- OBV whipsaws around signal line frequently
- Crossovers occur every few bars
- Z-Score oscillating between -1 and +1
- **Action:** Increase confirmation bars to 3-4, or switch to strength-based filter
### **Accumulation (Bottom Formation)**
- OBV rising while price is flat or falling
- Volume flowing in despite downtrend (bullish divergence)
- Z-Score climbing while price lows hold
- **Action:** Expect breakout up; prepare buy near support
### **Distribution (Top Formation)**
- OBV falling while price is flat or rising
- Volume flowing out despite uptrend (bearish divergence)
- Z-Score falling while price continues higher
- **Action:** Expect breakdown down; prepare short near resistance
---
## Parameter Tuning Guide
### **Aggressive Settings (More Signals)**
- Smoothing Length: 14
- Signal Filter: None or Confirmation Bars: 1
- Min Z-Score: 0.1
- Best for: Day trading, high volatility stocks
- Risk: More false signals
### **Balanced Settings (Recommended)**
- Smoothing Length: 21
- Signal Filter: Confirmation Bars: 2
- Min Z-Score: 0.3
- Best for: Swing trading, most market conditions
- Risk/Reward: Moderate
### **Conservative Settings (Fewer Signals)**
- Smoothing Length: 30-40
- Signal Filter: Confirmation Bars: 3-4 or Strength-Based: 0.7+
- Min Z-Score: 0.8
- Best for: Position trading, high-conviction trades only
- Risk: May miss some moves
---
## Common Questions & Troubleshooting
**Q: Why are there more sell signals than buy signals?**
A: This reflects the actual market action. Markets often decline faster than they rise (fear > greed). Confirm signals with price action and support/resistance.
**Q: The indicator keeps whipsawing, should I hide it?**
A: Increase Confirmation Bars to 3-4 or switch to Strength-Based filter. Market conditions matter—choppy markets require stricter filters.
**Q: What's the difference between normalized and raw OBV?**
A: Normalized (detrended) shows shorter-term momentum by removing long-term trends. Raw OBV shows absolute accumulation/distribution over the full period. Use normalized for swing signals, raw for trend confirmation.
**Q: My signals come too late. How do I get faster entry?**
A: Reduce Smoothing Length (try 14 instead of 21), use EMA instead of SMA, or set Confirmation Bars to 1. Trade-off: More false signals.
**Q: Can I use this for day trading?**
A: Yes, on 1m-5m charts with aggressive settings. Use Confirmation Bars: 1 and focus on Z-Score > 0.5 entries only.
**Q: Should I trade every signal?**
A: No. Filter signals using: price near support/resistance, multiple indicators confirming, and Z-Score showing momentum. Best signals occur at key levels.
---
## Best Practices
1. **Always confirm with price action:** OBV signals work best when price is near support, resistance, or moving average. Don't trade signals in a vacuum.
2. **Use volume context:** Check if volume is increasing or decreasing on the signal. Strong signals have volume confirmation (increasing volume on OBV spikes).
3. **Adjust settings per timeframe:**
- 1m-5m: Smoothing 12, Confirmation 1, Z-Score 0.2
- 15m-1h: Smoothing 20, Confirmation 2, Z-Score 0.3
- 4h-1d: Smoothing 25, Confirmation 3, Z-Score 0.5
4. **Watch the zero line:** It's your friend. OBV behavior at the zero line reveals trend strength. Bounces = healthy trend. Breaks = reversal.
5. **Risk management:** No indicator is perfect. Use proper position sizing and stop losses. OBV should confirm your thesis, not be the only reason to trade.
6. **Combine with other indicators:**
- Price moving averages for trend confirmation
- RSI or Stochastic for overbought/oversold levels
- Support/resistance for entry/exit zones
- MACD for momentum divergences
---
## Disclaimer
This indicator is for educational and informational purposes only. It is not financial advice. Past performance does not guarantee future results. Always conduct your own research and consult with a financial advisor before making trading decisions. Trading carries risk, including potential loss of principal.
---
## Version History
**Version 1.0** - Initial release with enhanced signal filtering, Z-Score analysis, and customizable parameters.

ChronoPulse MS-MACD Resonance StrategyChronoPulse MS-MACD Resonance Strategy
A systematic trading strategy that combines higher-timeframe market structure analysis with dual MACD momentum confirmation, ATR-based risk management, and real-time quality assurance monitoring.
Core Principles
The strategy operates on the principle of multi-timeframe confluence, requiring agreement between:
Market structure breaks (CHOCH/BOS) on a higher timeframe
Dual MACD momentum confirmation (classic and crypto-tuned profiles)
Trend alignment via directional EMAs
Volatility and volume filters
Quality score composite threshold
Strategy Components
Market Structure Engine : Detects Break of Structure (BOS) and Change of Character (CHOCH) events using confirmed pivots on a configurable higher timeframe. Default structure timeframe is 240 minutes (4H).
Dual MACD Fusion : Requires agreement between two MACD configurations:
Classic MACD: 12/26/9 (default)
Fusion MACD: 8/21/5 (default, optimized for crypto volatility)
Both must agree on direction before trade execution. This can be disabled to use single MACD confirmation.
Trend Alignment : Uses two EMAs for directional bias:
Directional EMA: 55 periods (default)
Execution Trend Guide: 34 periods (default)
Both must align with trade direction.
ATR Risk Management : All risk parameters are expressed in ATR multiples:
Stop Loss: 1.5 × ATR (default)
Take Profit: 3.0 × ATR (default)
Trail Activation: 1.0 × ATR profit required (default)
Trail Distance: 1.5 × ATR behind price (default)
Volume Surge Filter : Optional gate requiring current volume to exceed a multiple of the volume SMA. Default threshold is 1.4× the 20-period volume SMA.
Quality Score Gate : Composite score (0-1) combining:
Structure alignment (0.0-1.0)
Momentum strength (0.0-1.0)
Trend alignment (0.0-1.0)
ATR volatility score (0.0-1.0)
Volume intensity (0.0-1.0)
Default threshold: 0.62. Trades only execute when quality score exceeds this threshold.
Execution Discipline : Trade budgeting system:
Maximum trades per session: 6 (default)
Cooldown bars between entries: 5 (default)
Quality Assurance Console : Real-time monitoring panel displaying:
Structure status (pass/fail)
Momentum confirmation (pass/fail)
Volatility readiness (pass/fail)
Quality score (pass/fail)
Discipline compliance (pass/fail)
Performance metrics (win rate, profit factor)
Net PnL
Certification requires: Win Rate ≥ 40%, Profit Factor ≥ 1.4, Minimum 25 closed trades, and positive net profit.
Integrity Suite : Optional validation panel that audits:
Configuration sanity checks
ATR data readiness
EMA hierarchy validity
Performance realism checks
Strategy Settings
strategy(
title="ChronoPulse MS-MACD Resonance Strategy",
shorttitle="ChronPulse",
overlay=true,
max_labels_count=500,
max_lines_count=500,
initial_capital=100000,
currency=currency.USD,
pyramiding=0,
commission_type=strategy.commission.percent,
commission_value=0.015,
slippage=2,
default_qty_type=strategy.percent_of_equity,
default_qty_value=2.0,
calc_on_order_fills=true,
calc_on_every_tick=true,
process_orders_on_close=true
)
Key Input Parameters
Structure Timeframe : 240 (4H) - Higher timeframe for structure analysis
Structure Pivot Left/Right : 3/3 - Pivot confirmation periods
Structure Break Buffer : 0.15% - Buffer for structure break confirmation
MACD Fast/Slow/Signal : 12/26/9 - Classic MACD parameters
Fusion MACD Fast/Slow/Signal : 8/21/5 - Crypto-tuned MACD parameters
Directional EMA Length : 55 - Primary trend filter
Execution Trend Guide : 34 - Secondary trend filter
ATR Length : 14 - ATR calculation period
ATR Stop Multiplier : 1.5 - Stop loss in ATR units
ATR Target Multiplier : 3.0 - Take profit in ATR units
Trail Activation : 1.0 ATR - Profit required before trailing
Trail Distance : 1.5 ATR - Distance behind price
Volume Threshold : 1.4× - Volume surge multiplier
Quality Threshold : 0.62 - Minimum quality score (0-1)
Max Trades Per Session : 6 - Daily trade limit
Cooldown Bars : 5 - Bars between entries
Win-Rate Target : 40% - Minimum for QA certification
Profit Factor Target : 1.4 - Minimum for QA certification
Minimum Trades for QA : 25 - Required closed trades
Signal Generation Logic
A trade signal is generated when ALL of the following conditions are met:
Higher timeframe structure shows bullish (CHOCH/BOS) or bearish structure break
Both MACD profiles agree on direction (if fusion enabled)
Price is above both EMAs for longs (below for shorts)
ATR data is ready and above minimum threshold
Volume exceeds threshold × SMA (if volume gate enabled)
Quality score ≥ quality threshold
Trade budget available (under max trades per day)
Cooldown period satisfied
Risk Management
Stop loss and take profit are set immediately on entry
Trailing stop activates after 1.0 ATR of profit
Trailing stop maintains 1.5 ATR distance behind highest profit point
Position sizing uses 2% of equity per trade (default)
No pyramiding (single position per direction)
Limitations and Considerations
The strategy requires sufficient historical data for higher timeframe structure analysis
Quality gate may filter out many potential trades, reducing trade frequency
Performance metrics are based on historical backtesting and do not guarantee future results
Commission and slippage assumptions (0.015% + 2 ticks) may vary by broker
The strategy is optimized for trending markets with clear structure breaks
Choppy or ranging markets may produce false signals
Crypto markets may require different parameter tuning than traditional assets
Optimization Notes
The strategy includes several parameters that can be tuned for different market conditions:
Quality Threshold : Lower values (0.50-0.60) allow more trades but may reduce average quality. Higher values (0.70+) are more selective but may miss opportunities.
Structure Timeframe : Use 240 (4H) for intraday trading, Daily for swing trading, Weekly for position trading
Volume Gate : Disable for low-liquidity pairs or when volume data is unreliable
Dual MACD Fusion : Disable for mean-reverting markets where single MACD may be more responsive
Trade Discipline : Adjust max trades and cooldown based on your risk tolerance and market volatility
Non-Repainting Guarantee
All higher timeframe data requests use lookahead=barmerge.lookahead_off to prevent repainting. Pivot detection waits for full confirmation before registering structure breaks. All visual elements (tables, labels) update only on closed bars.
Alerts
Three alert conditions are available:
ChronoPulse Long Setup : Fires when all long entry conditions are met
ChronoPulse Short Setup : Fires when all short entry conditions are met
ChronoPulse QA Certification : Fires when Quality Assurance console reaches CERTIFIED status
Configure alerts with "Once Per Bar Close" delivery to match the non-repainting design.
Visual Elements
Structure Labels : CHOCH↑, CHOCH↓, BOS↑, BOS↓ markers on structure breaks
Directional EMA : Orange line showing trend bias
Trailing Stop Lines : Green (long) and red (short) trailing stop levels
Dashboard Panel : Real-time status display (structure, MACD, ATR, quality, PnL)
QA Console : Quality assurance monitoring panel
Integrity Suite Panel : Optional validation status display
Recommended Usage
Forward test with paper trading before live deployment
Monitor the QA console until it reaches CERTIFIED status
Adjust parameters based on your specific market and timeframe
Respect the trade discipline limits to avoid over-trading
Review quality scores and adjust threshold if needed
Use appropriate commission and slippage settings for your broker
Technical Implementation
The strategy uses Pine Script v6 with the following key features:
Multi-timeframe data requests with lookahead protection
Confirmed pivot detection for structure analysis
Dynamic trailing stop management
Real-time quality score calculation
Trade budgeting and cooldown enforcement
Comprehensive dashboard and monitoring panels
All source code is open and available for review and modification.
Disclaimer
This script is for educational and informational purposes only. It is not intended as financial, investment, or trading advice. Past performance does not guarantee future results. Trading involves substantial risk of loss and is not suitable for all investors. Always conduct your own research and consult with a qualified financial advisor before making any trading decisions. The author and TradingView are not responsible for any losses incurred from using this strategy.

ICT Fair Value Gap Detector [Eˣ]⚡ Fair Value Gap Detector
Overview
The Fair Value Gap Detector automatically identifies price imbalances on your charts - the inefficiencies left behind when price moves too quickly. This indicator reveals where price is likely to return for "rebalancing", based on ICT (Inner Circle Trader) concepts of market efficiency.
━━━━━━━━━━━━━━━━━━━━━━━━━━━━
🎯 What This Indicator Does
Detects Fair Value Gaps:
• 🟢 Bullish FVG - Gap left below during aggressive upward move
• 🔴 Bearish FVG - Gap left above during aggressive downward move
• Automatically identifies 3-candle price inefficiencies
• Works on all timeframes and instruments
Smart Fill Tracking:
• Full Fill - Price completely fills the gap
• 50% Fill - Price fills half the gap (critical level)
• Partial Fill - Price touches gap edge
• Real-time fill percentage tracking
• Auto-removes filled gaps (optional)
Professional Features:
• Active Gap Highlighting - Shows nearest unfilled gap
• Distance Calculator - Displays how far price is from gaps
• Market Bias - Analysis based on gap balance
• Size Filtering - Minimum gap size to avoid noise
• Visual Clarity - Clean boxes with color-coding
━━━━━━━━━━━━━━━━━━━━━━━━━━━━
📚 Understanding Fair Value Gaps
What Are Fair Value Gaps?
Fair Value Gaps (FVGs), also known as imbalances or inefficiencies, are zones where price moved so quickly that normal trading didn't occur. They represent:
• Price Imbalance - One-sided aggressive buying or selling
• Unfair Pricing - Some participants didn't get to trade at these levels
• Market Inefficiency - Supply/demand equilibrium was disrupted
• Rebalancing Zones - Price often returns to "fill" these gaps
The ICT Concept:
Markets constantly seek equilibrium (fair value). When price moves too fast:
1. It leaves gaps where normal trading didn't happen
2. These gaps represent unfair/inefficient pricing
3. Market has a tendency to return and "rebalance"
4. Smart money knows this and trades the fills
Why FVGs Work:
• Unfilled Orders - Traders who missed the move have pending orders in the gap
• Algorithmic Trading - Algos programmed to exploit inefficiencies
• Market Psychology - Traders notice gaps and place orders there
• Institutional Behavior - Smart money uses gaps for entries/exits
FVG vs Regular Gaps:
• Regular Gaps - Occur at market open, between daily closes
• Fair Value Gaps - Occur intraday, between 3 consecutive candles
• FVGs happen more frequently and on all timeframes
• FVGs are more tradeable for intraday/swing traders
━━━━━━━━━━━━━━━━━━━━━━━━━━━━
🟢 Bullish Fair Value Gaps Explained
How They Form:
Bullish FVG requires 3 candles:
1. Candle 1 - Any candle (sets the high reference)
2. Candle 2 - Strong bullish candle (aggressive buying)
3. Candle 3 - Continuation candle
The Gap: Candle 3's LOW is above Candle 1's HIGH = Gap left unfilled
Visual Example:
```
Candle 3: Low at $105 ──────────┐
│ ← GAP (Bullish FVG)
Candle 2: Strong bullish │
│
Candle 1: High at $100 ──────────┘
```
What It Means:
• Price jumped from $100 to $105+ so fast, no trading occurred in between
• This $100-$105 zone is "unfair" - buyers/sellers didn't get to trade there
• Market may return to this zone to "rebalance"
• When price returns, it often acts as support
Trading Bullish FVGs:
Strategy:
• Wait for price to retrace down into the bullish FVG (green box)
• Look for rejection/bounce from the gap zone
• Enter long when price respects the FVG as support
• Stop loss: Below the FVG
• Target: Previous high or opposite FVG
Best Entry Points:
• 50% Fill: Price enters middle of gap (highest probability)
• Full Fill: Price touches bottom of gap (aggressive entry)
• Tap & Reject: Price quickly enters and exits gap (strong signal)
Example Trade:
• Bullish FVG forms: $50,000 - $50,500 (500 point gap)
• Price rallies to $52,000 then retraces
• Price drops to $50,250 (50% of gap filled)
• Bullish reversal candle appears
• Enter long at $50,500, stop at $49,800
• Target: $52,000+
━━━━━━━━━━━━━━━━━━━━━━━━━━━━
🔴 Bearish Fair Value Gaps Explained
How They Form:
Bearish FVG requires 3 candles:
1. Candle 1 - Any candle (sets the low reference)
2. Candle 2 - Strong bearish candle (aggressive selling)
3. Candle 3 - Continuation candle
The Gap: Candle 3's HIGH is below Candle 1's LOW = Gap left unfilled
Visual Example:
```
Candle 1: Low at $100 ───────────┐
│ ← GAP (Bearish FVG)
Candle 2: Strong bearish │
│
Candle 3: High at $95 ───────────┘
```
What It Means:
• Price dropped from $100 to $95 so fast, no trading occurred in between
• This $95-$100 zone is "unfair" - buyers/sellers didn't get to trade there
• Market may return to this zone to "rebalance"
• When price returns, it often acts as resistance
Trading Bearish FVGs:
Strategy:
• Wait for price to retrace up into the bearish FVG (red box)
• Look for rejection/reversal from the gap zone
• Enter short when price respects the FVG as resistance
• Stop loss: Above the FVG
• Target: Previous low or opposite FVG
Best Entry Points:
• 50% Fill: Price enters middle of gap (highest probability)
• Full Fill: Price touches top of gap (aggressive entry)
• Tap & Reject: Price quickly enters and exits gap (strong signal)
Example Trade:
• Bearish FVG forms: $48,000 - $48,500 (500 point gap)
• Price drops to $46,000 then retraces
• Price rallies to $48,250 (50% of gap filled)
• Bearish reversal candle appears
• Enter short at $48,000, stop at $48,700
• Target: $46,000-
━━━━━━━━━━━━━━━━━━━━━━━━━━━━
📊 How To Use This Indicator
Strategy 1: FVG Rebalancing (Classic)
Best For: Swing trading, reversal trading
Timeframes: 15min, 1H, 4H
Win Rate: 65-75%
Entry Rules:
1. Identify unfilled FVG (bright color, not gray)
2. Wait for price to return to the gap
3. Best entry: 50% fill of the gap
4. Look for reversal confirmation:
• Bullish FVG: Pin bar, engulfing, hammer
• Bearish FVG: Shooting star, bearish engulfing
5. Enter when price bounces/rejects from FVG
6. Stop: Beyond opposite side of FVG
7. Target: 2-3R or previous high/low
Why It Works: 70%+ of FVGs get filled, and 60%+ show reaction
Strategy 2: FVG + Order Block Confluence
Best For: High-probability setups
Timeframes: 1H, 4H
Win Rate: 75-85%
Entry Rules:
1. Find FVG that overlaps with Order Block
2. This creates a "super zone" of confluence
3. Wait for price to return to this zone
4. Enter on first touch of confluence zone
5. Stop: Beyond the confluence zone
6. Target: 3-4R
Why It Works: Double institutional concepts = highest probability
Strategy 3: Multi-Timeframe FVG
Best For: Position trading, major moves
Timeframes: Combine Daily + 4H or 4H + 1H
Win Rate: 70-80%
Entry Rules:
1. Identify large FVG on higher timeframe (Daily/4H)
2. Wait for price to enter this HTF FVG
3. Switch to lower timeframe (4H/1H)
4. Look for LTF FVG within HTF FVG in same direction
5. Trade the LTF FVG fill
6. Stop: Below LTF FVG
7. Target: Exit HTF FVG or beyond
Why It Works: Timeframe alignment = institutional consensus
Strategy 4: FVG Rejection Trade
Best For: Quick scalps, day trading
Timeframes: 5min, 15min
Win Rate: 60-70%
Entry Rules:
1. Price enters FVG zone
2. Immediate rejection (strong reversal candle)
3. Enter on close of rejection candle
4. Tight stop beyond FVG
5. Quick target: 1-2R
Why It Works: Strong rejection = institutional defense of level
Strategy 5: FVG-to-FVG Trading
Best For: Momentum trading
Timeframes: 15min, 1H
Win Rate: 55-65%
Entry Rules:
1. Identify bullish FVG below and bearish FVG above
2. Enter long at bullish FVG, target bearish FVG
3. Or enter short at bearish FVG, target bullish FVG
4. Price often moves from one imbalance to another
5. Stop: Beyond trading FVG
6. Target: Opposite FVG
Why It Works: Price rebalances from one inefficiency to another
━━━━━━━━━━━━━━━━━━━━━━━━━━━━
⚙️ Settings Explained
Display Settings
Show Bullish/Bearish FVG
• Toggle each type on/off independently
• Customize colors for each FVG type
• Default: Green (bullish), Red (bearish)
• Tip: Use colors that contrast with your chart
Max FVG to Display (Default: 20)
• Limits how many gaps are shown at once
• Lower (10-15): Cleaner chart, recent gaps only
• Higher (30-50): More historical context
• Recommended: 15-25 for most trading
Show FVG Labels (Default: ON)
• Displays "FVG+" and "FVG-" text on gaps
• Shows 🎯 on active (nearest) gap
• Shows fill percentage (e.g., "FVG+ 35%")
• Turn OFF for minimal appearance
• Recommended: Keep ON for clarity
Extend Gaps (bars) (Default: 50)
• How far to extend gap boxes to the right
• Lower (20-30): Shorter boxes
• Higher (100+): Longer boxes, easier to see
• Gaps auto-extend until filled or limit reached
• Recommended: 40-60 bars
Filters
Min Gap Size % (Default: 0.05)
• Minimum gap size as percentage of price
• Filters out tiny, insignificant gaps
• Crypto: 0.05-0.15% (high volatility)
• Forex: 0.03-0.10% (moderate volatility)
• Stocks: 0.05-0.20% (varies by stock)
• Indices: 0.05-0.15%
• Adjust based on instrument's average move
Show Filled Gaps (Default: OFF)
• When ON: Shows gray boxes for filled gaps
• When OFF: Gaps disappear after mitigation
• Use ON: For learning and backtesting
• Use OFF: For clean, active trading view
Advanced Settings
Auto-Detect Mitigation (Default: ON)
• Automatically tracks when gaps are filled
• Updates fill percentage in real-time
• Marks gaps as "mitigated" when filled
• Recommended: Keep ON
Mitigation Type (Default: Full)
• Full: Gap considered filled when price closes through entire gap
• 50%: Gap considered filled at 50% (critical level)
• Partial: Gap considered filled on first touch
• For learning: Use "Full"
• For aggressive trading: Use "50%"
• For conservative trading: Use "Partial"
Highlight Nearest Gap (Default: ON)
• Highlights the closest unfilled gap to current price
• Active gap shown with 🎯 emoji and brighter color
• Helps focus on most relevant opportunity
• Recommended: Keep ON
━━━━━━━━━━━━━━━━━━━━━━━━━━━━
📱 Info Panel Guide
Bullish FVG Count
• Number of active (unfilled) bullish fair value gaps
• Higher number = More potential support zones below
• Multiple bullish FVGs = Strong rebalancing demand
Bearish FVG Count
• Number of active (unfilled) bearish fair value gaps
• Higher number = More potential resistance zones above
• Multiple bearish FVGs = Strong rebalancing supply
Bias Indicator
• ⬆ Bullish: More bullish FVGs than bearish
• ⬇ Bearish: More bearish FVGs than bullish
• ↔ Neutral: Equal FVGs on both sides
• Market tends to fill nearby gaps first
Target Indicator
• Shows nearest unfilled gap and distance
• Example: "Bull FVG -1.25%" = Bullish gap is 1.25% below price
• Example: "Bear FVG +0.85%" = Bearish gap is 0.85% above price
• Watch for price to reach these targets
━━━━━━━━━━━━━━━━━━━━━━━━━━━━
📱 Alert Setup
This indicator includes 4 alert types:
1. Price Entering Bullish FVG
• Fires when price drops into a bullish gap
• Action: Watch for bounce/reversal
• High-probability long setup developing
2. Price Entering Bearish FVG
• Fires when price rallies into a bearish gap
• Action: Watch for rejection/reversal
• High-probability short setup developing
3. New Bullish FVG Detected
• Fires when a new bullish gap forms
• Action: Mark zone for future fill
• New rebalancing target below identified
4. New Bearish FVG Detected
• Fires when a new bearish gap forms
• Action: Mark zone for future fill
• New rebalancing target above identified
To Set Up Alerts:
1. Click "Alert" button (clock icon)
2. Select "Fair Value Gap Detector"
3. Choose your alert condition
4. Configure notification method
5. Click "Create"
Pro Tip: Set "Price Entering" alerts to catch fills in real-time
━━━━━━━━━━━━━━━━━━━━━━━━━━━━
💎 Pro Tips & Best Practices
✅ DO:
• Wait for 50% fill - Middle of gap has highest win rate (65-70%)
• Use confirmation - Don't trade just because price touched gap
• Combine with structure - FVG + support/resistance = high probability
• Trade first fill - Unfilled gaps have better success rate than refilled
• Respect full fills - Once fully filled, gap is less reliable
• Use multiple timeframes - HTF FVGs are stronger than LTF
• Check session timing - FVGs work best during London/NY sessions
• Follow the bias - More bullish FVGs = favor longs
⚠️ DON'T:
• Don't blindly fade gaps - Wait for price action confirmation
• Don't ignore momentum - Strong trends can blow through FVGs
• Don't trade every gap - Quality over quantity
• Don't assume all gaps fill - About 70-80% fill, 20-30% don't
• Don't use tight stops - Allow room for wick into gap
• Don't overtrade - Wait for confluence and confirmation
• Don't fight trends - Best FVG trades are with higher TF trend
• Don't ignore fill percentage - 50% is often the sweet spot
🎯 Best Timeframes:
• Scalpers: 1min, 5min (many gaps, quick fills)
• Day Traders: 5min, 15min, 1H (balanced)
• Swing Traders: 1H, 4H, Daily (larger, more reliable gaps)
• Position Traders: 4H, Daily, Weekly (major imbalances)
🔥 Best Instruments:
• Excellent: BTC, ETH, ES, NQ, Forex majors (clean price action)
• Good: Gold, Oil, Major indices, Large-cap stocks
• Moderate: Altcoins, small-cap stocks (more noise)
• Best Markets: Trending markets with clear swings
⏰ Best Times for FVG Trading:
• London Session: High volume = reliable gap fills
• NY Session: Strong moves create quality gaps
• London-NY Overlap: Best time for gap creation and fills
• Asian Session: Lower probability, wait for London
━━━━━━━━━━━━━━━━━━━━━━━━━━━━
🎓 Advanced FVG Concepts
FVG Mitigation Levels
Understanding fill percentages:
• 0-25% Fill: Gap barely touched, often continues without fill
• 25-50% Fill: Partial rebalancing, may reverse here
• 50% Fill: CRITICAL LEVEL - Highest probability reversal zone
• 50-75% Fill: Deep rebalancing, strong reversal likely
• 75-100% Fill: Full rebalancing, gap's purpose fulfilled
Why 50% Matters: Market seeks equilibrium, and 50% represents perfect balance
FVG Inversions
When price breaks through a gap completely:
• Bullish FVG that's broken becomes bearish (support → resistance)
• Bearish FVG that's broken becomes bullish (resistance → support)
• Inverted gaps are weaker than fresh gaps
• Trading: Can fade the inverted gap but with caution
FVG Confluence Zones
Multiple FVGs at similar level:
• Creates "super gap" or confluence zone
• Much higher probability of reaction
• Wider zone for entries (more room for stops)
• Often aligns with other institutional concepts
FVG + Order Block Combo
When FVG overlaps with Order Block:
• Double institutional concept
• Extremely high probability setup (75-85% win rate)
• Price drawn to fill gap AND test order block
• Use tight stops, generous targets (3-5R possible)
Nested FVGs (Multi-Timeframe)
Small FVG inside larger FVG:
• Daily FVG contains 4H FVG contains 1H FVG
• Trade the smallest FVG in direction of larger ones
• Highest probability when all aligned
• Progressive targets: Fill small → medium → large gaps
FVG Exhaustion
When price creates multiple FVGs in same direction:
• Indicates strong momentum/impulsive move
• Each gap represents acceleration
• Last gap often signals exhaustion
• Watch for reversal after filling final gap
━━━━━━━━━━━━━━━━━━━━━━━━━━━━
📈 Common FVG Patterns
Pattern 1: The Perfect Rebalance
• FVG forms during strong move
• Price continues 100+ pips
• Clean return to 50% of gap
• Immediate reversal
• Textbook setup, 70%+ win rate
Pattern 2: The Double Fill
• Price partially fills gap (25%)
• Weak reaction, continues
• Returns again for deeper fill (75%)
• Strong reversal on second fill
• Second fill often better entry
Pattern 3: The Blow-Through
• Price approaches gap
• Completely ignores it, no reaction
• Keeps going in same direction
• Sign of very strong momentum
Pattern 4: The Magnet Effect
• Price slowly grinds toward gap
• Accelerates as it gets close
• Quickly fills and reverses
• Common in ranging markets
Pattern 5: The False Fill
• Price wicks into gap briefly
• Immediately reverses without filling
• "Stop hunt" or liquidity grab
• Gap remains unfilled
• Often precedes strong move
━━━━━━━━━━━━━━━━━━━━━━━━━━━━
🚀 What Makes This Different?
Unlike basic gap indicators, Fair Value Gap Detector:
• ICT Methodology - Based on proven institutional concepts
• Real-Time Fill Tracking - Shows percentage filled as it happens
• 3 Mitigation Types - Full, 50%, Partial for different strategies
• Active Gap Highlighting - Shows most relevant opportunity
• Smart Filtering - Minimum size to avoid noise
• Visual Clarity - Clean, professional appearance
• Auto-Management - Removes filled gaps automatically
• Distance Tracking - Know exactly where price needs to go
Based On Professional Concepts:
• ICT Fair Value Gap theory
• Market efficiency principles
• Price rebalancing dynamics
• Institutional order flow analysis
━━━━━━━━━━━━━━━━━━━━━━━━━━━━
📈 FVG Statistics & Probabilities
Based on ICT concepts and trader observations:
Gap Fill Rates:
• 70-80% of FVGs get filled eventually
• 60-70% show some reaction when filled
• 50% fill level has ~65% reversal rate
• Full fills have ~55% reversal rate
Timeframe Reliability:
• Daily FVGs: ~75-85% fill rate, strongest reactions
• 4H FVGs: ~70-80% fill rate, strong reactions
• 1H FVGs: ~65-75% fill rate, good reactions
• 15min FVGs: ~60-70% fill rate, moderate reactions
• 5min FVGs: ~55-65% fill rate, weaker reactions
Best Practices:
• First touch of gap = 65-70% win rate
• 50% fill = 65% win rate
• FVG + Order Block = 75-85% win rate
• Multi-timeframe aligned FVG = 70-80% win rate
• FVG in trending market = 60-70% win rate
Common Failures:
• Strong momentum blows through gaps (20-30% of time)
• Gaps in low-volume periods less reliable
• Very small gaps (<0.05%) often ignored
• Counter-trend gaps have lower success rate
━━━━━━━━━━━━━━━━━━━━━━━━━━━━
🙏 If You Find This Helpful
• ⭐ Leave your feedback
• 💬 Share your experience in the comments
• 🔔 Follow for updates and new tools
Questions about Fair Value Gaps? Feel free to ask in the comments.
━━━━━━━━━━━━━━━━━━━━━━━━━━━━
Version History
• v1.0 - Initial release with 3-candle FVG detection and real-time fill tracking

All Macro LevelsA comprehensive overlay indicator that displays key macro-level support and resistance zones using widely-followed moving averages across multiple timeframes.
Features
Bull Market Support Band (BMSB)
- Weekly 20 SMA and 21 EMA with customizable fill
- A popular indicator for identifying bull market trends - price holding above the band typically signals strength
Daily 12/21/25 EMA Bands
- Three daily EMAs (12, 21, 25) with fill between the outer bands
- Useful for tracking short-term momentum and trend direction
Long-Term Weekly Moving Averages
- 100-Week MA - Intermediate cycle support
- 200-Week MA - Major cycle support level
- 300-Week MA - Deep value zone
- Each MA can be configured as SMA or EMA
Customization
- Toggle each indicator group on/off independently
- Full color customization for lines, fills, and labels
- Adjustable line widths
- Optional custom symbol input to display levels from a different asset
- Real-time labels showing current values at chart edge
Use Cases
- Identify macro support/resistance levels
- Spot potential buy zones during corrections
- Confirm bull/bear market conditions
- Multi-timeframe analysis on a single chart

Quarter + 50 BandsThe indicator does two main things:
Draws a red quarter-point grid (every 25 points by default).
Draws green and blue “bands” that sit 50 points below and above each big 100-point figure.
Think of it like:
Red = your normal 25-point quarters
Green = “sweet spot” 50 points below each 100-pt handle
Blue = “sweet spot” 50 points above each 100-pt handle
It fully customizable.

Trend Trader//@version=6
indicator("Trend Trader", shorttitle="Trend Trader", overlay=true)
// User-defined input for moving averages
shortMA = input.int(10, minval=1, title="Short MA Period")
longMA = input.int(100, minval=1, title="Long MA Period")
// User-defined input for the instrument selection
instrument = input.string("US30", title="Select Instrument", options= )
// Set target values based on selected instrument
target_1 = instrument == "US30" ? 50 :
instrument == "NDX100" ? 25 :
instrument == "GER40" ? 25 :
instrument == "GOLD" ? 5 : 5 // default value
target_2 = instrument == "US30" ? 100 :
instrument == "NDX100" ? 50 :
instrument == "GER40" ? 50 :
instrument == "GOLD" ? 10 : 10 // default value
// User-defined input for the start and end times with default values
startTimeInput = input.int(12, title="Start Time for Session (UTC, in hours)", minval=0, maxval=23)
endTimeInput = input.int(17, title="End Time Session (UTC, in hours)", minval=0, maxval=23)
// Convert the input hours to minutes from midnight
startTime = startTimeInput * 60
endTime = endTimeInput * 60
// Function to convert the current exchange time to UTC time in minutes
toUTCTime(exchangeTime) =>
exchangeTimeInMinutes = exchangeTime / 60000
// Adjust for UTC time
utcTime = exchangeTimeInMinutes % 1440
utcTime
// Get the current time in UTC in minutes from midnight
utcTime = toUTCTime(time)
// Check if the current UTC time is within the allowed timeframe
isAllowedTime = (utcTime >= startTime and utcTime < endTime)
// Calculating moving averages
shortMAValue = ta.sma(close, shortMA)
longMAValue = ta.sma(close, longMA)
// Plotting the MAs
plot(shortMAValue, title="Short MA", color=color.blue)
plot(longMAValue, title="Long MA", color=color.red)
// MACD calculation for 15-minute chart
= request.security(syminfo.tickerid, "15", ta.macd(close, 12, 26, 9))
macdColor = macdLine > signalLine ? color.new(color.green, 70) : color.new(color.red, 70)
// Apply MACD color only during the allowed time range
bgcolor(isAllowedTime ? macdColor : na)
// Flags to track if a buy or sell signal has been triggered
var bool buyOnce = false
var bool sellOnce = false
// Tracking buy and sell entry prices
var float buyEntryPrice_1 = na
var float buyEntryPrice_2 = na
var float sellEntryPrice_1 = na
var float sellEntryPrice_2 = na
if not isAllowedTime
buyOnce :=false
sellOnce :=false
// Logic for Buy and Sell signals
buySignal = ta.crossover(shortMAValue, longMAValue) and isAllowedTime and macdLine > signalLine and not buyOnce
sellSignal = ta.crossunder(shortMAValue, longMAValue) and isAllowedTime and macdLine <= signalLine and not sellOnce
// Update last buy and sell signal values
if (buySignal)
buyEntryPrice_1 := close
buyEntryPrice_2 := close
buyOnce := true
if (sellSignal)
sellEntryPrice_1 := close
sellEntryPrice_2 := close
sellOnce := true
// Apply background color for entry candles
barcolor(buySignal or sellSignal ? color.yellow : na)
/// Creating buy and sell labels
if (buySignal)
label.new(bar_index, low, text="BUY", style=label.style_label_up, color=color.green, textcolor=color.white, yloc=yloc.belowbar)
if (sellSignal)
label.new(bar_index, high, text="SELL", style=label.style_label_down, color=color.red, textcolor=color.white, yloc=yloc.abovebar)
// Creating labels for 100-point movement
if (not na(buyEntryPrice_1) and close >= buyEntryPrice_1 + target_1)
label.new(bar_index, high, text=str.tostring(target_1), style=label.style_label_down, color=color.green, textcolor=color.white, yloc=yloc.abovebar)
buyEntryPrice_1 := na // Reset after label is created
if (not na(buyEntryPrice_2) and close >= buyEntryPrice_2 + target_2)
label.new(bar_index, high, text=str.tostring(target_2), style=label.style_label_down, color=color.green, textcolor=color.white, yloc=yloc.abovebar)
buyEntryPrice_2 := na // Reset after label is created
if (not na(sellEntryPrice_1) and close <= sellEntryPrice_1 - target_1)
label.new(bar_index, low, text=str.tostring(target_1), style=label.style_label_up, color=color.red, textcolor=color.white, yloc=yloc.belowbar)
sellEntryPrice_1 := na // Reset after label is created
if (not na(sellEntryPrice_2) and close <= sellEntryPrice_2 - target_2)
label.new(bar_index, low, text=str.tostring(target_2), style=label.style_label_up, color=color.red, textcolor=color.white, yloc=yloc.belowbar)
sellEntryPrice_2 := na // Reset after label is created

Macros+AMD [NW]Macros + AMD - Daily & Weekly Time-Based Analysis
Multi-timeframe AMD (Accumulation, Manipulation, Distribution) visualization with ICT Macro timing windows for time-based market analysis.
Overview
This indicator visualizes the AMD (Accumulation, Manipulation, Distribution) framework on both daily and weekly timeframes, combined with ICT Macro timing windows. It is designed as an educational tool to help traders study time-based market structure and algorithmic price delivery concepts.
The AMD model is based on the idea that markets move through distinct phases within each trading period:
Accumulation (A) - Initial range formation, liquidity building
Manipulation (M) - False moves to trap traders, liquidity sweeps
Distribution (D) - True directional move, price delivery to targets
What This Indicator Displays
Daily AMD Phases
Displays the intraday AMD cycle based on New York trading hours:
A Phase (Blue): 4:00 AM - 8:35 AM EST — Morning accumulation, Asian/London overlap
M Phase (Red): 8:35 AM - 11:25 AM EST — NY session manipulation, news events
D Phase (Green): 11:25 AM - 4:00 PM EST — Afternoon distribution and price delivery
Weekly AMD Phases
Displays the weekly AMD cycle from Monday to Monday:
A Phase: Monday 00:00 - Tuesday 21:56 EST — Weekly high/low formation begins
M Phase: Tuesday 21:56 - Thursday 02:04 EST — Mid-week reversal zone
D Phase: Thursday 02:04 - Monday 00:00 EST — Weekly price delivery
Inner M Phase Fibs
When enabled, subdivides the M (Manipulation) phase using Fibonacci levels:
0.382 level — Inner accumulation ends
0.500 level — Mid-point of manipulation
0.618 level — Inner distribution begins
This helps identify potential reversal points within the manipulation phase.
ICT Macro Windows
Horizontal lines marking the XX:42 to XX:15 macro periods (33-minute windows):
2:42 - 3:15 AM
3:42 - 4:15 AM (London)
7:42 - 8:15 AM
8:42 - 9:15 AM
9:42 - 10:15 AM (Prime AM session)
10:42 - 11:15 AM
11:42 - 12:15 PM
12:42 - 1:15 PM
1:42 - 2:15 PM
2:42 - 3:15 PM
These windows represent times when algorithmic price delivery is more likely to occur.
How To Use
Understanding the AMD Framework
During the A Phase:
Observe range formation and initial liquidity pools
Note the high and low established during this phase
Wait for manipulation before committing to direction
During the M Phase:
Watch for false breakouts and stop hunts
Look for reversal patterns after liquidity sweeps
The inner fibs (0.382, 0.5, 0.618) can help time entries within this phase
Mid-week (Wednesday) often sees key reversals on weekly AMD
During the D Phase:
This is typically when the true move occurs
Price tends to deliver toward draw on liquidity targets
The direction is often opposite to the manipulation move
Using the Macro Windows
The XX:42 to XX:15 windows are times to pay attention to price action:
These 33-minute periods often see increased algorithmic activity
Look for displacement, fair value gaps, or order blocks forming
The 9:42-10:15 AM window is considered particularly significant for NY session
Weekly Day Labels
Monday/Tuesday: "H/L of Week" — Watch for weekly high or low formation
Wednesday: "Reversal Day" — Mid-week reversal probability increases
Thursday/Friday: "Reversal Day" — Continuation or secondary reversal
Settings Guide
Main Settings
Timezone: Set to your broker's timezone or preferred timezone
Macros On Top: Toggle macro lines above or below AMD boxes
Show All Text Labels: Master toggle for all text (turn off for clean charts on HTF)
Daily/Weekly AMD
Show: Enable/disable the AMD visualization
Opacity: Adjust transparency of the phase boxes (higher = more transparent)
AMD Colors
Customize colors for each phase (A, M, D)
Default: Blue (A), Red (M), Green (D)
Inner M Style
Customize the inner M phase fib lines and text colors
Default: Black lines for clean visibility
Macro Settings
Adjust macro line color and thickness
Toggle individual macro windows on/off
Important Notes
This indicator is for educational purposes and time-based analysis
It does not provide buy/sell signals
Always use in conjunction with proper price action analysis
Past price behavior during these time windows does not guarantee future results
The AMD framework is one lens for viewing market structure — use it as part of a complete methodology
Credits
This indicator is based on concepts taught by ICT (Inner Circle Trader) and the broader Smart Money Concepts community. The AMD framework, macro timing windows, and weekly profile concepts are derived from this educational methodology.
Timeframe Recommendations
Best viewed on 1-minute to 15-minute charts
Text labels automatically hide on 9-minute and higher timeframes for cleaner visualization
Indicator hides completely on 1-hour and higher timeframes
Changelog
v1.0 - Initial release
Daily AMD phases (4am-4pm EST)
Weekly AMD phases (Monday-Monday)
Inner M phase Fibonacci subdivisions
10 ICT Macro timing windows
Full customization options
Automatic 9-day cleanup

ADX Forecast Colorful [DiFlip]ADX Forecast Colorful
Introducing one of the most advanced ADX indicators available — a fully customizable analytical tool that integrates forward-looking forecasting capabilities. ADX Forecast Colorful is a scientific evolution of the classic ADX, designed to anticipate future trend strength using linear regression. Instead of merely reacting to historical data, this indicator projects the future behavior of the ADX, giving traders a strategic edge in trend analysis.
⯁ Real-Time ADX Forecasting
For the first time, a public ADX indicator incorporates linear regression (least squares method) to forecast the future behavior of ADX. This breakthrough approach enables traders to anticipate trend strength changes based on historical momentum. By applying linear regression to the ADX, the indicator plots a projected trendline n periods ahead — helping users make more accurate and timely trading decisions.
⯁ Highly Customizable
The indicator adapts seamlessly to any trading style. It offers a total of 26 long entry conditions and 26 short entry conditions, making it one of the most configurable ADX tools on TradingView. Each condition is fully adjustable, enabling the creation of statistical, quantitative, and automated strategies. You maintain full control over the signals to align perfectly with your system.
⯁ Innovative and Science-Based
This is the first public ADX indicator to apply least-squares predictive modeling to ADX dynamics. Technically, it embeds machine learning logic into a traditional trend-strength indicator. Using linear regression as a predictive engine adds powerful statistical rigor to the ADX, turning it into an intelligent, forward-looking signal generator.
⯁ Scientific Foundation: Linear Regression
Linear regression is a fundamental method in statistics and machine learning used to model the relationship between a dependent variable y and one or more independent variables x. The basic formula for simple linear regression is:
y = β₀ + β₁x + ε
Where:
y = predicted value (e.g., future ADX)
x = explanatory variable (e.g., bar index or time)
β₀ = intercept
β₁ = slope (rate of change)
ε = random error term
The goal is to estimate β₀ and β₁ by minimizing the sum of squared errors. This is achieved using the least squares method, ensuring the best linear fit to historical data. Once the coefficients are calculated, the model extends the regression line forward, generating the ADX projection based on recent trends.
⯁ Least Squares Estimation
To minimize the error, the regression coefficients are calculated as:
β₁ = Σ((xᵢ - x̄)(yᵢ - ȳ)) / Σ((xᵢ - x̄)²)
β₀ = ȳ - β₁x̄
Where:
Σ = summation
x̄ and ȳ = means of x and y
i ranges from 1 to n (number of data points)
These formulas provide the best linear unbiased estimator under Gauss-Markov conditions — assuming constant variance and linearity.
⯁ Linear Regression in Machine Learning
Linear regression is a foundational algorithm in supervised learning. Its power in producing quantitative predictions makes it essential in AI systems, predictive analytics, time-series forecasting, and automated trading. Applying it to the ADX essentially places an intelligent forecasting engine inside a classic trend tool.
⯁ Visual Interpretation
Imagine an ADX time series like this:
Time →
ADX →
The regression line smooths these values and projects them n periods forward, creating a predictive trajectory. This forecasted ADX line can intersect with the actual ADX, offering smarter buy and sell signals.
⯁ Summary of Scientific Concepts
Linear Regression: Models variable relationships with a straight line.
Least Squares: Minimizes prediction errors for best fit.
Time-Series Forecasting: Predicts future values using historical data.
Supervised Learning: Trains models to predict outcomes from inputs.
Statistical Smoothing: Reduces noise and highlights underlying trends.
⯁ Why This Indicator Is Revolutionary
Scientifically grounded: Based on rigorous statistical theory.
Unprecedented: First public ADX using least-squares forecast modeling.
Smart: Uses machine learning logic.
Forward-Looking: Generates predictive, not just reactive, signals.
Customizable: Flexible for any strategy or timeframe.
⯁ Conclusion
By merging ADX and linear regression, this indicator enables traders to predict market momentum rather than merely follow it. ADX Forecast Colorful is not just another indicator — it’s a scientific leap forward in technical analysis. With 26 fully configurable entry conditions and smart forecasting, this open-source tool is built for creating cutting-edge quantitative strategies.
⯁ Example of simple linear regression with one independent variable
This example demonstrates how a basic linear regression works when there is only one independent variable influencing the dependent variable. This type of model is used to identify a direct relationship between two variables.
⯁ In linear regression, observations (red) are considered the result of random deviations (green) from an underlying relationship (blue) between a dependent variable (y) and an independent variable (x)
This concept illustrates that sampled data points rarely align perfectly with the true trend line. Instead, each observed point represents the combination of the true underlying relationship and a random error component.
⯁ Visualizing heteroscedasticity in a scatterplot with 100 random fitted values using Matlab
Heteroscedasticity occurs when the variance of the errors is not constant across the range of fitted values. This visualization highlights how the spread of data can change unpredictably, which is an important factor in evaluating the validity of regression models.
⯁ The datasets in Anscombe’s quartet were designed to have nearly the same linear regression line (as well as nearly identical means, standard deviations, and correlations) but look very different when plotted
This classic example shows that summary statistics alone can be misleading. Even with identical numerical metrics, the datasets display completely different patterns, emphasizing the importance of visual inspection when interpreting a model.
⯁ Result of fitting a set of data points with a quadratic function
This example illustrates how a second-degree polynomial model can better fit certain datasets that do not follow a linear trend. The resulting curve reflects the true shape of the data more accurately than a straight line.
⯁ What is the ADX?
The Average Directional Index (ADX) is a technical analysis indicator developed by J. Welles Wilder. It measures the strength of a trend in a market, regardless of whether the trend is up or down.
The ADX is an integral part of the Directional Movement System, which also includes the Plus Directional Indicator (+DI) and the Minus Directional Indicator (-DI). By combining these components, the ADX provides a comprehensive view of market trend strength.
⯁ How to use the ADX?
The ADX is calculated based on the moving average of the price range expansion over a specified period (usually 14 periods). It is plotted on a scale from 0 to 100 and has three main zones:
Strong Trend: When the ADX is above 25, indicating a strong trend.
Weak Trend: When the ADX is below 20, indicating a weak or non-existent trend.
Neutral Zone: Between 20 and 25, where the trend strength is unclear.
⯁ Entry Conditions
Each condition below is fully configurable and can be combined to build precise trading logic.
📈 BUY
🅰️ Signal Validity: The signal will remain valid for X bars .
🅰️ Signal Sequence: Configurable as AND or OR .
🅰️ +DI > -DI
🅰️ +DI < -DI
🅰️ +DI > ADX
🅰️ +DI < ADX
🅰️ -DI > ADX
🅰️ -DI < ADX
🅰️ ADX > Threshold
🅰️ ADX < Threshold
🅰️ +DI > Threshold
🅰️ +DI < Threshold
🅰️ -DI > Threshold
🅰️ -DI < Threshold
🅰️ +DI (Crossover) -DI
🅰️ +DI (Crossunder) -DI
🅰️ +DI (Crossover) ADX
🅰️ +DI (Crossunder) ADX
🅰️ +DI (Crossover) Threshold
🅰️ +DI (Crossunder) Threshold
🅰️ -DI (Crossover) ADX
🅰️ -DI (Crossunder) ADX
🅰️ -DI (Crossover) Threshold
🅰️ -DI (Crossunder) Threshold
🔮 +DI (Crossover) -DI Forecast
🔮 +DI (Crossunder) -DI Forecast
🔮 ADX (Crossover) +DI Forecast
🔮 ADX (Crossunder) +DI Forecast
📉 SELL
🅰️ Signal Validity: The signal will remain valid for X bars .
🅰️ Signal Sequence: Configurable as AND or OR .
🅰️ +DI > -DI
🅰️ +DI < -DI
🅰️ +DI > ADX
🅰️ +DI < ADX
🅰️ -DI > ADX
🅰️ -DI < ADX
🅰️ ADX > Threshold
🅰️ ADX < Threshold
🅰️ +DI > Threshold
🅰️ +DI < Threshold
🅰️ -DI > Threshold
🅰️ -DI < Threshold
🅰️ +DI (Crossover) -DI
🅰️ +DI (Crossunder) -DI
🅰️ +DI (Crossover) ADX
🅰️ +DI (Crossunder) ADX
🅰️ +DI (Crossover) Threshold
🅰️ +DI (Crossunder) Threshold
🅰️ -DI (Crossover) ADX
🅰️ -DI (Crossunder) ADX
🅰️ -DI (Crossover) Threshold
🅰️ -DI (Crossunder) Threshold
🔮 +DI (Crossover) -DI Forecast
🔮 +DI (Crossunder) -DI Forecast
🔮 ADX (Crossover) +DI Forecast
🔮 ADX (Crossunder) +DI Forecast
🤖 Automation
All BUY and SELL conditions are compatible with TradingView alerts, making them ideal for fully or semi-automated systems.
⯁ Unique Features
Linear Regression: (Forecast)
Signal Validity: The signal will remain valid for X bars
Signal Sequence: Configurable as AND/OR
Condition Table: BUY/SELL
Condition Labels: BUY/SELL
Plot Labels in the Graph Above: BUY/SELL
Automate and Monitor Signals/Alerts: BUY/SELL
Background Colors: "bgcolor"
Background Colors: "fill"
Linear Regression (Forecast)
Signal Validity: The signal will remain valid for X bars
Signal Sequence: Configurable as AND/OR
Table of Conditions: BUY/SELL
Conditions Label: BUY/SELL
Plot Labels in the graph above: BUY/SELL
Automate & Monitor Signals/Alerts: BUY/SELL
Background Colors: "bgcolor"
Background Colors: "fill"

Trend Breakout & Ratchet Stop System [Market Filter]Description:
This strategy implements a robust trend-following system designed to capture momentum moves while strictly managing downside risk through a multi-stage "Ratchet" exit mechanism and broad market filters.
It is designed for swing traders who want to align individual stock entries with the overall market direction.
How it works:
1. Market Regime Filters (The "Safety Check") Before taking any position, the strategy checks the health of the broader market to avoid "catching falling knives."
Broad Market Filter: By default, it checks NASDAQ:QQQ (adjustable). If the benchmark is trading below its SMA 200, the strategy assumes a Bear Market and suppresses all new long entries.
Volatility Filter (VIX): Uses CBOE:VIX to gauge fear. If the VIX is above a specific threshold (Default: 32), entries are paused, and existing positions can optionally be closed to preserve capital.
2. Entry Logic Entries are based on Momentum and Trend confirmation. A position is opened if filters are clear AND one of the following occurs:
Golden Cross: SMA 25 crosses over SMA 50.
SMA Breakouts: A "Three-Bar-Break" logic confirms a breakout above the SMA 50, 100, or 200 (price must establish itself above the moving average).
3. The "Ratchet" Exit System The exit logic evolves as the trade progresses, tightening risk like a ratchet:
Stage 0 (Initial Risk): Starts with a standard percentage Stop Loss from the entry price.
Stage 1 (Breakeven/Lock): Once the price rises by Profit Step 1 (e.g., +10%), the Stop Loss jumps to a tighter level and locks there. This secures the initial move.
Stage 2 (Trailing Mode): If the price continues to rise to Profit Step 2 (e.g., +15%), the Stop Loss converts into a dynamic Trailing Stop relative to the Highest High. This allows the trade to run as long as the trend persists.
Additional Exits:
Dead Cross: Closes position if SMA 25 crosses under SMA 50.
VIX Panic: Emergency exit if volatility spikes above the threshold.
Settings & Customization:
SMAs: Adjustable lengths for all Moving Averages.
Filters: Toggle Market/VIX filters on/off and choose your benchmark ticker (e.g., SPY or QQQ).
Risk Management: Fully customizable percentages for the Ratchet steps (Initial SL, Stage 1 Trigger, Trailing distance).

Ratchet Exit Trend Strategy with VIX FilterThis strategy is a trend-following system designed specifically for volatile markets. Instead of focusing solely on the "perfect entry," this script emphasizes intelligent trade management using a custom **"Ratchet Exit System."**
Additionally, it integrates a volatility filter based on the CBOE Volatility Index (VIX) to minimize risk during extreme market phases.
### 🎯 The Concept: Ratchet Exit
The "Ratchet" system operates like a mechanical ratchet tool: the Stop Loss can only move in one direction (up, for long trades) and "locks" into specific stages. The goal is to give the trade "room to breathe" initially to avoid being stopped out by noise, then aggressively reduce risk as the trade moves into profit.
The exit logic moves through 3 distinct phases:
1. **Phase 0 (Initial Risk):** At the start of the trade, a wide Stop Loss is set (Default: 10%) to tolerate normal market volatility.
2. **Phase 1 (Risk Reduction):** Once the trade reaches a specific floating profit (Default: +10%), the Stop Loss is raised and "pinned" to a fixed value (Default: -8% from entry). This drastically reduces risk while keeping the trade alive.
3. **Phase 2 (Trailing Mode):** If the trend extends to a higher profit zone (Default: +15%), the Stop switches to a dynamic Trailing Mode. It follows the **Highest High** at a fixed percentage distance (Default: 8%).
### 🛡️ VIX Filter & Panic Exit
High volatility is often the enemy of trend-following strategies.
* **Entry Filter:** The system will not enter new positions if the VIX is above a user-defined threshold (Default: 32). This helps avoid entering "falling knife" markets.
* **Panic Exit:** If the VIX spikes above the threshold (32) while a trade is open, the position is closed immediately to protect capital (Emergency Exit).
### 📈 Entry Signals
The strategy trades **LONG only** and uses Simple Moving Averages (SMAs) to identify trends:
* **Golden Cross:** SMA 25 crosses over SMA 50.
* **3-Bar Breakouts:** A confirmation logic where the price must close above the SMA 50, 100, or 200 for 3 consecutive bars.
### ⚙️ Settings (Inputs)
All parameters are fully customizable via the settings menu:
* **SMAs:** Lengths for the trend indicators (Default: 25, 50, 100, 200).
* **VIX Filter:** Toggle the filter on/off and adjust the panic threshold.
* **Ratchet Settings:** Percentages for Initial Stop, Trigger Levels for Stages 1 & 2, and the Trailing Distance.
### ⚠️ Technical Note & Risk Warning
This script uses `request.security` to fetch VIX data. Please ensure you understand the risks associated with trading leveraged or volatile assets. Past performance is not indicative of future results.

EMA 7/21 + SuperTrend INDICADOR CREADO PARA MI ESTRATEGIA That sounds like a complex and multi-layered trading indicator you've developed! Combining an Exponential Moving Average (EMA) crossover with an Average Directional Index (ADX) filter, a Volume filter, and a Supertrend for overall trend confirmation can certainly help to filter out false signals and potentially increase the reliability of your entry and exit points.Here's a breakdown of the components you're using and why this combination can be powerful:📊 Indicator Components and Their Roles1. 7/21 EMA Crossover (Signal Generator)The $7$-period EMA and $21$-period EMA crossover is a common strategy used to generate initial buy or sell signals.Buy Signal: The short-term EMA (7) crosses above the long-term EMA (21).Sell Signal: The short-term EMA (7) crosses below the long-term EMA (21).2. ADX DI Filter (Momentum and Direction)The Average Directional Index (ADX) and its directional indicators ($+DI$ and $-DI$) are key to confirming the strength and direction of the move.Directional Confirmation: The EMA crossover must be confirmed by the appropriate directional index. For a buy, the $+DI$ should be above the $-DI$. For a sell, the $-DI$ should be above the $+DI$.Trend Strength ( NYSE:ADX $): A rising NYSE:ADX $ (typically above 20 or 25) suggests the current trend has sufficient momentum, making the signal more reliable.3. Volume Filter (Conviction)Adding a Volume filter ensures that the price movement accompanying the EMA crossover is supported by significant trading activity.Confirmation: A strong signal (buy or sell) is often accompanied by above-average volume. This suggests that market participants are actively supporting the move, adding conviction to the trade.4. Supertrend (Overall Trend Confirmation)The Supertrend indicator is based on the Average True Range (ATR) and is excellent for identifying the dominant market trend.Trend Alignment: The EMA crossover signal should align with the Supertrend's current signal. For a buy signal, the price should be above the Supertrend line (green). For a sell signal, the price should be below the Supertrend line (red). This helps ensure you are trading with the prevailing trend.📈 Why This is a Powerful CombinationYour indicator is essentially a multi-stage confirmation system:Speed (7/21 EMA): Generates a fast, responsive signal.Momentum (ADX DI): Confirms the direction and strength of the signal.Conviction (Volume): Validates the signal with market participation.Safety/Trend (Supertrend): Ensures the trade is in the direction of the long-term trend.The Informative Panel is a great feature, as it simplifies the decision-making process by summarizing the findings of all these components—e.g., "BUY: EMA Crossover $\checkmark$, +DI > -DI $\checkmark$, High Volume $\checkmark$, Supertrend Green $\checkmark$."💡 Next Steps for RefinementTo finalize and test this indicator, you may want to consider:Parameter Optimization: The best settings for the ADX level (e.g., 20 vs. 25) and the Supertrend ATR parameters may need to be optimized for the specific asset (e.g., stocks, forex) and timeframe you are using.Exit Strategy: Since this primarily focuses on entries, define clear Stop-Loss (perhaps based on the Supertrend line or a recent swing low/high) and Take-Profit (e.g., a fixed Risk/Reward ratio or previous resistance/support levels) rules.Would you like to explore specific parameters for any of these components or look into ways to backtest your strategy?

Dynamic Support and Resistance with Trend LinesDynamic Support and Resistance with Trend Lines (DSRTL)
1. Introduction & Methodology
The DSRTL indicator is designed to provide a multidimensional analysis of market structure. Unlike traditional tools that rely solely on price pivots, this script combines Static Volume-based Zones with Dynamic Trend Lines to evaluate the price's position relative to critical market components.
The S/R Identification Technique
Instead of standard pivot points, DSRTL utilizes Volume Analysis to highlight areas of significant trader participation:
- Strategy A:
Matrix Climax: Identifies candles within the lookback period that are near price extremes (Highs/Lows) and coincide with significant buying or selling volume.
- Strategy B:
Volume Extremes: Detects candles with the absolute highest buy/sell volumes within the selected lookback window, creating extreme volume-based S/R zones.
- Result:
This creates Support/Resistance (S/R) zones that are validated by actual market activity, not just price geometry.
Dynamic Trend Lines
To complement the static zones, the indicator employs two adaptive channel methods:
- Pivot Span: Connects recent significant pivots for a fast, reactive trend corridor.
- 5-Point Channel: Segments the lookback period into 5 parts to perform a linear regression analysis, creating a stable and statistically significant channel.
2. Volume Calculation Methodology
Accurate S/R detection requires distinguishing Buy Volume from Sell Volume. DSRTL offers two calculation modes:
- Geometry (Source File): Estimates buy/sell volume based on the Close price's position relative to the High/Low of the candle.
Note: This is an approximation that works on all plan types as it does not require intrabar data.
- Intrabar (Precise): Analyzes historical lower-timeframe data (e.g., 15S) to calculate intrabar-based volume deltas with higher precision compared to the geometric method.
Note: This offers superior accuracy. It requires access to historical intrabar data (depending on your plan limits). For the best analytical results, use this mode if available.
3. The Smart Matrix Engine (3D Analysis)
The core of DSRTL is its dashboard, powered by the "Smart Matrix Engine." This engine evaluates the current price in a multi-layer market structure context (Static Volume Zones + Dynamic Channels + Volume Metrics).:
A. S-State (Static): Where is the price relative to the Volume S/R zones?
B. D-State (Dynamic): Where is the price relative to the Trend Channels?
How to read the Matrix Map:
The dashboard displays a 5x5 grid representing 25 possible market scenarios.
- Rows (S1-S5): Represent the Static State (S1=Breakout, S3=Mid-Range, S5=Breakdown).
- Columns (D1-D5): Represent the Dynamic State (D1=Overextended Up, D3=Neutral, D5=Overextended Down).
- Active Cell: Marked with a dot, indicating the specific intersection of price action and market structure.
4. Matrix Interpretations (The 25 Scenarios)
Below is the detailed logic for every possible state displayed on the dashboard, explaining the Title, Bias, and actionable Signal.
Section I: S1 - Static Breakout (Price > Static Resistance)
The price has cleared the static volume resistance zone.
- S1 / D1: HYPER EXTENSION
Bias: Extreme Bullish
Signal: Caution: Exhaustion Risk. Trail stops tight.
- S1 / D2: RESISTANCE CLASH
Bias: Bullish
Signal: Breakout confirmed but facing immediate dynamic resistance.
- S1 / D3: CHANNEL BREAKOUT
Bias: Strong Bullish
Signal: Ideal Trend Continuation. Look to buy dips.
- S1 / D4: SMART PULLBACK
Bias: Bullish (Pullback)
Signal: A pullback occurring after a breakout. Strong buy opportunity.
- S1 / D5: CONFLICT (DIV)
Bias: Conflict/Reversal
Signal: Major Divergence. Static breakout is failing against dynamic structure. High Risk.
Section II: S2 - Inside Static Resistance
The price is currently testing the overhead resistance zone.
- S2 / D1: WEAK SPIKE
Bias: Neutral/Bullish
Signal: Testing resistance, but short-term overextended.
- S2 / D2: IRON FORTRESS (R)
Bias: Rejection Risk
Signal: Double Resistance (Static + Dynamic). High probability of rejection.
- S2 / D3: TESTING RES
Bias: Neutral
Signal: Consolidating at resistance. Wait for a clear break or rejection.
- S2 / D4: COMPRESSION (UP)
Bias: Conflict (Squeeze)
Signal: Squeezed between Static Resistance and Dynamic Support. Volatility imminent.
- S2 / D5: RES vs DOWN-TREND
Bias: Bearish
Signal: Strong downtrend meeting static resistance. Potential Short entry.
Section III: S3 - Mid-Range
The price is floating between significant Static Support and Resistance.
- S3 / D1: OVERBOUGHT RANGE
Bias: Rejection Risk (OB)
Signal: Overextended within the range. Potential fade (short).
- S3 / D2: RANGE HIGH LIMIT
Bias: Neutral/Bearish
Signal: At the top of the dynamic channel. Look for rejection signs.
- S3 / D3: NEUTRAL / CHOPPY
Bias: Neutral
Signal: Dead Center. Low probability environment. Avoid trading.
- S3 / D4: RANGE DIP BUY
Bias: Neutral/Bullish
Signal: At the bottom of the dynamic channel. Look for bounce signs.
- S3 / D5: WEAK RANGE (OS)
Bias: Bounce Risk (OS)
Signal: Oversold within the range. Potential fade (long).
Section IV: S4 - Inside Static Support
The price is currently testing the floor support zone.
- S4 / D1: SUP vs UP-TREND
Bias: Bullish
Signal: Strong uptrend meeting static support. Potential Long entry.
- S4 / D2: COMPRESSION (DN)
Bias: Conflict (Squeeze)
Signal: Squeezed between Static Support and Dynamic Resistance. Volatility imminent.
- S4 / D3: TESTING SUPPORT
Bias: Neutral
Signal: Consolidating at support. Wait for a bounce or breakdown.
- S4 / D4: IRON FLOOR (S)
Bias: Bounce Risk
Signal: Double Support (Static + Dynamic). High probability of a bounce.
- S4 / D5: WEAK DIP
Bias: Neutral/Bearish
Signal: Testing support, but short-term oversold.
Section V: S5 - Static Breakdown (Price < Static Support)
The price has dropped below the static volume support zone.
- S5 / D1: CONFLICT (DIV)
Bias: Conflict/Reversal
Signal: Major Divergence. Static breakdown is failing. High Risk.
- S5 / D2: BEAR PULLBACK
Bias: Bearish (Pullback)
Signal: A pullback occurring after a breakdown. Strong selling opportunity.
- S5 / D3: CHANNEL BREAKDOWN
Bias: Strong Bearish
Signal: Ideal Trend Continuation (Down). Sell rallies.
- S5 / D4: SUPPORT CLASH
Bias: Bearish
Signal: Breakdown confirmed but facing immediate dynamic support.
- S5 / D5: HYPER DROP (VOID)
Bias: Extreme Bearish
Signal: Caution: Climax risk. Trail stops for shorts.
DISCLAIMER & EDUCATIONAL PURPOSE
This indicator is strictly an educational tool designed to visualize complex market structure concepts. Its primary purpose is to help traders "bridge the gap" between academic theory and real-time market behavior by providing a visual representation of support, resistance, and volume dynamics.
Please Note:
1. Not a Trading Strategy: This script is an analytical assistant, not a standalone "Black Box" trading system. It does not generate buy or sell signals that should be followed blindly.
2. No Financial Advice: The data provided by this tool is for informational purposes only. It is not a recommendation to buy or sell any asset.
3. Risk Warning: Trading involves significant risk. Always use your own judgment, perform your own technical analysis, and use proper risk management. Do not use this tool as the sole basis for your trading decisions.
4. Data Precision & Platform Limits: The "Intrabar (Precise)" calculation mode relies on high-resolution historical data to provide exact results. Access to this specific data depth depends entirely on your platform's subscription capabilities. If your plan does not support this level of historical intrabar data, the Precise mode may have limited coverage. In that case, you should switch to "Geometry" mode for a fully populated view.

ADX HUD LabelStatic ADX Strength Label
Drops a fixed label in the top-right corner of your chart that only tells you one thing: is the trend worth trading or not.
The label constantly updates the current ADX value and changes color: red below 20 (dead / choppy), yellow between 20–25 (warming up), and green above 25 (strong trend, go hunting).
Use it as a quick trend-filter so you’re not forcing trades when the market is caca chop.

VIX Counter-Trend StrategyVIX Panic Index VOO Bottom-Fishing Strategy
📊 Strategy Overview
This strategy utilizes the VIX (Volatility Index) as a market sentiment indicator to help investors rationally enter positions during periods of extreme market panic, using objective technical signals to avoid emotional decision-making. It is designed to capture rebound opportunities in VOO (or other US equity ETFs) following panic-driven selloffs.
🎯 Entry and Exit Conditions
Entry Conditions (both must be met):
VIX reaches or exceeds the set threshold (default 25, adjustable)
VIX death crosses below its moving average (default 5-day MA), confirming panic sentiment is beginning to recede
Exit Conditions (three modes available):
Holding Period Mode: Exit after holding for the set number of days (default 100 days)
VIX Decline Mode: Exit when VIX falls below the set threshold (default 20)
Either Condition Mode: Exit when either condition is met
⚠️ Important Warnings
Not Suitable for Leveraged ETF Bottom-Fishing: VIX reflects market volatility. Using leveraged ETFs (such as TQQQ, SOXL) increases risk due to decay effects and greater volatility, potentially causing larger losses during panic periods.
Bear Market Inaccuracy Risk: This strategy assumes markets will rebound from panic. However, during prolonged bear markets or systemic risks (such as the 2008 financial crisis or 2022 rate hike cycle), VIX may remain elevated for extended periods, triggering multiple buy signals while prices continue declining, rendering the strategy ineffective.
Recommended to Combine with Market Trend Analysis: Works better in bull market conditions. In bear markets, consider raising VIX thresholds or suspending use.
For Reference Only, Not Investment Advice: Historical performance does not guarantee future results. Please use cautiously according to your personal risk tolerance.
VIX 恐慌指數 VOO 抄底策略
📊 策略目的
本策略利用 VIX 恐慌指數作為市場情緒指標,幫助投資人在市場極度恐慌時理性進場抄底,並透過客觀的技術訊號避免情緒化操作。適合用於捕捉 VOO(或其他美股 ETF)在恐慌性下跌後的反彈機會。
🎯 進出場條件
進場條件(同時滿足):
VIX 指數達到設定門檻以上(預設 25,可調整)
VIX 死亡交叉其均線(預設 5 日均線),確認恐慌情緒開始回落
出場條件(三種模式可選):
持有天數模式:持有達到設定天數後出場(預設 100 天)
VIX 回落模式:VIX 降至設定門檻以下時出場(預設 20)
兩者皆可模式:任一條件滿足即出場
⚠️ 重要警語
不適合槓桿型 ETF 抄底:VIX 反映的是市場波動度,使用槓桿 ETF(如 TQQQ、SOXL)會因為衰減效應和更大波動而增加風險,可能在恐慌期間造成更大虧損。
空頭市場失準風險:本策略假設市場會從恐慌中反彈,但在長期空頭或系統性風險(如 2008 金融危機、2022 升息循環)中,VIX 可能長期處於高檔,多次觸發買入訊號卻持續下跌,導致策略失效。
建議搭配大盤趨勢判斷:在多頭格局中使用效果較佳,空頭格局建議提高 VIX 門檻或暫停使用。
僅供參考,非投資建議:歷史績效不代表未來表現,請依個人風險承受度謹慎使用。

Frequency Momentum Oscillator [QuantAlgo]🟢 Overview
The Frequency Momentum Oscillator applies Fourier-based spectral analysis principles to price action to identify regime shifts and directional momentum. It calculates Fourier coefficients for selected harmonic frequencies on detrended price data, then measures the distribution of power across low, mid, and high frequency bands to distinguish between persistent directional trends and transient market noise. This approach provides traders with a quantitative framework for assessing whether current price action represents meaningful momentum or merely random fluctuations, enabling more informed entry and exit decisions across various asset classes and timeframes.
🟢 How It Works
The calculation process removes the dominant trend from price data by subtracting a simple moving average, isolating cyclical components for frequency analysis:
detrendedPrice = close - ta.sma(close , frequencyPeriod)
The detrended price series undergoes frequency decomposition through Fourier coefficient calculation across the first 8 harmonics. For each harmonic frequency, the algorithm computes sine and cosine components across the lookback window, then derives power as the sum of squared coefficients:
for k = 1 to 8
cosSum = 0.0
sinSum = 0.0
for n = 0 to frequencyPeriod - 1
angle = 2 * math.pi * k * n / frequencyPeriod
cosSum := cosSum + detrendedPrice * math.cos(angle)
sinSum := sinSum + detrendedPrice * math.sin(angle)
power = (cosSum * cosSum + sinSum * sinSum) / frequencyPeriod
Power measurements are aggregated into three frequency bands: low frequencies (harmonics 1-2) capturing persistent cycles, mid frequencies (harmonics 3-4), and high frequencies (harmonics 5-8) representing noise. Each band's power normalizes against total spectral power to create percentage distributions:
lowFreqNorm = totalPower > 0 ? (lowFreqPower / totalPower) * 100 : 33.33
highFreqNorm = totalPower > 0 ? (highFreqPower / totalPower) * 100 : 33.33
The normalized frequency components undergo exponential smoothing before calculating spectral balance as the difference between low and high frequency power:
smoothLow = ta.ema(lowFreqNorm, smoothingPeriod)
smoothHigh = ta.ema(highFreqNorm, smoothingPeriod)
spectralBalance = smoothLow - smoothHigh
Spectral balance combines with price momentum through directional multiplication, producing a composite signal that integrates frequency characteristics with price direction:
momentum = ta.change(close , frequencyPeriod/2)
compositeSignal = spectralBalance * math.sign(momentum)
finalSignal = ta.ema(compositeSignal, smoothingPeriod)
The final signal oscillates around zero, with positive values indicating low-frequency dominance coupled with upward momentum (trending up), and negative values indicating either high-frequency dominance (choppy market) or downward momentum (trending down).
🟢 How to Use This Indicator
→ Long/Short Signals: the indicator generates long signals when the smoothed composite signal crosses above zero (indicating low-frequency directional strength dominates) and short signals when it crosses below zero (indicating bearish momentum persistence).
→ Upper and Lower Reference Lines: the +25 and -25 reference lines serve as threshold markers for momentum strength. Readings beyond these levels indicate strong directional conviction, while oscillations between them suggest consolidation or weakening momentum. These references help traders distinguish between strong trending regimes and choppy transitional periods.
→ Preconfigured Presets: three optimized configurations are available with Default (32, 3) offering balanced responsiveness, Fast Response (24, 2) designed for scalping and intraday trading, and Smooth Trend (40, 5) calibrated for swing trading and position trading with enhanced noise filtration.
→ Built-in Alerts: the indicator includes three alert conditions for automated monitoring - Long Signal (momentum shifts bullish), Short Signal (momentum shifts bearish), and Signal Change (any directional transition). These alerts enable traders to receive real-time notifications without continuous chart monitoring.
→ Color Customization: four visual themes (Classic green/red, Aqua blue/orange, Cosmic aqua/purple, Custom) allow chart customization for different display environments and personal preferences.
