Live Market - Performance MonitorLive Market — Performance Monitor
Study material (no code) — step-by-step training guide for learners
________________________________________
1) What this tool is — short overview
This indicator is a live market performance monitor designed for learning. It scans price, volume and volatility, detects order blocks and trendline events, applies filters (volume & ATR), generates trade signals (BUY/SELL), creates simple TP/SL trade management, and renders a compact dashboard summarizing market state, risk and performance metrics.
Use it to learn how multi-factor signals are constructed, how Greeks-style sensitivity is replaced by volatility/ATR reasoning, and how a live dashboard helps monitor trade quality.
________________________________________
2) Quick start — how a learner uses it (step-by-step)
1. Add the indicator to a chart (any ticker / timeframe).
2. Open inputs and review the main groups: Order Block, Trendline, Signal Filters, Display.
3. Start with defaults (OB periods ≈ 7, ATR multiplier 0.5, volume threshold 1.2) and observe the dashboard on the last bar.
4. Walk the chart back in time (use the last-bar update behavior) and watch how signals, order blocks, trendlines, and the performance counters change.
5. Run the hands-on labs below to build intuition.
________________________________________
3) Main configurable inputs (what you can tweak)
• Order Block Relevant Periods (default ~7): number of consecutive candles used to define an order block.
• Min. Percent Move for Valid OB (threshold): minimum percent move required for a valid order block.
• Number of OB Channels: how many past order block lines to keep visible.
• Trendline Period (tl_period): pivot lookback for detecting highs/lows used to draw trendlines.
• Use Wicks for Trendlines: whether pivot uses wicks or body.
• Extension Bars: how far trendlines are projected forward.
• Use Volume Filter + Volume Threshold Multiplier (e.g., 1.2): requires volume to be greater than multiplier × average volume.
• Use ATR Filter + ATR Multiplier: require bar range > ATR × multiplier to filter noise.
• Show Targets / Table settings / Colors for visualization.
________________________________________
4) Core building blocks — what the script computes (plain language)
Price & trend:
• Spot / LTP: current close price.
• EMA 9 / 21 / 50: fast, medium, slow moving averages to define short/medium trend.
o trend_bullish: EMA9 > EMA21 > EMA50
o trend_bearish: EMA9 < EMA21 < EMA50
o trend_neutral: otherwise
Volatility & noise:
• ATR (14): average true range used for dynamic target and filter sizing.
• dynamic_zone = ATR × atr_multiplier: minimum bar range required for meaningful move.
• Annualized volatility: stdev of price changes × sqrt(252) × 100 — used to classify volatility (HIGH/MEDIUM/LOW).
Momentum & oscillators:
• RSI 14: overbought/oversold indicator (thresholds 70/30).
• MACD: EMA(12)-EMA(26) and a 9-period signal line; histogram used for momentum direction and strength.
• Momentum (ta.mom 10): raw momentum over 10 bars.
Mean reversion / band context:
• Bollinger Bands (20, 2σ): upper, mid, lower.
o price_position measures where price sits inside the band range as 0–100.
Volume metrics:
• avg_volume = SMA(volume, 20) and volume_spike = volume > avg_volume × volume_threshold
o volume_ratio = volume / avg_volume
Support & Resistance:
• support_level = lowest low over 20 bars
• resistance_level = highest high over 20 bars
• current_position = percent of price between support & resistance (0–100)
________________________________________
5) Order Block detection — concept & logic
What it tries to find: a bar (the base) followed by N candles in the opposite direction (a classical order block setup), with a minimum % move to qualify. The script records the high/low of the base candle, averages them, and plots those levels as OB channels.
How learners should think about it (conceptual):
1. An order block is a signature area where institutions (theory) left liquidity — often seen as a large bar followed by a sequence of directional candles.
2. This indicator uses a configurable number of subsequent candles to confirm that the pattern exists.
3. When found, it stores and displays the base candle’s high/low area so students can see how price later reacts to those zones.
Implementation note for learners: the tool keeps a limited history of OB lines (ob_channels). When new OBs exceed the count, the oldest lines are removed — good practice to avoid clutter.
________________________________________
6) Trendline detection — idea & interpretation
• The script finds pivot highs and lows using a symmetric lookback (tl_period and half that as right/left).
• It then computes a trendline slope from successive pivots and projects the line forward (extension_bars).
• Break detection: Resistance break = close crosses above the projected resistance line; Support break = close crosses below projected support.
Learning tip: trendlines here are computed from pivot points and time. Watch how changing tl_period (bigger = smoother, fewer pivots) alters the trendlines and break signals.
________________________________________
7) Signal generation & filters — step-by-step
1. Primary triggers:
o Bullish trigger: order block bullish OR resistance trendline break.
o Bearish trigger: bearish order block OR support trendline break.
2. Filters applied (both must pass unless disabled):
o Volume filter: volume must be > avg_volume × volume_threshold.
o ATR filter: bar range (high-low) must exceed ATR × atr_multiplier.
o Not in an existing trade: new trades only start if trade_active is false.
3. Trend confirmation:
o The primary trigger is only confirmed if trend is bullish/neutral for buys or bearish/neutral for sells (EMA alignment).
4. Result:
o When confirmed, a long or short trade is activated with TP/SL calculated from ATR multiples.
________________________________________
8) Trade management — what the tool does after a signal
• Entry management: the script marks a trade as trade_active and sets long_trade or short_trade flags.
• TP & SL rules:
o Long: TP = high + 2×ATR ; SL = low − 1×ATR
o Short: TP = low − 2×ATR ; SL = high + 1×ATR
• Monitoring & exit:
o A trade closes when price reaches TP or SL.
o When TP/SL hit, the indicator updates win_count and total_pnl using a very simple calculation (difference between TP/SL and previous close).
o Visual lines/labels are drawn for TP and updated as the trade runs.
Important learner notes:
• The script does not store a true entry price (it uses close in its P&L math), so PnL is an approximation — treat this as a learning proxy, not a position accounting system.
• There’s no sizing, slippage, or fee accounted — students must manually factor these when translating to real trades.
• This indicator is not a backtesting strategy; strategy.* functions would be needed for rigorous backtest results.
________________________________________
9) Signal strength & helper utilities
• Signal strength is a composite score (0–100) made up of four signals worth 25 points each:
1. RSI extreme (overbought/oversold) → 25
2. Volume spike → 25
3. MACD histogram magnitude increasing → 25
4. Trend existence (bull or bear) → 25
• Progress bars (text glyphs) are used to visually show RSI and signal strength on the table.
Learning point: composite scoring is a way to combine orthogonal signals — study how changing weights changes outcomes.
________________________________________
10) Dashboard — how to read each section (walkthrough)
The dashboard is split into sections; here's how to interpret them:
1. Market Overview
o LTP / Change%: immediate price & daily % change.
2. RSI & MACD
o RSI value plus progress bar (overbought 70 / oversold 30).
o MACD histogram sign indicates bullish/bearish momentum.
3. Volume Analysis
o Volume ratio (current / average) and whether there’s a spike.
4. Order Block Status
o Buy OB / Sell OB: the average base price of detected order blocks or “No Signal.”
5. Signal Status
o 🔼 BUY or 🔽 SELL if confirmed, or ⚪ WAIT.
o No-trade vs Active indicator summarizing market readiness.
6. Trend Analysis
o Trend direction (from EMAs), market sentiment score (composite), volatility level and band/position metrics.
7. Performance
o Win Rate = wins / signals (percentage)
o Total PnL = cumulative PnL (approximate)
o Bull / Bear Volume = accumulated volumes attributable to signals
8. Support & Resistance
o 20-bar highest/lowest — use as nearby reference points.
9. Risk & R:R
o Risk Level from ATR/price as a percent.
o R:R Ratio computed from TP/SL if a trade is active.
10. Signal Strength & Active Trade Status
• Numeric strength + progress bar and whether a trade is currently active with TP/SL display.
________________________________________
11) Alerts — what will notify you
The indicator includes pre-built alert triggers for:
• Bullish confirmed signal
• Bearish confirmed signal
• TP hit (long/short)
• SL hit (long/short)
• No-trade zone
• High signal strength (score > 75%)
Training use: enable alerts during a replay session to be notified when the indicator would have signalled.
________________________________________
12) Labs — hands-on exercises for learners (step-by-step)
Lab A — Order Block recognition
1. Pick a 15–30 minute timeframe on a liquid ticker.
2. Use default OB periods (7). Mark each time the dashboard shows a Buy/Sell OB.
3. Manually inspect the chart at the base candle and the following sequence — draw the OB zone by hand and watch later price reactions to it.
4. Repeat with OB periods 5 and 10; note stability vs noise.
Lab B — Trendline break confirmation
1. Increase trendline period (e.g., 20), watch trendlines form from pivots.
2. When a resistance break is flagged, compare with MACD & volume: was momentum aligned?
3. Note false breaks vs confirmed moves — change extension_bars to see projection effects.
Lab C — Filter sensitivity
1. Toggle Use Volume Filter off, and record the number and quality of signals in a 2-day window.
2. Re-enable volume filter and change threshold from 1.2 → 1.6; note how many low-quality signals are filtered out.
Lab D — Trade management simulation
1. For each signalled trade, record the time, close entry approximation, TP, SL, and eventual hit/miss.
2. Compute actual PnL if you had entered at the open of the next bar to compare with the script’s PnL math.
3. Tabulate win rate and average R:R.
Lab E — Performance review & improvement
1. Build a spreadsheet of signals over 30–90 periods with columns: Date, Signal type, Entry price (real), TP, SL, Exit, PnL, Notes.
2. Analyze which filters or indicators contributed most to winners vs losers and adjust weights.
________________________________________
13) Common pitfalls, assumptions & implementation notes (things to watch)
• P&L simplification: total_pnl uses close as a proxy entry price. Real entry/exit prices and slippage are not recorded — so PnL is approximate.
• No position sizing or money management: the script doesn’t compute position size from equity or risk percent.
• Signal confirmation logic: composite "signal_strength" is a simple 4×25 point scheme — explore different weights or additional signals.
• Order block detection nuance: the script defines the base candle and checks the subsequent sequence. Be sure to verify whether the intended candle direction (base being bullish vs bearish) aligns with academic/your trading definition — read the code carefully and test.
• Trendline slope over time: slope is computed using timestamps; small differences may make lines sensitive on very short timeframes — using bar_index differences is usually more stable.
• Not a true backtester: to evaluate performance statistically you must transform the logic into a strategy script that places hypothetical orders and records exact entry/exit prices.
________________________________________
14) Suggested improvements for advanced learners
• Record true entry price & timestamp for accurate PnL.
• Add position sizing: risk % per trade using SL distance and account size.
• Convert to strategy. (Pine Strategy)* to run formal backtests with equity curves, drawdowns, and metrics (Sharpe, Sortino).
• Log trades to an external spreadsheet (via alerts + webhook) for offline analysis.
• Add statistics: average win/loss, expectancy, max drawdown.
• Add additional filters: news time blackout, market session filters, multi-timeframe confirmation.
• Improve OB detection: combine wick/body, volume spike at base bar, and liquidity sweep detection.
________________________________________
15) Glossary — quick definitions
• ATR (Average True Range): measure of typical range; used to size targets and stops.
• EMA (Exponential Moving Average): trend smoothing giving more weight to recent prices.
• RSI (Relative Strength Index): momentum oscillator; >70 overbought, <30 oversold.
• MACD: momentum oscillator using difference of two EMAs.
• Bollinger Bands: volatility bands around SMA.
• Order Block: a base candle area with subsequent confirmation candles; a zone of institutional interest (learning model).
• Pivot High/Low: local turning point defined by candles on both sides.
• Signal Strength: combined score from multiple indicators.
• Win Rate: proportion of signals that hit TP vs total signals.
• R:R (Risk:Reward): ratio of potential reward (TP distance) to risk (entry to SL).
________________________________________
16) Limitations & assumptions (be explicit)
• This is an indicator for learning — not a trading robot or broker connection.
• No slippage, fees, commissions or tie-in to real orders are considered.
• The logic is heuristic (rule-of-thumb), not a guarantee of performance.
• Results are sensitive to timeframe, market liquidity, and parameter choices.
________________________________________
17) Practical classroom / study plan (4 sessions)
• Session 1 — Foundations: Understand EMAs, ATR, RSI, MACD, Bollinger Bands. Run the indicator and watch how these numbers change on a single day.
• Session 2 — Zones & Filters: Study order blocks and trendlines. Test volume & ATR filters and note changes in false signals.
• Session 3 — Simulated trading: Manually track 20 signals, compute real PnL and compare to the dashboard.
• Session 4 — Improvement plan: Propose changes (e.g., better PnL accounting, alternative OB rule) and test their impact.
________________________________________
18) Quick reference checklist for each signal
1. Was an order block or trendline break detected? (primary trigger)
2. Did volume meet threshold? (filter)
3. Did ATR filter (bar size) show a real move? (filter)
4. Was trend aligned (EMA 9/21/50)? (confirmation)
5. Signal confirmed → mark entry approximation, TP, SL.
6. Monitor dashboard (Signal Strength, Volatility, No-trade zone, R:R).
7. After exit, log real entry/exit, compute actual PnL, update spreadsheet.
________________________________________
19) Educational caveat & final note
This tool is built for training and analysis: it helps you see how common technical building blocks combine into trade ideas, but it is not a trading recommendation. Use it to develop judgment, to test hypotheses, and to design robust systems with proper backtesting and risk control before risking capital.
________________________________________
20) Disclaimer (must include)
Training & Educational Only — This material and the indicator are provided for educational purposes only. Nothing here is investment advice or a solicitation to buy or sell financial instruments. Past simulated or historical performance does not predict future results. Always perform full backtesting and risk management, and consider seeking advice from a qualified financial professional before trading with real capital.
________________________________________
Recherche dans les scripts pour "西布罗姆vs伯恩利"

Chart-Only Scanner — Pro Table v2.5.1Chart-Only Scanner — Pro Table v2.5
User Manual (Pine Script v6)
What this tool does (in one line)
A compact, on-chart table that scores the current chart symbol (or an optional override) using momentum, volume, trend, volatility, and pattern checks—so you can quickly decide UP, DOWN, or WAIT.
Quick Start (90 seconds)
Add the indicator to any chart and timeframe (1m…1M).
Leave “Override chart symbol” = OFF to auto-use the chart’s symbol.
Choose your layout:
Row (wide horizontal strip), or Grid (title + labeled cells).
Pick a size preset (Micro, Small, Medium, Large, Mobile).
Optional: turn on “Use Higher TF (EMA 20/50)” and set HTF Multiplier (e.g., 4 ⇒ if chart is 15m, HTF is 60m).
Watch the table:
DIR (↑/↓/→), ROC%, MOM, VOL, EMA stack, HTF, REV, SCORE, ACT.
Add an alert if you want: the script fires when |SCORE| ≥ Action threshold.
What to expect
A small table appears on the chart corner you choose, updating each bar (or only at bar close if you keep default smart-update).
The ACT cell shows 🔥 (strong), 👀 (medium), or ⏳ (weak).
Panels & Settings (every option explained)
Core
Momentum Period: Lookback for rate-of-change (ROC%). Shorter = more reactive; longer = smoother.
ROC% Threshold: Minimum absolute ROC% to call direction UP (↑) or DOWN (↓); otherwise →.
Require Volume Confirmation: If ON and VOL ≤ 1.0, the SCORE is forced to 0 (prevents low-volume false positives).
Override chart symbol + Custom symbol: By default, the indicator uses the chart’s symbol. Turn this ON to lock to a specific ticker (e.g., a perpetual).
Higher TF
Use Higher TF (EMA 20/50): Compares EMA20 vs EMA50 on a higher timeframe.
HTF Multiplier: Higher TF = (chart TF × multiplier).
Example: on 3H chart with multiplier 2 ⇒ HTF = 6H.
Volatility & Oscillators
ATR Length: Used to show ATR% (ATR relative to price).
RSI Length: Standard RSI; colors: green ≤30 (oversold), red ≥70 (overbought).
Stoch %K Length: With %D = SMA(%K, 3).
MACD Fast/Slow/Signal: Standard MACD values; we display Line, Signal, Histogram (L/S/H).
ADX Length (Wilder): Wilder’s smoothing (internal derivation); also shows +DI / −DI if you enable the ADX column.
EMAs / Trend
EMA Fast/Mid/Slow: We compute EMA(20/50/200) by default (editable).
EMA Stack: Bull if Fast > Mid > Slow; Bear if Fast < Mid < Slow; Flat otherwise.
Benchmark (optional, OFF by default)
Show Relative Strength vs Benchmark: Displays RS% = ROC(symbol) − ROC(benchmark) over the Momentum Period.
Benchmark Symbol: Ticker used for comparison (e.g., BTCUSDT as a market proxy).
Columns (show/hide)
Toggle which fields appear in the table. Hiding unused fields keeps the layout clean (especially on mobile).
Display
Layout Mode:
Row = a single two-row strip; each column is a metric.
Grid = a title row plus labeled pairs (label/value) arranged in rows.
Size Preset: Micro, Small, Medium, Large, Mobile change text size and the grid density.
Table Corner: Where the panel sits (e.g., Top Right).
Opaque Table Background: ON = dark card; OFF = transparent(ish).
Update Every Bar: ON = update intra-bar; OFF = smart update (last bar / real-time / confirmed history).
Action threshold (|score|): The cutoff for 🔥 and alert firing (default 70).
How to read each field
CHART: The active symbol name (or your custom override).
DIR: ↑ (ROC% > threshold), ↓ (ROC% < −threshold), → otherwise.
ROC%: Rate of change over Momentum Period.
Formula: (Close − Close ) / Close × 100.
MOM: A scaled momentum score: min(100, |ROC%| × 10).
VOL: Volume ratio vs 20-bar SMA: Volume / SMA(Volume,20).
1.5 highlights as yellow (significant participation).
ATR%: (ATR / Close) × 100 (volatility relative to price).
RSI: Colored for extremes: ≤30 green, ≥70 red.
Stoch K/D: %K and %D numbers.
MACD L/S/H: Line, Signal, Histogram. Histogram color reflects sign (green > 0, red < 0).
ADX, +DI, −DI: Trend strength and directional components (Wilder). ADX ≥ 25 is highlighted.
EMA 20/50/200: Current EMA values (editable lengths).
STACK: Bull/Bear/Flat as defined above.
VWAP%: (Close − VWAP) / Close × 100 (premium/discount to VWAP).
HTF: ▲ if HTF EMA20 > EMA50; ▼ if <; · if flat/off.
RS%: Symbol’s ROC% − Benchmark ROC% (positive = outperforming).
REV (reversal):
🟢 Eng/Pin = bullish engulfing or bullish pin detected,
🔴 Eng/Pin = bearish engulfing or bearish pin,
· = none.
SCORE (absolute shown as a number; sign shown via DIR and ACT):
Components:
base = MOM × 0.4
volBonus = VOL > 1.5 ? 20 : VOL × 13.33
htfBonus = use_mtf ? (HTF == DIR ? 30 : HTF == 0 ? 15 : 0) : 0
trendBonus = (STACK == DIR) ? 10 : 0
macdBonus = 0 (placeholder for future versions)
scoreRaw = base + volBonus + htfBonus + trendBonus + macdBonus
SCORE = DIR ≥ 0 ? scoreRaw : −scoreRaw
If Require Volume Confirmation and VOL ≤ 1.0 ⇒ SCORE = 0.
ACT:
🔥 if |SCORE| ≥ threshold
👀 if 50 < |SCORE| < threshold
⏳ otherwise
Practical examples
Strong long (trend + participation)
DIR = ↑, ROC% = +3.2, MOM ≈ 32, VOL = 1.9, STACK = Bull, HTF = ▲, REV = 🟢
SCORE: base(12.8) + volBonus(20) + htfBonus(30) + trend(10) ≈ 73 → ACT = 🔥
Action idea: look for longs on pullbacks; confirm risk with ATR%.
Weak long (no volume)
DIR = ↑, ROC% = +1.0, but VOL = 0.8 and Require Volume Confirmation = ON
SCORE forced to 0 → ACT = ⏳
Action: wait for volume > 1.0 or turn off confirmation knowingly.
Bearish reversal warning
DIR = →, REV = 🔴 (bearish engulfing), RSI = 68, HTF = ▼
SCORE may be mid-range; ACT = 👀
Action: watch for breakdown and rising VOL.
Alerts (how to use)
The script calls alert() whenever |SCORE| ≥ Action threshold.
To receive pop-ups, sounds, or emails: click “⏰ Alerts” in TradingView, choose this indicator, and pick “Any alert() function call.”
The alert message includes: symbol, |SCORE|, DIR.
Layout, Size, and Corner tips
Row is best when you want a compact status ribbon across the top.
Grid is clearer on big screens or when you enable many columns.
Size:
Mobile = one pair per row (tall, readable)
Micro/Small = dense; good for many fields
Large = presentation/screenshots
Corner: If the table overlaps price, change the corner or set Opaque Background = OFF.
Repaint & timeframe behavior
Default smart update prefers stability (last bar / live / confirmed history).
For a stricter, “close-only” behavior (less repaint): turn Update Every Bar = OFF and avoid Heikin Ashi when you want raw market OHLC (HA modifies price inputs).
HTF logic is derived from a clean, integer multiple of your chart timeframe (via multiplier). It works with 3H/4H and any TF.
Performance notes
The script analyzes one symbol (chart or override) with multiple metrics using efficient tuple requests.
If you later want a multi-symbol grid, do it with pages (10–15 per page + rotate) to stay within platform limits (recommended future add-on).
Troubleshooting
No table visible
Ensure the indicator is added and not hidden.
Try toggling Opaque Background or switch Corner (it might be behind other drawings).
Keep Columns count reasonable for the chosen Size.
If you turned ON Override, verify the Custom symbol exists on your data provider.
Numbers look different on HA candles
Heikin Ashi modifies OHLC; switch to regular candles if you need raw price metrics.
3H/4H issues
Use integer HTF Multiplier (e.g., 2, 4). The tool builds the correct string internally; no manual timeframe strings needed.
Power user tips
Volume gating: keeping Require Volume Confirmation = ON filters most fake moves; if you’re a scalper, reduce strictness or turn it off.
Action threshold: 60–80 is typical. Higher = fewer but stronger signals.
Benchmark RS%: great for spotting leaders/laggards; positive RS% = outperformance vs benchmark.
Change policy & safety
This version doesn’t alter your historical logic you tested (no radical changes).
Any future “radical” change (score weights, HTF logic, UI hiding data) will ship with a toggle and an Impact Statement so you can keep old behavior if you prefer.
Glossary (quick)
ROC%: Percent change over N bars.
MOM: Scaled momentum (0–100).
VOL ratio: Volume vs 20-bar average.
ATR%: ATR as % of price.
ADX/DI: Trend strength / direction components (Wilder).
EMA stack: Relationship between EMAs (bullish/bearish/flat).
VWAP%: Premium/discount to VWAP.
RS%: Relative strength vs benchmark.

Asset Premium/Discount Monitor📊 Overview
The Asset Premium/Discount Monitor is a tool for analyzing the relative value between two correlated assets. It measures when one asset is trading at a premium or discount compared to its historical relationship with another asset, helping traders identify potential mean reversion opportunities, or pairs trading opportunities.
🎯 Use Cases
Perfect for analyzing:
NASDAQ:MSTR vs CRYPTO:BTCUSD - MicroStrategy's premium/discount to Bitcoin
NASDAQ:COIN vs BITSTAMP:BTCUSD - Coinbase's relative value to Bitcoin
NASDAQ:TSLA vs NASDAQ:QQQ - Tesla's premium to tech sector
Regional banks AMEX:KRE vs AMEX:XLF - Individual bank stocks vs financial sector
Any two correlated assets where relative value matters
Example of a trade: MSTR vs BTC - When indicator shows MSTR at 95% percentile (extreme premium): Short MSTR, Buy BTC. Then exit when the spread reverts to the mean, say 40-60% percentile.
🔧 How It Works
Core Calculation
Ratio Analysis: Calculates the price ratio between your asset and the correlated asset
Historical Baseline: Establishes the "normal" relationship using a 252-day moving average. You can change this.
Premium Measurement: Measures current deviation from historical average as a percentage
Statistical Context: Provides percentile rankings and standard deviation bands
The Math
Premium % = (Current Ratio / Historical Average Ratio - 1) × 100
🎨 Customization Options
Correlated Asset: Choose any symbol for comparison
Lookback Period: Adjust historical baseline (50-1000 days)
Smoothing: Reduce noise with moving average (1-50 days)
Visual Toggles: Show/hide bands and percentile lines
Color Themes: Customize premium/discount colors
📊 Interpretation Guide
Premium/Discount Reading
Positive %: Asset trading above historical relationship (premium)
Negative %: Asset trading below historical relationship (discount)
Near 0%: Asset at fair value relative to correlation
Percentile Ranking
90%+: Near recent highs - potential selling opportunity
10% and below: Near recent lows - potential buying opportunity
25-75%: Normal trading range
Signal Classifications
🔴 SELL PREMIUM: Asset expensive relative to recent range
🟡 Premium Rich: Moderately expensive, monitor for reversal
⚪ NEUTRAL: Fair value territory
🟡 Discount Opportunity: Moderately cheap, potential accumulation zone
🟢 BUY DISCOUNT: Asset cheap relative to recent range
🚨 Built-in Alerts
Extreme Premium Alert: Triggers when percentile > 95%
Extreme Discount Alert: Triggers when percentile < 5%
⚠️ Important Notes
Works best with highly correlated assets
Historical relationships can change - monitor correlation strength
Not investment advice - use as one factor in your analysis
Backtest thoroughly before implementing any strategy
🔄 Updates & Future Features
This indicator will be continuously improved based on user feedback. So... please give me your feedback!

SynchroTrend Oscillator (STO) [PhenLabs]📊 SynchroTrend Oscillator
Version: PineScript™ v5
📌 Description
The SynchroTrend Oscillator (STO) is a multi-timeframe synchronization tool that combines trend information from three distinct timeframes into a single, easy-to-interpret oscillator ranging from -100 to +100.
This indicator solves the common problem of having to analyze multiple timeframe charts separately by consolidating trend direction and strength across different time horizons. The STO helps traders identify when markets are truly synchronized across timeframes, potentially indicating stronger trend conditions and higher probability trading opportunities.
Using either Moving Average crossovers or RSI analysis as the trend definition metric, the STO provides a comprehensive view of market structure that adapts to various trading strategies and market conditions.
🚀 Points of Innovation
Triple-timeframe synchronization in a single view eliminates chart switching
Dual trend detection methods (MA vs Price or RSI) for flexibility across different markets
Dynamic color intensity that automatically increases with signal strength
Scaled oscillator format (-100 to +100) for intuitive trend strength interpretation
Customizable signal thresholds to match your risk tolerance and trading style
Visual alerts when markets reach full synchronization states
🔧 Core Components
Trend Scoring System: Calculates a binary score (+1, -1, or 0) for each timeframe based on selected metrics, providing clear trend direction
Multi-Timeframe Synchronization: Combines and scales trend scores from all three timeframes into a single oscillator
Dynamic Visualization: Adjusts color transparency based on signal strength, creating an intuitive visual guide
Threshold System: Provides customizable levels for identifying potentially significant trading opportunities
🔥 Key Features
Triple Timeframe Analysis: Synchronizes three user-defined timeframes (default: 60min, 15min, 5min) into one view
Dual Trend Detection Methods: Choose between Moving Average vs Price or RSI-based trend determination
Adjustable Signal Smoothing: Apply EMA, SMA, or no smoothing to the oscillator output for your preferred signal responsiveness
Dynamic Color Intensity: Colors become more vibrant as signal strength increases, helping identify strongest setups
Customizable Thresholds: Set your own buy/sell threshold levels to match your trading strategy
Comprehensive Alerts: Six different alert conditions for crossing thresholds, zero line, and full synchronization states
🎨 Visualization
Oscillator Line: The main line showing the synchronized trend value from -100 to +100
Dynamic Fill: Area between oscillator and zero line changes transparency based on signal strength
Threshold Lines: Optional dotted lines indicating buy/sell thresholds for visual reference
Color Coding: Green for bullish synchronization, red for bearish synchronization
📖 Usage Guidelines
Timeframe Settings
Timeframe 1: Default: 60 (1 hour) - Primary higher timeframe for trend definition
Timeframe 2: Default: 15 (15 minutes) - Intermediate timeframe for trend definition
Timeframe 3: Default: 5 (5 minutes) - Lower timeframe for trend definition
Trend Calculation Settings
Trend Definition Metric: Default: “MA vs Price” - Method used to determine trend on each timeframe
MA Type: Default: EMA - Moving Average type when using MA vs Price method
MA Length: Default: 21 - Moving Average period when using MA vs Price method
RSI Length: Default: 14 - RSI period when using RSI method
RSI Source: Default: close - Price data source for RSI calculation
Oscillator Settings
Smoothing Type: Default: SMA - Applies smoothing to the final oscillator
Smoothing Length: Default: 5 - Period for the smoothing function
Visual & Threshold Settings
Up/Down Colors: Customize colors for bullish and bearish signals
Transparency Range: Control how transparency changes with signal strength
Line Width: Adjust oscillator line thickness
Buy/Sell Thresholds: Set levels for potential entry/exit signals
✅ Best Use Cases
Trend confirmation across multiple timeframes
Finding high-probability entry points when all timeframes align
Early detection of potential trend reversals
Filtering trade signals from other indicators
Market structure analysis
Identifying potential divergences between timeframes
⚠️ Limitations
Like all indicators, can produce false signals during choppy or ranging markets
Works best in trending market conditions
Should not be used in isolation for trading decisions
Past performance is not indicative of future results
May require different settings for different markets or instruments
💡 What Makes This Unique
Combines three timeframes in a single visualization without requiring multiple chart windows
Dynamic transparency feature that automatically emphasizes stronger signals
Flexible trend definition methods suitable for different market conditions
Visual system that makes multi-timeframe analysis intuitive and accessible
🔬 How It Works
1. Trend Evaluation:
For each timeframe, the indicator calculates a trend score (+1, -1, or 0) using either:
MA vs Price: Comparing close price to a moving average
RSI: Determining if RSI is above or below 50
2. Score Aggregation:
The three trend scores are combined and then scaled to a range of -100 to +100
A value of +100 indicates all timeframes show bullish conditions
A value of -100 indicates all timeframes show bearish conditions
Values in between indicate varying degrees of alignment
3. Signal Processing:
The raw oscillator value can be smoothed using EMA, SMA, or left unsmoothed
The final value determines line color, fill color, and transparency settings
Threshold levels are applied to identify potential trading opportunities
💡 Note:
The SynchroTrend Oscillator is most effective when used as part of a comprehensive trading strategy that includes proper risk management techniques. For best results, consider using the oscillator in conjunction with support/resistance levels, price action analysis, and other complementary indicators that align with your trading style.

OverUnder Yield Spread🗺️ OverUnder is a structural regime visualizer , engineered to diagnose the shape, tone, and trajectory of the yield curve. Rather than signaling trades directly, it informs traders of the world they’re operating in. Yield curve steepening or flattening, normalizing or inverting — each regime reflects a macro pressure zone that impacts duration demand, liquidity conditions, and systemic risk appetite. OverUnder abstracts that complexity into a color-coded compression map, helping traders orient themselves before making risk decisions. Whether you’re in bonds, currencies, crypto, or equities, the regime matters — and OverUnder makes it visible.
🧠 Core Logic
Built to show the slope and intent of a selected rate pair, the OverUnder Yield Spread defaults to 🇺🇸US10Y-US2Y, but can just as easily compare global sovereign curves or even dislocated monetary systems. This value is continuously monitored and passed through a debounce filter to determine whether the curve is:
• Inverted, or
• Steepening
If the curve is flattening below zero: the world is bracing for contraction. Policy lags. Risk appetite deteriorates. Duration gets bid, but only as protection. Stocks and speculative assets suffer, regardless of positioning.
📍 Curve Regimes in Bull and Bear Contexts
• Flattening occurs when the short and long ends compress . In a bull regime, flattening may reflect long-end demand or fading growth expectations. In a bear regime, flattening often precedes or confirms central bank tightening.
• Steepening indicates expanding spread . In a bull context, this may signal healthy risk appetite or early expansion. In a bear or crisis context, it may reflect aggressive front-end cuts and dislocation between short- and long-term expectations.
• If the curve is steepening above zero: the world is rotating into early expansion. Risk assets behave constructively. Bond traders position for normalization. Equities and crypto begin trending higher on rising forward expectations.
🖐️ Dynamically Colored Spread Line Reflects 1 of 4 Regime States
• 🟢 Normal / Steepening — early expansion or reflation
• 🔵 Normal / Flattening — late-cycle or neutral slowdown
• 🟠 Inverted / Steepening — policy reversal or soft landing attempt
• 🔴 Inverted / Flattening — hard contraction, credit stress, policy lag
🍋 The Lemon Label
At every bar, an anchored label floats directly on the spread line. It displays the active regime (in plain English) and the precise spread in percent (or basis points, depending on resolution). Colored lemon yellow, neither green nor red, the label is always legible — a design choice to de-emphasize bias and center the data .
🎨 Fill Zones
These bands offer spatial, persistent views of macro compression or inversion depth.
• Blue fill appears above the zero line in normal (non-inverted) conditions
• Red fill appears below the zero line during inversion
🧪 Sample Reading: 1W chart of TLT
OverUnder reveals a multi-year arc of structural inversion and regime transition. From mid-2021 through late 2023, the spread remains decisively inverted, signaling persistent flattening and credit stress as bond prices trended sharply lower. This prolonged inversion aligns with a high-volatility phase in TLT, marked by lower highs and an accelerating downtrend, confirming policy lag and macro tightening conditions.
As of early 2025, the spread has crossed back above the zero baseline into a “Normal / Steepening” regime (annotated at +0.56%), suggesting a macro inflection point. Price action remains subdued, but the shift in yield structure may foreshadow a change in trend context — particularly if follow-through in steepening persists.
🎭 Different Traders Respond Differently:
• Bond traders monitor slope change to anticipate policy pivots or recession signals.
• Equity traders use regime shifts to time rotations, from growth into defense, or from contraction into reflation.
• Currency traders interpret curve steepening as yield compression or divergence depending on region.
• Crypto traders treat inversion as a liquidity vacuum — and steepening as an early-phase risk unlock.
🛡️ Can It Compare Different Bond Markets?
Yes — with caveats. The indicator can be used to compare distinct sovereign yield instruments, for example:
• 🇫🇷FR10Y vs 🇩🇪DE10Y - France vs Germany
• 🇯🇵JP10Y vs 🇺🇸US10Y - BoJ vs Fed policy curves
However:
🙈 This no longer visualizes the domestic yield curve, but rather the differential between rate expectations across regions
🙉 The interpretation of “inversion” changes — it reflects spread compression across nations , not within a domestic yield structure
🙊 Color regimes should then be viewed as relative rate positioning , not absolute curve health
🙋🏻 Example: OverUnder compares French vs German 10Y yields
1. 🇫🇷 Change the long-duration ticker to FR10Y
2. 🇩🇪 Set the short-duration ticker to DE10Y
3. 🤔 Interpret the result as: “How much higher is France’s long-term borrowing cost vs Germany’s?”
You’ll see steepening when the spread rises (France decoupling), flattening when the spread compresses (convergence), and inversions when Germany yields rise above France’s — historically rare and meaningful.
🧐 Suggested Use
OverUnder is not a signal engine — it’s a context map. Its value comes from situating any trade idea within the prevailing yield regime. Use it before entries, not after them.
• On the 1W timeframe, OverUnder excels as a macro overlay. Yield regime shifts unfold over quarters, not days. Weekly structure smooths out rate volatility and reveals the true curvature of policy response and liquidity pressure. Use this view to orient your portfolio, define directional bias, or confirm long-duration trend turns in assets like TLT, SPX, or BTC.
• On the 1D timeframe, the indicator becomes tactically useful — especially when aligning breakout setups or trend continuations with steepening or flattening transitions. Daily views can also identify early-stage regime cracks that may not yet be visible on the weekly.
• Avoid sub-daily use unless you’re anchoring a thesis already built on higher timeframe structure. The yield curve is a macro construct — it doesn’t oscillate cleanly at intraday speeds. Shorter views may offer clarity during event-driven spikes (like FOMC reactions), but they do not replace weekly context.
Ultimately, OverUnder helps you decide: What kind of world am I trading in? Use it to confirm macro context, avoid fighting the curve, and lean into trades aligned with the broader pressure regime.

See inside Candles: Directionality %; Constituent Bars & GapsSee inside candles based on user-input LTF setting: get data on 'Directionality' of your candle; Gaps (total and Sum; UP and DOWN); Number of Bull or Bear constituent candles
//Features:
-DIRECTIONALITY: compare length of the 'zig-zag' random walk of lower time frame constituent candles, to the full height of the current candle. Resulting % I refer to as 'directionality'.
-GAPs: what i refer to as 'gaps' are also known as Volume imbalances: the gap between previous candles close and current candle's open (if there is one).
--Gaps total (up vs down gaps). Number of Up gaps printed above bar in green, down gaps printed below bar in red.
--Gaps Sum (total summed UP gap, total summed down gaps. Sum of Up gaps printed above bar in green, Sum of down gaps printed below bar in red.
-Candles Total: Numer of LTF up vs down candles within current timeframe candle. Number of up candles printed above bar in green, Number of down candles printed below bar in red.
//USAGE:
-Primary purpose in this was the Directionality aspect. Wanted to get a measure of how choppy vs how directional the internals of a candle were. Idea being that a candle with high % directionality (approaching 100) would imply trending conditions; while a candle which was large range and full bodies but had a low % directionality would imply the internals were back-and-forth and => rebalanced, potentially indicating price may not need to retrace back into it and rebalance further. All rather experimental, please treat it as such: have a play around with it.
-Number of gaps, Sums of up and down gaps, ratio of up and down constituent candles also intended to serve a similar purpose as the above.
-Set the input lower timeframe; this must obviously be lower then your current timeframe. You will significant differences in results depending on the ratio your timeframes (chart timeframe vs user-input timeframe).
//User Inputs:
-Lower timeframe input (setting child candle size within current chart parent candle).
-Choose function from the four listed above.
-typical formating options: Bull color/bear color txt for gaps functions.
-display % unit or not.
-display vertical or horizontal text.
-Set min / max directionality thresholds; and color code results.
-Toggle on/off 'hide results outside of threshold' to declutter the chart.
-choose label style.
//NOTES:
-Directionality thresholds can be set manually; Max and Min thresholds can be set to filter out 'non-extreme' readings.
-Note that directionality % can sometimes exceed 100%, in cases where price trends very strongly and gaps up continuously such that sum of constituent candles is less than total range of parent candle.
-Personally i like the idea of seeking bold, large-range, full bodied candles, with a lower than typical directionality %; indicating that a price move is both significant and it's already done it's rebalancing; I would see this as potentially favourable for continuation (obviously depending on context).
---- Showcase of the other functions beyond Directionality percentage ----
Candles Total (bull vs Bear). ES1! Hourly; ltf = 5min: Candles total: LTF up candles and LTF down candles making up the current HTF candle (constituent number of UP candles printed above in green, Down candles printed below in red):
Gaps SUM. SPX hourly, ltf = 5min. Sum of 'UP' gaps within candle printed above in green, sum of 'DOWN' gaps printed below in red:
Gaps TOTAL: SPX hourly, ltf = 1min. Simply the total of 'up' gaps vs 'down' gaps withing our candle; based on the user input constituent candles within:

Correlation Coefficient: Visible Range Dynamic Average R -Correlation Coefficient with Dynamic Average R (shows R average for the visible chart only, changes as you zoom in or out)
-Label: Vis-Avg-R = Visable Average R
-the Correlation Coefficient function for Pearson's R is taken from "BA🐷 CC" indicator by @balipour (highly recommended; more thorough treatment of R and other stats, but without the dynamic average)
-I wrote this primarily to add a dynamic Average R, showing correlation for arbitrary start times/end times; whether it be the last month, last year, of some specific period from the past (backtest mode)
-I have been using this to get an idea of correlation regimes over time between Bonds vs Stocks (ZB1! vs ES1!).
-As you see from the above, most of 2022 has seen an unusually strong positive correlation between Bonds and Stocks
~~inputs:
-lookback length for calculation of R
-Backtest mode (true by default): displays Average R for ONLY the visible range displayed on any part of chart history (LHS to RHS of screen only)
-source for both Ticker and compared Asset (close, open, high, low, ohlc4.. etc)
~~some other assets worth comparing:
Aussie vs Gold; Aussie vs ES; Btc vs ES; Copper vs ES

USD Session 8FX - LDN & NY (TF-invariant, Live + Table)What it is
A USD strength/weakness meter for the London (08:00–08:45) or New York (15:30–16:00/16:15) session. It blends the movement of 8 markets—EURUSD, GBPUSD, AUDUSD, NZDUSD, USDCHF, USDCAD, USDJPY, XAUUSD—into one Score that is timeframe-invariant (it uses a 1-minute “boundary TF” under the hood so changing chart TF doesn’t change the math).
Core logic (simple)
During the chosen session window, it records each symbol’s start and live end prices, computes returns, optionally normalizes by ATR (volatility), applies your weights, and averages anti-USD (EUR/GBP/AUD/NZD/XAU) vs USD-base (CHF/CAD/JPY) groups.
The final Score is the normalized sum of weighted contributions:
Score > 0 → “USD Strong”
Score < 0 → “USD Weak”
At the session close it freezes (“Locked”) the results so you can review them later.
What you see
Main plot: the USD Score line (with a 0 baseline).
Optional lines: Anti-USD average vs USD-base average (post-normalization, pre-weights).
Session background shading (London silver, New York aqua).
Live table with:
Each symbol’s % change, its weight, and its contribution to the Score.
TOP badges for the two biggest drivers (by absolute contribution).
A Side column (only for the two TOPs) showing BUY/SELL aligned with the USD verdict (e.g., if USD Strong → SELL anti-USD pairs like EURUSD, BUY USD-base like USDCHF).
Verdict row with USD Strong/Weak, the Score value, the window text, and whether you’re LIVE / CLOSED / FROZEN.
Trade Gate panel:
Shows Verdict (USD Strong/Weak), Bias OK/weak (|Score| vs your threshold), Top-1/Top-2 VWAP checks, an overall GATE: OK/NO, and an Entry hint string (e.g., “SELL EURUSD, BUY USDCHF”) when conditions align.
VWAP “Trade Gate”
It confirms alignment between the USD bias and price vs VWAP for the top movers:
If USD Strong: anti-USD symbols should be below VWAP (short bias), USD-base symbols above VWAP (long bias).
If USD Weak: the opposite.
Gate = OK only if |Score| ≥ minAbsScore and at least one of the two TOP symbols is on the correct side of VWAP.
Tip: set vwapTF to an intraday value (“1”, “5”, “15”) for reliable VWAP on higher-TF charts.
Alerts
At session close: “USD Strong/Weak – session close”.
Live threshold: alerts when |Score| crosses your intraday threshold up/down.
Entry hint (Gate OK): triggers when the Gate flips from NO → OK inside the window.
If you create an alert of type “Any alert() function call”, you also get a dynamic message like:
ENTRY HINT • Hint: SELL EURUSD, BUY USDCHF
Key inputs you can tweak
Session: London vs New York; NY end time 16:00 or 16:15.
Timezone: default Europe/Tirane.
Boundary TF: default “1” (keeps the indicator TF-invariant).
minAbsScore: sensitivity threshold for “Bias OK”.
ATR normalization (len): stabilizes comparisons across different volatility regimes.
VWAP settings: toggle panel and set vwapTF.
How to use (playbook)
Choose the session (e.g., New York 15:30–16:15), keep Boundary TF = 1.
If you’re on a higher-TF chart, set vwapTF = "1" or "5".
Watch Score and Verdict; when |Score| ≥ minAbsScore, bias is meaningful.
Check Top-1/Top-2 and the Trade Gate:
If Gate = OK, use the Entry hint (e.g., “SELL EURUSD, BUY USDCHF”) as the aligned idea.
Use your own execution rules (e.g., structure, risk, stops) on the suggested symbols.
After close, review the Frozen table to validate behavior and refine thresholds/weights.
Notes & edge cases
If some markets are illiquid/holiday, a few returns may be na; the script handles that gracefully.
If ta.vwap is na on high TFs, the Gate will simply not confirm—set vwapTF intraday.
You can customize weights (e.g., reduce XAUUSD to -0.3 or similar) to suit your basket philosophy.
If you want, I can add toggles to show Side for all 8 symbols, or print a one-line summary (e.g., “USD Strong • Score 0.23 • Gate OK • SELL EURUSD, BUY USDCHF”) in the top-left of the pane.

Ripster Labels + Air Gaps (v6)What it shows (on one chart)
EMA Clouds (current timeframe)
Plots EMA 8/12/21/34/50/200 with three cloud fills:
12–21 = “fast” cloud
34–50 = “mid” cloud
50–200 = “base” cloud
Cloud color: green when the faster EMA is above the slower (bullish), red/maroon/orange when below (bearish).
Toggle lines vs. clouds via A) EMA Clouds settings.
MTF Rails (higher-TF EMAs)
For three higher timeframes (defaults 30m / 60m / 240m), draws two EMAs each (defaults 34 & 50).
These are stepline-like rails you can visually use as higher-TF supports/resistances.
Configure in B) MTF Rails (turn on/off, change TFs/lengths/colors).
Relative Volume Box (RVol)
Small table (top-center) showing:
Candle Vol (formatted K/M/B if enabled)
RVol = current bar volume / SMA 20 of volume (as a %)
Color scale: blue (<100%), yellow (100–150%), red (>150%).
Settings in C) RVol Box.
DTR vs ATR Box
Daily True Range (DTR = day high − day low) vs ATR(14) on the daily timeframe, with DTR as % of ATR.
Placed at top-right; toggle in D) DTR/ATR Box.
Ripster Trend Label (10m 12/50)
Looks at a separate timeframe (default 10m): EMA 12 vs EMA 50.
Bottom-right table cell shows “10m Trend ↑/↓/Sideways” (green/red/gray).
Configure in E) Ripster Trend Labels (TF and lengths).
Air Gaps (single EMA per TF)
Three horizontal, auto-extending lines showing an EMA from 30m / 60m / 240m (default length 12).
“Air gaps” are the price spaces between these lines—often lighter-resistance zones for price.
Start point logic:
All Bars = draw from the chart’s left
Start of Day = draw from today’s first bar
Bars Offset = draw from N bars back (default 100)
Settings in F) Air Gaps (TFs, length, draw-from, bars-back).
Inputs & where to tweak
A) EMA Clouds
Show EMA Clouds: master toggle
Source: close (default)
Lengths: 8/12/21/34/50/200
Show EMA lines: toggle plotted lines (clouds remain)
B) MTF Rails
Show MTF Rails
TF1/TF2/TF3 (defaults 30/60/240)
EMA A/B (defaults 34/50)
C) RVol Box
Show box
Format as K/M/B: K=1e3, M=1e6, B=1e9
D) DTR/ATR Box
Show DTR/ATR
ATR len: default 14 (daily)
E) Ripster Trend Labels
Show labels
Trend TF: default 10 (10-minute)
Trend EMA Fast/Slow: default 12/50
F) Air Gaps
Show Air Gap lines
TF1/TF2/TF3 (30/60/240)
EMA length: default 12
Draw from: All Bars | Start of Day | Bars Offset
Bars back: used if Draw from = Bars Offset
How it makes decisions
Cloud bias = sign of (faster EMA − slower EMA) for each cloud pair.
Example: 12>21 → fast cloud is bullish (green); 34>50 → mid cloud bullish (teal).
10m trend label = sign of (EMA12−EMA50) on the Trend TF (default 10m).
RVol = volume / sma(volume, 20); formatted as a percent and color-coded.
Practical read of the screen
Fast cloud flips (12/21) often mark short-term momentum changes; mid cloud flips (34/50) reflect swing bias.
Air Gap lines from higher TFs frequently act as support/resistance. Larger spaces between lines = “air gaps” where price can move with less friction.
RVol color tells you how “real” a move is: red/yellow often confirms momentum; blue warns of thin/liquidy bars.
DTR vs ATR shows if today’s range is stretched vs recent norm.
Design choices (why your prior errors are gone)
Removed multiline ?: chains → replaced by if/else (Pine v6 is picky about line continuations).
Moved fill() calls outside of local if blocks (Pine limitation).
ta.change(time("D")) != 0 makes the if condition boolean.
Declared G_drawFrom / G_barsBack before startX() so identifiers exist.

Continuation Suite v1 — 5m/15mContinuation Suite v1 — 5m/15m (Non-Repainting, S/R + Trend Continuation)
What it does
Continuation Suite v1 is a practical intraday toolkit that combines non-repainting trend-continuation signals with auto-built Support/Resistance (S/R) from confirmed pivots. It’s designed for fast, liquid names on 5m charts with an optional 15m higher-timeframe (HTF) overlay. You get: stacked-EMA bias, disciplined pullback+reclaim entries, optional volume/volatility gates, a “Strong” signal tier, solid S/R lines or zones, and a compact dashboard for fast reads.
⸻
Why traders use it
• Clear bias using fast/mid/slow EMA stacking.
• Actionable entries that require a pullback, a reclaim, and (optionally) a minor break of prior extremes.
• Signal quality gates (volume vs SMA, ATR%, ADX/DI alignment, EMA spacing, slope).
• Non-repainting logic when “Confirm on Close” = ON. Intrabar previews show what’s forming, but confirmed signals only print on bar close.
• S/R that matters: confirmed-pivot lines or ATR-sized zones, optional HTF overlay, and auto de-dup to avoid clutter.
⸻
Signal construction (no magic, just rules)
Bullish continuation (base):
1. Trend: EMA fast > EMA mid > EMA slow
2. Pullback: price pulls into the stack (lowest low or close vs EMA fast/mid over a lookback)
3. Reclaim: close > EMA fast and close > open
4. Break filter (optional): current bar takes out the prior bar’s high
5. Filters: volume > SMA (if enabled) and ATR% ≤ max (if enabled)
6. Cooldown: a minimum bar gap between signals
Bearish continuation (base): mirror of the above.
Strong signals: base conditions plus ADX ≥ threshold, DI alignment (DI+>DI- for longs; DI->DI+ for shorts), minimum EMA-spacing %, and minimum fast-EMA slope.
Reference stops:
• Longs: lowest low over the pullback lookback
• Shorts: highest high over the pullback lookback
Alerts are included for: Bullish Continuation, Bearish Continuation, STRONG Bullish, STRONG Bearish.
⸻
S/R engine (current TF + optional HTF)
• Builds S/R from confirmed pivots only (left/right bars).
• Choose Lines (midlines) or Zones (ATR-sized).
• Zones merge when a new pivot lands near an existing zone’s mid (ATR-scaled epsilon).
• Touches counter tracks significance; you can require a minimum to draw.
• HTF overlay (default 15m) draws separate lines/zones with tiny TF tags on the right.
• De-dup option hides current-TF zones that sit too close to HTF zones (ATR-scaled), reducing overlap.
• Freeze on Close (optional) keeps arrays stable intrabar; snapshots show levels immediately as bars open.
⸻
Presets
• Auto: Detects QQQ-like tickers (QQQ, QLD, QID) or SoFi; else defaults to Custom.
• QQQ: Tighter ATR% and EMA settings geared to index-ETF behavior.
• SoFi: Wider ATR allowances and longer mid/slow for single-name behavior.
• Custom: Expose all key inputs to tune for your product.
⸻
Dashboard (top-right)
• Preset in use
• Bias (Bullish CONT / Bearish CONT / Neutral)
• Strong (Yes/No)
• Volatility (ATR% bucket)
• Trend (ADX bucket)
• HTF timeframe tag
• Volume (bucket or “off”)
• Signals mode (Close-Confirmed vs Intrabar)
⸻
Inputs you’ll actually adjust
Trend/Signals
• Fast/Mid/Slow EMA lengths
• Pullback lookback, Min bars between signals
• Volume filter (vol > SMA N)
• ATR% max filter (cap excessive volatility)
• Require break of prior bar’s high/low
• “Strong” gates: min EMA slope, min EMA spacing %, ADX length & threshold
Support/Resistance
• Lines vs Zones
• Pivot left/right bars
• Extend left/right (bars)
• Max pivots kept (current & HTF)
• Zone width (× ATR), Merge epsilon (× ATR), Min gap (× ATR)
• Min touches, Max zones per side near price
• De-dup current TF vs HTF (× ATR)
Repainting control
• Confirm on Close: when ON, signals/SR finalize on bar close (non-repainting)
• Freeze on Close: freeze S/R intrabar with snapshot updates
• Show previews: translucent intrabar labels for what’s forming
⸻
How to use it (straightforward)
1. Load on 5-minute chart (baseline). Keep Confirm on Close ON if you hate repainting.
2. Use Bias + Strong + S/R context. If a long prints into HTF resistance, you have information.
3. Manage risk off the reference stop (pullback extreme). If ATR% reads “Great,” widen expectations; if “Poor,” size down or pass.
4. Alerts: wire the four alert types to your workflow.
⸻
Notes and constraints
• Designed for liquid symbols. Thin books and synthetic “volume” will degrade the volume gate.
• S/R is pivot-based. On very choppy tape, touch counts help. Increase min touches or switch to Lines to declutter.
• If your chart timeframe isn’t 5m, behavior changes because lengths are in bars, not minutes. Tune lengths accordingly.
⸻
Disclaimers
This is a research tool. No signals are guaranteed. Markets change, outliers happen, slippage is real. Nothing here is financial advice—use your own judgment and risk management.
⸻
Author: DaddyScruff
License: MPL-2.0 (Mozilla Public License 2.0)

MTF Market Bias+ (Smart Multi-Timeframe Trend Dashboard)The MTF Market Bias+ indicator provides a clear, data-driven view of market direction across multiple timeframes — from scalper to swing trader level.
It automatically calculates the bullish / bearish / neutral bias for each selected timeframe using various configurable methods such as EMA slope, price vs EMA, or EMA50 vs EMA200.
This tool gives you an instant overview of market alignment and helps you identify when lower and higher timeframes are in sync — the most powerful condition for high-probability trades.
🔍 Core Features
✅ Multi-Timeframe Bias Dashboard: Visual table showing bullish/bearish sentiment across your chosen timeframes (from 3m to 1W).
⚙️ Customizable Methods: Choose between
EMA Slope (default) → detects trend direction by EMA momentum
Price vs EMA → shows short-term strength or weakness
EMA50 vs EMA200 → classic golden cross vs death cross structure
🎨 Configurable Colors, Size & Layout: Adjust background, text, and label sizes for any chart style.
📊 Summary Row: Displays the majority trend (bullish, bearish, or neutral) with real-time score.
🧩 Adaptive Background Mode (optional): Automatically colors your chart background according to overall bias.
💡 Method Info Panel: Clearly shows which method and parameters are active (e.g. “EMA Slope | EMA=50”).
📈 How to Use
Add the indicator to your chart.
Select the timeframes you want to monitor (e.g. 3m, 5m, 15m, 1h, 4h, D, W).
Watch for alignment between lower and higher timeframes:
When all turn green → strong bullish alignment → consider longs.
When all turn red → strong bearish alignment → consider shorts.
Mixed colors indicate consolidation or correction phases.
Combine it with your favorite Fair Value Gap, CHOCH/BOS, or Liquidity Sweep strategy to significantly improve trade timing and confidence.
🧩 Author’s Note
This indicator is designed for traders who want fast, visual confirmation of multi-timeframe structure without cluttering their charts.
It’s simple, lightweight, and highly adaptable — whether you’re scalping on 3-minute charts or swing trading daily candles.

Swing Dashboard - Pro Trader Metrics with MTF & Enhanced VolumeDESCRIPTION:
A comprehensive real-time dashboard designed for swing traders and active investors trading US equities. Displays all critical metrics in one customizable panel overlay - no need to clutter your chart with multiple indicators.
KEY FEATURES:
📊 Relative Strength Analysis:
Stock vs Market (SPY/QQQ/IWM/DIA)
Stock vs Sector (automatic sector ETF detection)
Sector vs Market comparison
Customizable lookback period (5-60 days)
📈 Price & Range Metrics:
Daily range, change, and gap percentages
Distance from SMA20, SMA50, VWAP
52-week position percentage
ATR% and ADR% for volatility assessment
Range/ADR ratio for breakout detection
💪 Advanced Volume Analysis:
RVOL (full day volume vs 20-day average)
Volume Strength (bar-by-bar analysis)
Volume Trend (5-day vs 20-day momentum)
Customizable RVOL alert thresholds
Non-repainting volume calculations
⚙️ Multi-Timeframe (MTF) Mode:
View daily charts with 5-min or 15-min metric updates
Perfect for monitoring positions without switching timeframes
All calculations remain accurate across timeframes
🎨 Fully Customizable:
Choose which metrics to display
9 position options for the dashboard
Adjustable text size and colors
Toggle individual metrics on/off
Sector-specific ETF mapping for accurate RS calculations
TECHNICAL SPECIFICATIONS:
✅ Non-repainting - all calculations use confirmed bar data
✅ No lookahead bias or future data
✅ Optimized for US stocks with proper sector mapping
✅ Works on any timeframe (best on 5m-Daily)
✅ Pine Script v6 with best practices
✅ Handles edge cases and missing data gracefully
IDEAL FOR:
Swing traders monitoring multiple positions
Day traders needing quick metric overview
Investors tracking relative strength and momentum
Anyone who wants institutional-grade metrics in one place
SECTOR ETF MAPPING:
Automatically maps to correct sector ETFs: XLK, XLF, XLV, XLY, XLP, XLE, XLB, XLI, XLRE, XLC, XLU
HOW TO USE:
Green = Positive/Strong | Red = Negative/Weak | White = Neutral
RS > 0 = Outperforming benchmark/sector
RVOL > 1.5x = High volume day
VWAP% negative = Price below VWAP (mean reversion opportunity)
R/ADR > 100% = Extended range (potential exhaustion)
Perfect for traders who need professional-grade analysis without chart clutter.
TAGS:
dashboard, swing, relativestrengrh, sectoranalysis, volume, rvol, multitimeframe, mtf, tradingdashboard, metrics, daytrading, swingtrading, momentum, vwap, atr, volatility, volumeanalysis

Spread AnalysisSpread Analysis - Futures vs Spot Price Analysis
Advanced spread analysis tool that compares futures/perp prices with spot prices across multiple exchanges, providing insights into market sentiment and potential trading opportunities.
Multi-Asset Support: Automatically detects and analyzes crypto perpetual vs spot spreads, index futures vs cash indices (ES/SPX, NQ/NDX, YM/DJI), and commodity futures vs spot prices (GC/GOLD, CL/USOIL)
Multi-Exchange Aggregation: For crypto, aggregates prices from Binance, BitMEX, Kraken, Bybit, OKX, and Coinbase to calculate mean perp and spot prices
Z-Score Based Alerts: Uses statistical Z-score analysis to identify extreme spread conditions that may signal potential reversals or continuation patterns
Visual Histogram Display: Shows spread differences as colored columns - green for futures premium, red for futures discount
Flexible Calculation Methods: Supports absolute price differences, percentage spreads, or basis point calculations
Trading Applications: Identify market sentiment divergence, spot potential reversal opportunities, and confirm trend strength
Risk Management: Use extreme Z-scores to identify overvalued conditions and potential mean reversion setups
Market Analysis: Understand the relationship between futures and spot markets across different asset classes
Timing Tool: Spread momentum often precedes price moves, providing early signals for entry/exit decisions
Perfect for traders who want to understand the relationship between futures and spot markets, identify divergences, and spot potential reversal opportunities across crypto, indices, and commodities.
Key Features:
• Automatic asset detection and appropriate spread calculation
• Configurable Z-score alerts for extreme conditions
• Comprehensive tooltips and information guide
• Multiple calculation methods (absolute, percentage, basis points)
• Clean, customizable visual display
Use Cases:
• Crypto traders analyzing perp vs spot relationships
• Futures traders monitoring basis relationships
• Mean reversion strategies using extreme spreads
• Trend confirmation using spread momentum
• Market sentiment analysis across asset classes

AMF_LibraryLibrary "AMF_Library"
Adaptive Momentum Flow (AMF) Library - A comprehensive momentum oscillator that adapts to market volatility
@author B3AR_Trades
f_ema(source, length)
Custom EMA calculation that accepts a series length
Parameters:
source (float) : (float) Source data for calculation
length (float) : (float) EMA length (can be series)
Returns: (float) EMA value
f_dema(source, length)
Custom DEMA calculation that accepts a series length
Parameters:
source (float) : (float) Source data for calculation
length (float) : (float) DEMA length (can be series)
Returns: (float) DEMA value
f_sum(source, length)
Custom sum function for rolling sum calculation
Parameters:
source (float) : (float) Source data for summation
length (int) : (int) Number of periods to sum
Returns: (float) Sum value
get_average(data, length, ma_type)
Get various moving average types for fixed lengths
Parameters:
data (float) : (float) Source data
length (simple int) : (int) MA length
ma_type (string) : (string) MA type: "SMA", "EMA", "WMA", "DEMA"
Returns: (float) Moving average value
calculate_adaptive_lookback(base_length, min_lookback, max_lookback, volatility_sensitivity)
Calculate adaptive lookback length based on volatility
Parameters:
base_length (int) : (int) Base lookback length
min_lookback (int) : (int) Minimum allowed lookback
max_lookback (int) : (int) Maximum allowed lookback
volatility_sensitivity (float) : (float) Sensitivity to volatility changes
Returns: (int) Adaptive lookback length
get_volatility_ratio()
Get current volatility ratio
Returns: (float) Current volatility ratio vs 50-period average
calculate_volume_analysis(vzo_length, smooth_length, smooth_type)
Calculate volume-based buying/selling pressure
Parameters:
vzo_length (int) : (int) Lookback length for volume analysis
smooth_length (simple int) : (int) Smoothing length
smooth_type (string) : (string) Smoothing MA type
Returns: (float) Volume analysis value (-100 to 100)
calculate_amf(base_length, smooth_length, smooth_type, signal_length, signal_type, min_lookback, max_lookback, volatility_sensitivity, medium_multiplier, slow_multiplier, vzo_length, vzo_smooth_length, vzo_smooth_type, price_vs_fast_weight, fast_vs_medium_weight, medium_vs_slow_weight, vzo_weight)
Calculate complete AMF oscillator
Parameters:
base_length (int) : (int) Base lookback length
smooth_length (simple int) : (int) Final smoothing length
smooth_type (string) : (string) Final smoothing MA type
signal_length (simple int) : (int) Signal line length
signal_type (string) : (string) Signal line MA type
min_lookback (int) : (int) Minimum adaptive lookback
max_lookback (int) : (int) Maximum adaptive lookback
volatility_sensitivity (float) : (float) Volatility adaptation sensitivity
medium_multiplier (float) : (float) Medium DEMA length multiplier
slow_multiplier (float) : (float) Slow DEMA length multiplier
vzo_length (int) : (int) Volume analysis lookback
vzo_smooth_length (simple int) : (int) Volume analysis smoothing
vzo_smooth_type (string) : (string) Volume analysis smoothing type
price_vs_fast_weight (float) : (float) Weight for price vs fast DEMA
fast_vs_medium_weight (float) : (float) Weight for fast vs medium DEMA
medium_vs_slow_weight (float) : (float) Weight for medium vs slow DEMA
vzo_weight (float) : (float) Weight for volume analysis component
Returns: (AMFResult) Complete AMF calculation results
calculate_amf_default()
Calculate AMF with default parameters
Returns: (AMFResult) AMF result with standard settings
amf_oscillator()
Get just the main AMF oscillator value with default parameters
Returns: (float) Main AMF oscillator value
amf_signal()
Get just the AMF signal line with default parameters
Returns: (float) AMF signal line value
is_overbought(overbought_level)
Check if AMF is in overbought condition
Parameters:
overbought_level (float) : (float) Overbought threshold (default 70)
Returns: (bool) True if overbought
is_oversold(oversold_level)
Check if AMF is in oversold condition
Parameters:
oversold_level (float) : (float) Oversold threshold (default -70)
Returns: (bool) True if oversold
bullish_crossover()
Detect bullish crossover (main line crosses above signal)
Returns: (bool) True on bullish crossover
bearish_crossover()
Detect bearish crossover (main line crosses below signal)
Returns: (bool) True on bearish crossover
AMFResult
AMF calculation results
Fields:
main_oscillator (series float) : The main AMF oscillator value (-100 to 100)
signal_line (series float) : The signal line for crossover signals
dema_fast (series float) : Fast adaptive DEMA value
dema_medium (series float) : Medium adaptive DEMA value
dema_slow (series float) : Slow adaptive DEMA value
volume_analysis (series float) : Volume-based buying/selling pressure (-100 to 100)
adaptive_lookback (series int) : Current adaptive lookback length
volatility_ratio (series float) : Current volatility ratio vs average

AllMA Trend Radar [trade_lexx]📈 AllMA Trend Radar is your universal trend analysis tool!
📊 What is AllMA Trend Radar?
AllMA Trend Radar is a powerful indicator that uses various types of Moving Averages (MA) to analyze trends and generate trading signals. The indicator allows you to choose from more than 30 different types of moving averages and adjust their parameters to suit your trading style.
💡 The main components of the indicator
📈 Fast and slow moving averages
The indicator uses two main lines:
- Fast MA (blue line): reacts faster to price changes
- Slow MA (red line): smoother, reflects a long-term trend
The combined use of fast and slow MA allows you to get trend confirmation and entry/exit points from the market.
🔄 Wide range of moving averages
There are more than 30 types of moving averages at your disposal:
- SMA: Simple moving average
- EMA: Exponential moving average
- WMA: Weighted moving average
- DEMA: double exponential MA
- TEMA: triple exponential MA
- HMA: Hull Moving Average
- LSMA: Moving average of least squares
- JMA: Eureka Moving Average
- ALMA: Arnaud Legoux Moving Average
- ZLEMA: moving average with zero delay
- And many others!
🔍 Indicator signals
1️⃣ Fast 🆚 Slow MA signals (intersection and ratio of fast and slow MA)
Up/Down signals (intersection)
- Buy (Up) signal:
- What happens: the fast MA crosses the slow MA from bottom to top
- What does the green triangle with the "Buy" label under the candle look
like - What does it mean: a likely upward trend reversal or an uptrend strengthening
- Sell signal (Down):
- What happens: the fast MA crosses the slow MA from top to bottom
- What does it look like: a red triangle with a "Sell" mark above the candle
- What does it mean: a likely downtrend reversal or an increase in the downtrend
Greater/Less signals (ratio)
- Buy signal (Greater):
- What happens: the fast MA becomes higher than the slow MA
- What does it look like: a green triangle with a "Buy" label under the candle
- What does it mean: the formation or confirmation of an uptrend
- Sell signal (Less):
- What happens: the fast MA becomes lower than the slow MA
- What does it look like: a red triangle with a "Sell" mark above the candle
- What does it mean: the formation or confirmation of a downtrend
2️⃣ Signals ⚡️ Fast MA (fast MA and price)
Up/Down signals (intersection)
- Buy signal (Up Fast):
- What happens: the price crosses the fast MA from bottom to top
- What does it look like: a green triangle with a "Buy" label under the candle
- What does it mean: a short-term price growth signal
- Sell signal (Down Fast):
- What happens: the price crosses the fast MA from top to bottom
- What does it look like: a red triangle with a "Sell" label above the candle
- What does it mean: a short-term price drop signal
Greater/Less signals (ratio)
- Buy signal (Greater Fast):
- What happens: the price is getting higher than the fast MA
- What does it look like: a green triangle with a "Buy" label under the candle
- What does it mean: the price is above the fast MA, which indicates an upward movement
- Sell signal (Less Fast):
- What happens: the price is getting lower than the fast MA
- What does it look like: a red triangle with a "Sell" mark above the candle
- What does it mean: the price is under the fast MA, which indicates a downward movement
3️⃣ Signals 🐢 Slow MA (slow MA and price)
Up/Down signals (intersection)
- Buy signal (Up Slow):
- What happens: the price crosses the slow MA from bottom to top
- What does it look like: a green triangle with a "Buy" label under the candle
- What does it mean: a potential medium-term upward trend reversal
- Sell signal (Down Slow):
- What happens: the price crosses the slow MA from top to bottom
- What does it look like: a red triangle with a "Sell" label above the candle
- What does it mean: a potential medium-term downward trend reversal
Greater/Less signals (ratio)
- Buy signal (Greater Slow):
- What happens: the price is getting above the slow MA
- What does it look like: a green triangle with a "Buy" label under the candle
- What does it mean: the price is above the slow MA, which indicates a strong upward movement
- Sell signal (Less Slow):
- What is happening: the price is getting below the slow MA
- What does it look like: a red triangle with a "Sell" mark above the candle
- What does it mean: the price is under the slow MA, which indicates a strong downward movement
🛠 Filters to filter out false signals
1️⃣ Minimum distance between the signals
- What it does: sets the minimum number of candles between signals of the same type
- Why it is needed: it prevents the appearance of too frequent signals, especially during periods of high volatility
- How to set it up: Set a different value for each signal type (default: 3-5 bars)
- Example: if the value is 3 for Up/Down signals, after the buy signal appears, the next buy signal may appear no earlier than 3 bars later
2️⃣ Advanced indicator filters
🔍 RSI Filter
- What it does: Checks the Relative Strength Index (RSI) value before generating a signal
- Why it is needed: it helps to avoid countertrend entries and catch reversal points
- How to set up:
- For buy signals (🔋 Buy): set the RSI range, usually in the oversold zone (for example, 1-30)
- For sell signals (🪫 Sell): set the RSI range, usually in the overbought zone (for example, 70-100)
- Example: if the RSI = 25 (in the range 1-30), the buy signal will be confirmed
📊 MFI Filter (Cash Flow Index)
- What it does: analyzes volumes and the direction of price movement
- Why it is needed: confirms signals with data on the activity of cash flows
- How to set up:
- For buy signals (🔋 Buy): set the MFI range in the oversold zone (for example, 1-25)
- For sell signals (🪫 Sell): set the MFI range in the overbought zone (for example, 75-100)
- Example: if MFI = 80 (in the range of 75-100), the sell signal will be confirmed
📈 Stochastic Filter
- What it does: analyzes the position of the current price relative to the price range
- Why it is needed: confirms signals based on overbought/oversold conditions
- How to configure:
- You can configure the K Length, D Length and Smoothing parameters
- For buy signals (🔋 Buy): set the stochastic range in the oversold zone (for example, 1-20)
- For sell signals (🪫 Sell): set the stochastic range in the overbought zone (for example, 80-100)
- Example: if stochastic = 15 (is in the range of 1-20), the buy signal will be confirmed
🔌 Connecting to trading strategies
The indicator provides various connectors to connect to your trading strategies.:
1️⃣ Individual connectors for each type of signal
- 🔌Fast vs Slow Up/Down MA Signal🔌: signals for the intersection of fast and slow MA
- 🔌Fast vs Slow Greater/Less MA Signal🔌: signals of the ratio of fast and slow MA
- 🔌Fast Up/Down MA Signal🔌: signals of the intersection of price and fast MA
- 🔌Fast Greater/Less MA Signal🔌: signals of the ratio of price and fast MA
- 🔌Slow Up/Down MA Signal🔌: signals of the intersection of price and slow MA
- 🔌Slow Greater/Less MA Signal🔌: Price versus slow MA signals
2️⃣ Combined connectors
- 🔌Combined Up/Down MA Signal🔌: combines all the crossing signals (Up/Down)
- 🔌Combined Greater/Less MA Signal🔌: combines all the signals of the ratio (Greater/Less)
- 🔌Combined All MA Signals🔌: combines all signals (Up/Down and Greater/Less)
❗️ All connectors return values:
- 1: buy signal
- -1: sell signal
- 0: no signal
📚 How to start using AllMA Trend Radar
1️⃣ Selection of types of moving averages
- Add an indicator to the chart
- Select the type and period for the fast MA (default: DEMA with a period of 14)
- Select the type and period for the slow MA (default: SMA with a period of 14)
- Experiment with different types of MA to find the best combination for your trading style
2️⃣ Signal settings
- Turn on the desired signal types (Up/Down, Greater/Less)
- Set the minimum distance between the signals
- Activate and configure the necessary filters (RSI, MFI, Stochastic)
3️⃣ Checking on historical data
- Analyze how the indicator works based on historical data
- Pay attention to the accuracy of the signals and the presence of false alarms
- Adjust the settings if necessary
4️⃣ Introduction to the trading strategy
- Decide which signals will be used to enter the position.
- Determine which signals will be used to exit the position.
- Connect the indicator to your trading strategy through the appropriate connectors
🌟 Practical application examples
Scalping strategy
- Fast MA: TEMA with a period of 8
- Slow MA: EMA with a period of 21
- Active signals: Fast MA Up/Down
- Filters: RSI (range 1-40 for purchases, 60-100 for sales)
- Signal spacing: 3 bars
Strategy for day trading
- Fast MA: TEMA with a period of 10
- Slow MA: SMA with a period of 20
- Active signals: Fast MA Up/Down and Fast vs Slow Greater/Less
- Filters: MFI (range 1-25 for purchases, 75-100 for sales)
- Signal spacing: 5 bars
Swing Trading Strategy
- Fast MA: DEMA with a period of 14
- Slow MA: VWMA with a period of 30
- Active signals: Fast vs Slow Up/Down and Slow MA Greater/Less
- Filters: Stochastic (range 1-20 for purchases, 80-100 for sales)
- Signal spacing: 8 bars
A strategy for positional trading
- Fast MA: HMA with a period of 21
- Slow MA: SMA with a period of 50
- Active signals: Slow MA Up/Down and Fast vs Slow Greater/Less
- Filters: RSI and MFI at the same time
- The distance between the signals: 10 bars
💡 Tips for using AllMA Trend Radar
1. Select the types of MA for market conditions:
- For trending markets: DEMA, TEMA, HMA (fast MA)
- For sideways markets: SMA, WMA, VWMA (smoothed MA)
- For volatile markets: KAMA, AMA, VAMA (adaptive MA)
2. Combine different types of signals:
- Up/Down signals work better when moving from a sideways trend to a directional
one - Greater/Less signals are optimal for fixing a stable trend
3. Use filters effectively:
- The RSI filter works great in trending markets
- MFI filter helps to confirm the strength of volume movement
- Stochastic filter works well in lateral ranges
4. Adjust the minimum distance between the signals:
- Small values (2-3 bars) for short-term trading
- Average values (5-8 bars) for medium-term trading
- Large values (10+ bars) for long-term trading
5. Use combination connectors:
- For more reliable signals, connect the indicator through the combined connectors
💰 With the AllMA Trend Radar indicator, you get a universal trend analysis tool that can be customized for any trading style and timeframe. The combination of different types of moving averages and advanced filters allows you to significantly improve the accuracy of signals and the effectiveness of your trading strategy!

Seasonality - Session Performance - Morning Afternoon EveningUse this indicator on Intraday Timeframe. Higher the timeframe, more the data
This script calculates the performance of an instrument for different sessions.
Session inputs can be updated to study performance of
- Morning vs Afternoon vs Evening
- Pre-Market vs Market vs Post-Market (provided the data feed supports pre and post market)
- Overnight vs Intraday
Three session inputs are provided to tweak the session range
Performance is calculated as session close / session open - 1
Session timeframes can be set for various countries. Make sure the session timeframe aligns with the Candle open/close for the timeframe you choose. Some examples below
US Markets: 0930-1130 1130-1430 1430-1630 Timeframe 1 hour
India Markets: 0915-1030 1030-1415 1415-15:30 Timeframe 75min
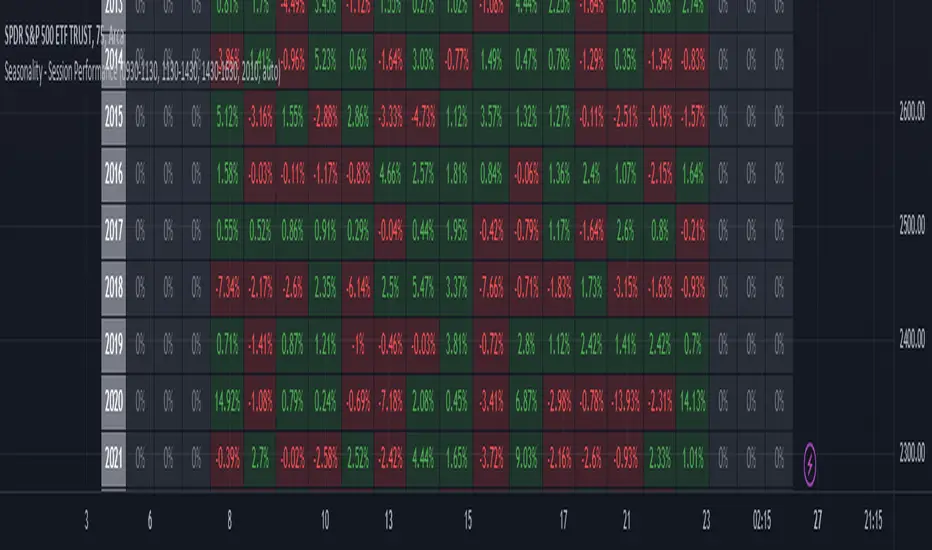
TASC 2022.10 RS VA EMA█ OVERVIEW
TASC's October 2022 edition Traders' Tips includes the second part of the "Relative Strength Moving Averages" article series authored by Vitali Apirine. This is the code that implements the Relative Strength Volume-Adjusted Exponential Moving Average (RS VA EMA) presented in this publication.
█ CONCEPTS
In his article series, the author argues that the relative strength of price, volume, and volatility can potentially be used to filter price movements and define turning points. In particular, the RS VA EMA indicator is designed to account for the relative strength of volume. Like the traditional exponential moving average (EMA) , it is a lagging trend-following indicator. The difference is that it responds more quickly.
In a trading strategy, RS VA EMA is suggested to be used in combination with EMA of the same length to determine the overall trend or in combination with RS VA EMA of a different length to identify turning points and filter price movements.
█ CALCULATIONS
The calculation of RS VA EMA is based on the concept of volume strength (VS). By definition, VS measures the difference between "positive" and "negative" volume flow. Volume is indicated as "positive" when the close is higher than the previous close and "negative" when the close is below the previous close.
The following steps are used in the calculation process:
• Calculate the volume strength (VS) of a given length.
• Multiply VS by a predefined multiplier and calculate the EMA of the resulting time series.
The values of 10,10,10 are the typical input settings for RS VA EMA, where the first parameter is the length of the moving average, the second is the length of VS, and the third is the volume strength multiplier.
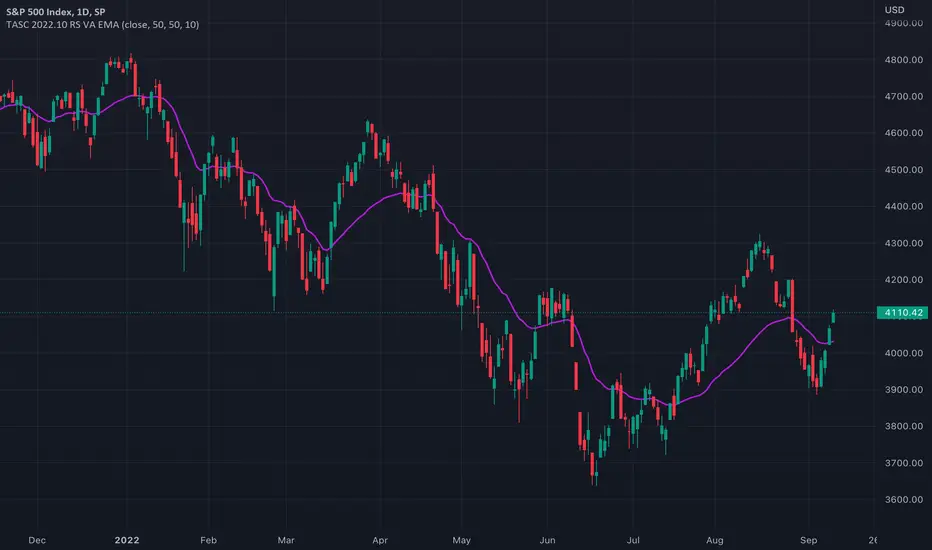
Strategy Oil Z ScoreObjective is to find forward looking indicators to find good entries into major index's.
In similar vein to my Combo Z Score script I have implemented one looking at oil and oil volatility. Interestingly the script out performs WITHOUT applying the EMA in longer timeframes but under performs in shorter timeframes, for example 2007 vs 2019. Likely due to the bullish nature of the past decade (by and large). You have some options on the underlying included Oil vs OVX (Best), MOVE vs OVX and VIX vs OVX. Oil vs OVX out performs Combo Z Script. Favours Spy over QQQ or derivations (SPXL etc).

GBTC holdings USD market valueThis script estimates GBTC bitcoins per share, rather than hardcoding as in other scripts. Its result is an estimate of GBTC holdings USD market value.
Per share bitcoin estimates are adjusted by 2.0% / 365 per day from 2019 year end holdings. Calendar year 2019 ending bitcoins and shares were 261,192 bitcoins and 269,445,300 shares. From the 2019 Form 10-K: 'The Trust’s only ordinary recurring expense is the Sponsor’s Fee. The Sponsor’s Fee accrues daily in U.S. dollars at an annual rate of 2.0% of the Bitcoin Holdings.. The Sponsor’s Fee is payable in Bitcoins to the Sponsor monthly in arrears.'
No attempt is made to account for leap years.
Per share bitcoin estimate is converted to USD market value by multiplying by the simple average BTCUSD price at Coinbase and Bitstamp. Grayscale uses the TradeBlock XBX index, a volume weighted average of Coinbase Pro, Kraken, LMAX Digital and Bitstamp prices.
Spot checks vs archive.org captures of daily bitcoins per share and the chart on Grayscale's site:
The estimate for market close January 22 2021 is 0.00094899 bitcoins per share, the published datum on Grayscale's web site was 0.00094898. The estimate matches at 20:30 rather than at 16:00.
The estimate for December 31 2018 is 0.000988965 vs a published 0.00098895.
The estimate for December 29 2017 market value is $14.58 vs $14.65.
The estimate for December 30 2016 market value is $0.99 vs $0.98.
The estimate for January 4 2016 market value is $0.46 vs $0.45.
No estimates before 2016.
The default style is to draw a blue line with two thirds transparency outside market hours and for first/last minutes of trading, switching to daily or greater periodicity hides this.
No warranty is expressed or implied , I am not a lawyer, etc etc etc.
This is not investing advice . Always do your own due diligence .

Market Internals [Makit0] MARKET INTERNALS INDICATOR v0.5beta
Market Internals are suitable for day trade equity indices, named SPY or /ES, please do your own research about what they are and how to use them
This scripts plots the NYSE market internals charts as an indicator for an easy and full visualization of market internal structure all in one chart, useful for SPY and /ES trading
Description of the Market Internals
- TICK: NYSE stocks ticking up vs stocks ticking down, extreme values may point to trend continuation on trending days or reversal in non trending days, example of extreme values can be 800 and 1000
- ADD: NYSE stocks going up vs stocks going down, if price auctions around the zero line may be a non trend day, otherwise may be a trend day
- VOLD: NYSE volume of stocks up vs volume of stocks going down, identify clearly where the volume is going, as example if volume is flowing down may be a good idea no to place longs
- TRIN: NYSE up stocks vs down stocks ratio divided by up volume vs down volume ratio. A value of 1 indicates parity, below that the strength is on the long side, above the strength is in the short side.
A basic use of market internals may be looking for divergences, for example:
- /ES is trading in a range but ADD and VOLD are trending up nonstop, may /ES will break the range to the upside
- /ES is trading in a range and ADD and VOLD are trading around the zero line but got an extreme reading on TICK, may be a non trending day and the TICK extreme reading is at one of the extremes of the /ES range, may be a good probability trade to fade that move
- /ES is trading in a trend to the downside, ADD and VOLD too, you catch a good portion of the move but are fearful to flat and miss more gains, you see in the TICK a lot of extreme values below -800 so your're confident in the continuation of the downtrend, until the TICK goes beyond -1000 and you use that signal to go flat
Market internals give you context and confirmation, price in /ES may be trending but if market internals do not confirm the move may a reversal is on its way
Price is an advertise, you can see the real move in the structure below, in the behavior of the individual components of the market, those are the real questions:
- How many stocks are going up/down (ADD)
- How many volume is flowing up/down (VOLD)
- How many stocks are ticking up/down (TICK)
- What is the overall volume breath of the market (TRIN)
FEATURES:
- Plot one of the four basic market internal indices: TICK, ADD, VOLD and TRIN
- Show labels with values beyond an user defined threshold
- Show ZERO line
- Show user defined Dotted and Dashed lines
- Show user defined moving average
SETTINGS:
- Market internal: ticker to plot in the indicator, four options to choose from (TICK, ADD, VOLD and TRIN)
- Labels threshold: all values beyond this will be ploted as labels
- Dot lines at: two dotted lines will be plotted at this value above and below the zero line
- Dash lines at: two dashed lines will be plotted at this value above and below the zero line
- MA type: two options avaiable SMA (Simple Moving Average) or EMA (Exponential Moving Average)
- MA length: number of bars to calculate the moving average
- Show zero line: show or hide zero line
- Show dot line: show or hide dotted lines
- Show dash line: show or hide dashed lines
- Show labels: show or hide labels
GOOD LUCK AND HAPPY TRADING

JOPA Channel (Dual-Volumed) v1 [JopAlgo]JOPA Channel (Dual-Volumed) v1
Short title: JOPAV1 • License: MPL-2.0 • Provider: JopAlgo
We have developed our own, first channel-based trading indicator and we’re making it available to all traders. The goal was a channel that breathes with the tape—built on a volume-weighted backbone—so the outcome stays lively instead of static. That led to the JOPA Channel.
All important features (at a glance)
In one line: A Rolling-VWAP channel whose width adapts with two volumes (RVOL + dollar-flow), adds order-flow asymmetry (OBV tilt) and regime awareness (Efficiency Ratio), and frames risk with outer containment bands from residual extremes—so you see fair value, momentum, and exhaustion in one view.
Feature list
Rolling VWAP centerline: Tracks where volume traded (fair value).
Dual-volume width: Bands expand/contract with relative volume and value traded (price×volume).
OBV tilt: Upper/lower widths skew toward the side actually pushing.
Regime adapter (ER): Tighter in trend, wider in chop—automatically.
Outer containment rails: Residual-extreme ceilings/floors, smoothed + margin.
20% / 80% guides: 20% light blue (discount), 80% light red (premium).
Squeeze dots (optional): Orange circles below candles during compression.
Non-repainting: Uses rolling sums and past-only math; no lookahead.
Default visual in this release
Containment rails + fill: ON (stepline, medium).
Inner Value rails + fill: Rails OFF (stepline, thin), fill ON (drawn only if rails are shown).
20% & 80% guides: ON (dashed, thin; 20% light blue, 80% light red).
Squeeze dots: OFF by default (orange circles when enabled).
What you see on the chart
RVWAP (centerline): Your compass for fair value.
Inner Value Bands (optional): Tight rails for breakouts and pullback timing.
Outer Containment Bands (default ON): High-confidence ceilings/floors for targets and fades.
20% / 80% guides: Quick read of “where in the channel” price is sitting.
Squeeze dots (optional): Volatility compression heads-up (no text labels).
Non-repainting note: The indicator does not revise closed bars. Forecast-Lock uses linear regression to extrapolate 1–3 bars ahead without using future data.
How to use it
Core reads (works on any timeframe)
Bias: Above a rising RVWAP → long bias; below a falling RVWAP → short bias.
Breakouts (momentum): Close beyond an Inner Value rail with RVOL ≥ threshold (alert provided).
Reversions (fades): Tag Outer Containment, stall, then close back inside → expect mean reversion toward RVWAP.
20/80 timing:
At/above 80% (light red) → premium/exhaustion risk; trim longs or consider fades if RVOL cools.
At/below 20% (light blue) → discount/exhaustion risk; trim shorts or consider longs if RVOL cools.
Squeeze clusters: When dots bunch up, expect a range break; use the Breakout alert as confirmation.
Playbooks by trading style
Day Trading (1–5m)
Setup: Keep the chart clean (Containment ON, Value rails OFF). Toggle Inner Value ON when hunting a breakout or timing a pullback.
Pullback Long: Dip to RVWAP / Lower Value with sub-threshold RVOL, then a close back above RVWAP → long.
Stop: Just beyond Lower Containment or the pullback swing.
Targets (1:1:1): ⅓ at RVWAP, ⅓ at Upper Value, ⅓ trail toward Upper Containment.
Breakout Long: After a squeeze cluster, take the Breakout Long alert (close > Upper Value, RVOL ≥ min). If no retest, demand the next bar holds outside.
Range Fade: Only when RVWAP is flat and dots cluster; short Upper Containment → RVWAP (mirror for longs at the lower rail).
Intraday (15m–1H)
HTF compass: Take bias from 4H.
Pullback Long: “Touch & reclaim” of RVWAP while RVOL cools; enter on the reclaim close or break of that candle’s high.
Breakout: Run Inner Value ON; act on Breakout alerts (RVOL gate ≈ 1.10–1.15 typical).
Avoid low-probability fades against the 4H slope unless RVWAP is flat.
Swing (4H–1D)
Continuation: In uptrends, buy pullbacks to RVWAP / Lower Value with sub-threshold RVOL; scale at Upper Containment.
Adds: Post-squeeze Breakout Long adds; trail on RVWAP or Lower Value.
Fades: Prefer when RVWAP flattens and price oscillates between containments.
Position (1D+)
Framework: Daily RVWAP slope + position within containment.
Add rule: Each reclaim of RVWAP after a dip is an add; trim into Upper Containment or near 80% light red.
Sizing: Containment distance is larger—size down and trail on RVWAP.
Inputs & Settings (complete)
Core
Source: Price input for RVWAP.
Rolling VWAP Length: Window of the centerline (higher = smoother).
Volume Baseline (RVOL): SMA window for relative volume.
Inner Value Bands (volatility-based width)
k·StdDev(residuals), k·ATR, k·MAD(residuals): Blend three measures into base width.
StdDev / ATR / MAD Lengths: Lookbacks for each.
Two-Volume Fusion
RVOL Exponent: How aggressively width responds to relative volume.
Dollar-Flow Gain: Adds push from price×volume (value traded).
Dollar-Flow Z-Window: Standardization window for dollar-flow.
Asymmetry (Order-Flow Tilt)
Enable Tilt (OBV): Lets flow skew upper/lower widths.
Tilt Strength (0..1): Gain applied to OBV slope z-score.
OBV Slope Z-Window: Window to standardize OBV slope.
Regime Adapter
Efficiency Ratio Lookback: Measures trend vs chop.
ER Width Min/Max: Maps ER into a width factor (tighter in trend, wider in chop).
Band Tracking (inner value rails)
Tracking Mode:
Base: Pure base rails.
Parallel-Lock: Smooth RVWAP & width; track in parallel.
Slope-Lock: Adds a fraction of recent slope (momentum-friendly).
Forecast-Lock: 1–3 bar extrapolation via linreg (non-repainting on closed bars).
Attach Strength (0..1): Blend tracked rails vs base rails.
Tracking Smooth Length: EMA smoothing of RVWAP and width.
Slope Influence / Forecast Lead Bars: Gains for the chosen mode.
Outer Containment Bands
Show Containment Bands: Master toggle (default ON).
Residual Extremes Lookback: Highest/lowest residual window.
Extreme Smoothing (EMA): Stability on extreme lines.
Margin vs inner width: Extra padding relative to smoothed inner width.
Squeeze & Alerts
Squeeze Window / Threshold: Width vs average; at/under threshold = dot (when enabled).
Min RVOL for Breakout: Required RVOL for breakout alerts.
Style (defaults in this release)
Inner Value rails: OFF (stepline, thin).
Inner & Containment fills: ON.
Containment rails: ON (stepline, medium).
20% / 80% guides: ON — 20% light blue, 80% light red, dashed, thin.
Squeeze dots: OFF by default (orange circles below candles when enabled).
Practical templates (copy/paste into a plan)
Momentum Breakout
Context: Squeeze cluster near RVWAP; Inner Value ON.
Trigger: Breakout Long (close > Upper Value & RVOL ≥ min).
Stop: Below Lower Value (tight) or below RVWAP (safer).
Targets (1:1:1): ⅓ Value → ⅓ Containment → ⅓ trail on RVWAP.
Pullback Continuation
Context: Uptrend; dip to RVWAP / Lower Value with cooling RVOL.
Trigger: Close back above RVWAP or break of reclaim candle’s high.
Stop: Just outside Lower Containment or pullback swing.
Targets: RVWAP → Upper Value → Upper Containment.
Containment Reversion (range)
Context: RVWAP flat; repeated containment tags.
Trigger: Stall at containment, then close back inside.
Stop: A step beyond that containment.
Target: RVWAP; runner only if RVOL stays muted.
Alerts included
DVWAP Breakout Long / Short (Value Bands)
Top Zone / Bottom Zone (20% / 80% guides)
Tip: On lower TFs, act on Breakout alerts with higher-TF bias (e.g., trade 5–15m in the direction of 1H/4H RVWAP slope/position).
Best practices
Let RVWAP be the compass; if unsure, wait until price picks a side.
Respect RVOL; low-RVOL breaks are prone to fail.
Use guides for timing, not certainty. Pair 20/80 zones with flow context.
Start with defaults; change one knob at a time.
Common pitfalls
Fading every containment touch → only fade when RVWAP is flat or RVOL cools.
Over-tuning inputs → the defaults are robust; small tweaks go a long way.
Fighting the higher timeframe on low TFs → expensive habit.
Footer — License & Publishing
License: Mozilla Public License 2.0 (MPL-2.0). You may modify and redistribute; keep this file under MPL and provide source for this file.
Originality: © 2025 JopAlgo. No third-party code reused; Pine built-ins and common formulas only.
Publishing: Keep this header/description intact when releasing on TradingView. Avoid promotional links in the public script text.

Risk-On / Risk-Off CompositeReal-time Risk-On / Risk-Off Composite from your four ratios:
SPY / TLT (equities vs long bonds)
HYG / LQD (high-yield vs IG credit)
HG / GOLD (copper vs gold)
BTC / GOLD (speculative vs defensive)
It:
normalizes each ratio with a z-score (so they’re comparable),
lets you weight them,
plots a composite line + histogram (up = risk-on, down = risk-off),
shows a small heat-table for each sub-signal,
and includes alert conditions for Risk-On / Risk-Off flips.

Trend Telescope v4 Basic Configuration
pine
// Enable only the components you need
Order Flow: ON
Delta Volume: ON
Volume Profile: ON
Cumulative Delta: ON
Volatility Indicator: ON
Momentum Direction: ON
Volatility Compression: ON
📊 Component Breakdown
1. Order Flow Analysis
Purpose: Identifies buying vs selling pressure
Visual: Histogram (Green=Buying, Red=Selling)
Calculation: Volume weighted by price position
Usage: Spot institutional order blocks
2. Delta Volume Values
Purpose: Shows volume imbalance
Bull Volume (Green): Volume on up bars
Bear Volume (Red): Volume on down bars
Usage: Identify volume divergences
3. Anchored Volume Profile
Purpose: Finds high-volume price levels
POC (Point of Control): Price with highest volume
Profile Length: Adjustable (default: 50 bars)
Usage: Identify support/resistance zones
4. Cumulative Volume Delta
Purpose: Tracks net buying/selling pressure over time
Trend Analysis: Rising=Buying pressure, Falling=Selling pressure
Divergence Detection: Price vs Delta divergences
Usage: Confirm trend strength
5. Volatility Indicator
Purpose: Measures market volatility with cycle detection
Volatility Ratio: ATR as percentage of price
Volatility Cycle: SMA of volatility (identifies periods)
Histogram: Difference between current and average volatility
Usage: Adjust position sizing, identify breakout setups
6. Real-time Momentum Direction
Purpose: Multi-factor momentum assessment
Components: Price momentum (50%), RSI momentum (30%), Volume momentum (20%)
Visual: Line plot with color coding
Labels: Clear BULLISH/BEARISH/NEUTRAL signals
Usage: Trend confirmation, reversal detection
7. Volatility Compression Analysis
Purpose: Identifies low-volatility consolidation periods
Compression Detection: True Range below threshold
Strength Meter: How compressed the market is
Histogram: Red when compressed, Gray when normal
Usage: Predict explosive moves, prepare for breakouts
⚙️ Advanced Configuration
Optimal Settings for Different Timeframes
pine
// Scalping (1-15 min)
Profile Length: 20
ATR Period: 10
Momentum Length: 8
Compression Threshold: 0.3
// Day Trading (1H-4H)
Profile Length: 50
ATR Period: 14
Momentum Length: 14
Compression Threshold: 0.5
// Swing Trading (Daily)
Profile Length: 100
ATR Period: 20
Momentum Length: 21
Compression Threshold: 0.7
Alert Setup Guide
Enable "Enable Alerts" in settings
Choose alert types:
Momentum Alerts: When momentum changes direction
Compression Alerts: When volatility compression begins
Set alert frequency to "Once Per Bar"
Configure notification preferences
🎯 Trading Strategies
Strategy 1: Compression Breakout
pine
Entry Conditions:
1. Volatility Compression shows RED histogram
2. Cumulative Delta trending upward
3. Momentum turns BULLISH
4. Price breaks above POC level
Exit: When Momentum turns BEARISH or Compression ends
Strategy 2: Momentum Reversal
pine
Entry Conditions:
1. Strong Order Flow in opposite direction
2. Momentum divergence (price makes new high/low but momentum doesn't)
3. Volume confirms the reversal
Exit: When Order Flow returns to trend direction
Strategy 3: Institutional Accumulation
pine
Identification:
1. High Cumulative Delta but flat/sideways price
2. Consistent Order Flow in one direction
3. Volume Profile shows accumulation at specific levels
Trade: Enter in direction of Order Flow when price breaks level
📈 Interpretation Guide
Bullish Signals
✅ Order Flow consistently green
✅ Cumulative Delta making higher highs
✅ Momentum above zero and rising
✅ Bull Volume > Bear Volume
✅ Price above POC level
Bearish Signals
✅ Order Flow consistently red
✅ Cumulative Delta making lower lows
✅ Momentum below zero and falling
✅ Bear Volume > Bull Volume
✅ Price below POC level
Caution Signals
⚠️ Momentum divergence (price vs indicator)
⚠️ Volatility compression (potential big move coming)
⚠️ Mixed signals across components
🔧 Troubleshooting
Common Issues & Solutions
Problem: Indicators not showing
Solution: Check "Show on Chart" is enabled
Problem: Alerts not triggering
Solution: Verify alert is enabled in both script and TradingView alert panel
Problem: Performance issues
Solution: Reduce number of enabled components or increase timeframe
Problem: Volume Profile not updating
Solution: Adjust Profile Length setting, ensure sufficient historical data
Performance Optimization
Disable unused components
Increase chart timeframe
Reduce historical bar count
Use on lower timeframes with fewer indicators enabled
💡 Pro Tips
Risk Management
Use Volatility Indicator for position sizing
Monitor Cumulative Delta for trend confirmation
Use POC levels for stop-loss placement
Multi-Timeframe Analysis
Use higher timeframe for trend direction
Use current timeframe for entry timing
Correlate signals across timeframes
Market Condition Adaptation
Trending Markets: Focus on Momentum + Order Flow
Ranging Markets: Focus on Volume Profile + Compression
High Volatility: Use smaller position sizes
Low Volatility: Prepare for compression breakouts
📚 Educational Resources
Key Concepts to Master
Volume-price relationships
Market microstructure
Institutional order flow
Volatility regimes
Momentum vs mean reversion
Recommended Learning Path
Start with Order Flow + Momentum only
Add Volume Profile once comfortable
Incorporate Volatility analysis
Master multi-component correlation
🆘 Support
Getting Help
Check component toggles are enabled
Verify sufficient historical data is loaded
Test on major pairs/indices first
Adjust settings for your trading style
Continuous Improvement
Backtest strategies thoroughly
Keep a trading journal
Adjust parameters based on market conditions
Combine with price action analysis
Remember: No indicator is perfect. Use this tool as part of a comprehensive trading plan with proper risk management. Always test strategies in demo accounts before live trading.
Happy Trading! 📈
