Long/Short (Corr+Trend+RSI+ADX)Purpose
This indicator outputs a single trading regime — LONG ONLY, SHORT ONLY, or NEUTRAL — using a weighted model that blends: correlation to Bitcoin, local trend (EMA cross), RSI state, and trend strength via ADX (+DI/−DI). The goal is to cut market noise and provide a clear directional bias.
How it Works
Corr × BTC — Computes return correlation to BTC and multiplies it by BTC’s trend direction (EMA50 vs EMA200). Positively correlated assets follow BTC’s bias; negatively correlated assets invert it.
Trend — Local trend of the asset via EMA(50) vs EMA(200).
RSI — Soft mapping into bearish/neutral/bullish contribution (above the upper band → bullish, below the lower band → bearish).
ADX Block — Trend strength and bias from +DI/−DI (implemented manually via DM/TR/RMA).
All components are weighted and summed into a score; thresholds map the score to the trading regime.
Signals & Visuals
LONG ONLY — subtle green background; up-arrow on regime change.
SHORT ONLY — subtle red background; down-arrow on regime change.
NEUTRAL — muted background, no arrows.
Compact dashboard (top-right) shows regime, total score, and each component’s contribution.
Key Inputs
Benchmark (BTC) — symbol used for correlation (default: BTCUSDT).
Correlation length — window for return correlation.
EMA fast / EMA slow — trend parameters (defaults: 50/200).
RSI period / upper / lower — RSI settings and zone thresholds.
ADX period / threshold — strength measurement parameters.
Weights — per-block influence (Corr, Trend, RSI, ADX).
Decision thresholds — score cutoffs for LONG/SHORT.
Alerts
Go LONG (new signal) — regime flips into LONG.
Go SHORT (new signal) — regime flips into SHORT.
Back to NEUTRAL — regime returns to neutral.
(Define your alert message in the Alerts dialog.)
Usage Guidance
Trade in the direction of the active regime:
LONG ONLY — favor long entries/re-entries; avoid shorts.
SHORT ONLY — favor shorts; avoid longs.
NEUTRAL — reduce risk and wait for confirmation.
Combine with S/R or consolidation zones: trigger entries only when price interacts with your zones in alignment with the regime.
For altcoins, tune weights and thresholds; high-beta markets may need lower decision thresholds.
Tuning Tips
Want more signals? Lower Go LONG/SHORT thresholds or increase weights.
Want stricter signals? Raise thresholds or reduce weights.
If the asset weakly correlates with BTC, reduce Corr weight and emphasize Trend/ADX.
Limitations & Disclaimer
This is a directional filter, not a full trade system. Always apply risk management and confirm on multiple timeframes. Past performance does not guarantee future results.
Recherche dans les scripts pour "香港市場主線股票市值小於200億"

Historical Matrix Analyzer [PhenLabs]📊Historical Matrix Analyzer
Version: PineScriptv6
📌Description
The Historical Matrix Analyzer is an advanced probabilistic trading tool that transforms technical analysis into a data-driven decision support system. By creating a comprehensive 56-cell matrix that tracks every combination of RSI states and multi-indicator conditions, this indicator reveals which market patterns have historically led to profitable outcomes and which have not.
At its core, the indicator continuously monitors seven distinct RSI states (ranging from Extreme Oversold to Extreme Overbought) and eight unique indicator combinations (MACD direction, volume levels, and price momentum). For each of these 56 possible market states, the system calculates average forward returns, win rates, and occurrence counts based on your configurable lookback period. The result is a color-coded probability matrix that shows you exactly where you stand in the historical performance landscape.
The standout feature is the Current State Panel, which provides instant clarity on your active market conditions. This panel displays signal strength classifications (from Strong Bullish to Strong Bearish), the average return percentage for similar past occurrences, an estimated win rate using Bayesian smoothing to prevent small-sample distortions, and a confidence level indicator that warns you when insufficient data exists for reliable conclusions.
🚀Points of Innovation
Multi-dimensional state classification combining 7 RSI levels with 8 indicator combinations for 56 unique trackable market conditions
Bayesian win rate estimation with adjustable smoothing strength to provide stable probability estimates even with limited historical samples
Real-time active cell highlighting with “NOW” marker that visually connects current market conditions to their historical performance data
Configurable color intensity sensitivity allowing traders to adjust heat-map responsiveness from conservative to aggressive visual feedback
Dual-panel display system separating the comprehensive statistics matrix from an easy-to-read current state summary panel
Intelligent confidence scoring that automatically warns traders when occurrence counts fall below reliable thresholds
🔧Core Components
RSI State Classification: Segments RSI readings into 7 distinct zones (Extreme Oversold <20, Oversold 20-30, Weak 30-40, Neutral 40-60, Strong 60-70, Overbought 70-80, Extreme Overbought >80) to capture momentum extremes and transitions
Multi-Indicator Condition Tracking: Simultaneously monitors MACD crossover status (bullish/bearish), volume relative to moving average (high/low), and price direction (rising/falling) creating 8 binary-encoded combinations
Historical Data Storage Arrays: Maintains rolling lookback windows storing RSI states, indicator states, prices, and bar indices for precise forward-return calculations
Forward Performance Calculator: Measures price changes over configurable forward bar periods (1-20 bars) from each historical state, accumulating total returns and win counts per matrix cell
Bayesian Smoothing Engine: Applies statistical prior assumptions (default 50% win rate) weighted by user-defined strength parameter to stabilize estimated win rates when sample sizes are small
Dynamic Color Mapping System: Converts average returns into color-coded heat map with intensity adjusted by sensitivity parameter and transparency modified by confidence levels
🔥Key Features
56-Cell Probability Matrix: Comprehensive grid displaying every possible combination of RSI state and indicator condition, with each cell showing average return percentage, estimated win rate, and occurrence count for complete statistical visibility
Current State Info Panel: Dedicated display showing your exact position in the matrix with signal strength emoji indicators, numerical statistics, and color-coded confidence warnings for immediate situational awareness
Customizable Lookback Period: Adjustable historical window from 50 to 500 bars allowing traders to focus on recent market behavior or capture longer-term pattern stability across different market cycles
Configurable Forward Performance Window: Select target holding periods from 1 to 20 bars ahead to align probability calculations with your trading timeframe, whether day trading or swing trading
Visual Heat Mapping: Color-coded cells transition from red (bearish historical performance) through gray (neutral) to green (bullish performance) with intensity reflecting statistical significance and occurrence frequency
Intelligent Data Filtering: Minimum occurrence threshold (1-10) removes unreliable patterns with insufficient historical samples, displaying gray warning colors for low-confidence cells
Flexible Layout Options: Independent positioning of statistics matrix and info panel to any screen corner, accommodating different chart layouts and personal preferences
Tooltip Details: Hover over any matrix cell to see full RSI label, complete indicator status description, precise average return, estimated win rate, and total occurrence count
🎨Visualization
Statistics Matrix Table: A 9-column by 8-row grid with RSI states labeling vertical axis and indicator combinations on horizontal axis, using compact abbreviations (XOverS, OverB, MACD↑, Vol↓, P↑) for space efficiency
Active Cell Indicator: The current market state cell displays “⦿ NOW ⦿” in yellow text with enhanced color saturation to immediately draw attention to relevant historical performance
Signal Strength Visualization: Info panel uses emoji indicators (🔥 Strong Bullish, ✅ Bullish, ↗️ Weak Bullish, ➖ Neutral, ↘️ Weak Bearish, ⛔ Bearish, ❄️ Strong Bearish, ⚠️ Insufficient Data) for rapid interpretation
Histogram Plot: Below the price chart, a green/red histogram displays the current cell’s average return percentage, providing a time-series view of how historical performance changes as market conditions evolve
Color Intensity Scaling: Cell background transparency and saturation dynamically adjust based on both the magnitude of average returns and the occurrence count, ensuring visual emphasis on reliable patterns
Confidence Level Display: Info panel bottom row shows “High Confidence” (green), “Medium Confidence” (orange), or “Low Confidence” (red) based on occurrence counts relative to minimum threshold multipliers
📖Usage Guidelines
RSI Period
Default: 14
Range: 1 to unlimited
Description: Controls the lookback period for RSI momentum calculation. Standard 14-period provides widely-recognized overbought/oversold levels. Decrease for faster, more sensitive RSI reactions suitable for scalping. Increase (21, 28) for smoother, longer-term momentum assessment in swing trading. Changes affect how quickly the indicator moves between the 7 RSI state classifications.
MACD Fast Length
Default: 12
Range: 1 to unlimited
Description: Sets the faster exponential moving average for MACD calculation. Standard 12-period setting works well for daily charts and captures short-term momentum shifts. Decreasing creates more responsive MACD crossovers but increases false signals. Increasing smooths out noise but delays signal generation, affecting the bullish/bearish indicator state classification.
MACD Slow Length
Default: 26
Range: 1 to unlimited
Description: Defines the slower exponential moving average for MACD calculation. Traditional 26-period setting balances trend identification with responsiveness. Must be greater than Fast Length. Wider spread between fast and slow increases MACD sensitivity to trend changes, impacting the frequency of indicator state transitions in the matrix.
MACD Signal Length
Default: 9
Range: 1 to unlimited
Description: Smoothing period for the MACD signal line that triggers bullish/bearish state changes. Standard 9-period provides reliable crossover signals. Shorter values create more frequent state changes and earlier signals but with more whipsaws. Longer values produce more confirmed, stable signals but with increased lag in detecting momentum shifts.
Volume MA Period
Default: 20
Range: 1 to unlimited
Description: Lookback period for volume moving average used to classify volume as “high” or “low” in indicator state combinations. 20-period default captures typical monthly trading patterns. Shorter periods (10-15) make volume classification more reactive to recent spikes. Longer periods (30-50) require more sustained volume changes to trigger state classification shifts.
Statistics Lookback Period
Default: 200
Range: 50 to 500
Description: Number of historical bars used to calculate matrix statistics. 200 bars provides substantial data for reliable patterns while remaining responsive to regime changes. Lower values (50-100) emphasize recent market behavior and adapt quickly but may produce volatile statistics. Higher values (300-500) capture long-term patterns with stable statistics but slower adaptation to changing market dynamics.
Forward Performance Bars
Default: 5
Range: 1 to 20
Description: Number of bars ahead used to calculate forward returns from each historical state occurrence. 5-bar default suits intraday to short-term swing trading (5 hours on hourly charts, 1 week on daily charts). Lower values (1-3) target short-term momentum trades. Higher values (10-20) align with position trading and longer-term pattern exploitation.
Color Intensity Sensitivity
Default: 2.0
Range: 0.5 to 5.0, step 0.5
Description: Amplifies or dampens the color intensity response to average return magnitudes in the matrix heat map. 2.0 default provides balanced visual emphasis. Lower values (0.5-1.0) create subtle coloring requiring larger returns for full saturation, useful for volatile instruments. Higher values (3.0-5.0) produce vivid colors from smaller returns, highlighting subtle edges in range-bound markets.
Minimum Occurrences for Coloring
Default: 3
Range: 1 to 10
Description: Required minimum sample size before applying color-coded performance to matrix cells. Cells with fewer occurrences display gray “insufficient data” warning. 3-occurrence default filters out rare patterns. Lower threshold (1-2) shows more data but includes unreliable single-event statistics. Higher thresholds (5-10) ensure only well-established patterns receive visual emphasis.
Table Position
Default: top_right
Options: top_left, top_right, bottom_left, bottom_right
Description: Screen location for the 56-cell statistics matrix table. Position to avoid overlapping critical price action or other indicators on your chart. Consider chart orientation and candlestick density when selecting optimal placement.
Show Current State Panel
Default: true
Options: true, false
Description: Toggle visibility of the dedicated current state information panel. When enabled, displays signal strength, RSI value, indicator status, average return, estimated win rate, and confidence level for active market conditions. Disable to declutter charts when only the matrix table is needed.
Info Panel Position
Default: bottom_left
Options: top_left, top_right, bottom_left, bottom_right
Description: Screen location for the current state information panel (when enabled). Position independently from statistics matrix to optimize chart real estate. Typically placed opposite the matrix table for balanced visual layout.
Win Rate Smoothing Strength
Default: 5
Range: 1 to 20
Description: Controls Bayesian prior weighting for estimated win rate calculations. Acts as virtual sample size assuming 50% win rate baseline. Default 5 provides moderate smoothing preventing extreme win rate estimates from small samples. Lower values (1-3) reduce smoothing effect, allowing win rates to reflect raw data more directly. Higher values (10-20) increase conservatism, pulling win rate estimates toward 50% until substantial evidence accumulates.
✅Best Use Cases
Pattern-based discretionary trading where you want historical confirmation before entering setups that “look good” based on current technical alignment
Swing trading with holding periods matching your forward performance bar setting, using high-confidence bullish cells as entry filters
Risk assessment and position sizing, allocating larger size to trades originating from cells with strong positive average returns and high estimated win rates
Market regime identification by observing which RSI states and indicator combinations are currently producing the most reliable historical patterns
Backtesting validation by comparing your manual strategy signals against the historical performance of the corresponding matrix cells
Educational tool for developing intuition about which technical condition combinations have actually worked versus those that feel right but lack historical evidence
⚠️Limitations
Historical patterns do not guarantee future performance, especially during unprecedented market events or regime changes not represented in the lookback period
Small sample sizes (low occurrence counts) produce unreliable statistics despite Bayesian smoothing, requiring caution when acting on low-confidence cells
Matrix statistics lag behind rapidly changing market conditions, as the lookback period must accumulate new state occurrences before updating performance data
Forward return calculations use fixed bar periods that may not align with actual trade exit timing, support/resistance levels, or volatility-adjusted profit targets
💡What Makes This Unique
Multi-Dimensional State Space: Unlike single-indicator tools, simultaneously tracks 56 distinct market condition combinations providing granular pattern resolution unavailable in traditional technical analysis
Bayesian Statistical Rigor: Implements proper probabilistic smoothing to prevent overconfidence from limited data, a critical feature missing from most pattern recognition tools
Real-Time Contextual Feedback: The “NOW” marker and dedicated info panel instantly connect current market conditions to their historical performance profile, eliminating guesswork
Transparent Occurrence Counts: Displays sample sizes directly in each cell, allowing traders to judge statistical reliability themselves rather than hiding data quality issues
Fully Customizable Analysis Window: Complete control over lookback depth and forward return horizons lets traders align the tool precisely with their trading timeframe and strategy requirements
🔬How It Works
1. State Classification and Encoding
Each bar’s RSI value is evaluated and assigned to one of 7 discrete states based on threshold levels (0: <20, 1: 20-30, 2: 30-40, 3: 40-60, 4: 60-70, 5: 70-80, 6: >80)
Simultaneously, three binary conditions are evaluated: MACD line position relative to signal line, current volume relative to its moving average, and current close relative to previous close
These three binary conditions are combined into a single indicator state integer (0-7) using binary encoding, creating 8 possible indicator combinations
The RSI state and indicator state are stored together, defining one of 56 possible market condition cells in the matrix
2. Historical Data Accumulation
As each bar completes, the current state classification, closing price, and bar index are stored in rolling arrays maintained at the size specified by the lookback period
When the arrays reach capacity, the oldest data point is removed and the newest added, creating a sliding historical window
This continuous process builds a comprehensive database of past market conditions and their subsequent price movements
3. Forward Return Calculation and Statistics Update
On each bar, the indicator looks back through the stored historical data to find bars where sufficient forward bars exist to measure outcomes
For each historical occurrence, the price change from that bar to the bar N periods ahead (where N is the forward performance bars setting) is calculated as a percentage return
This percentage return is added to the cumulative return total for the specific matrix cell corresponding to that historical bar’s state classification
Occurrence counts are incremented, and wins are tallied for positive returns, building comprehensive statistics for each of the 56 cells
The Bayesian smoothing formula combines these raw statistics with prior assumptions (neutral 50% win rate) weighted by the smoothing strength parameter to produce estimated win rates that remain stable even with small samples
💡Note:
The Historical Matrix Analyzer is designed as a decision support tool, not a standalone trading system. Best results come from using it to validate discretionary trade ideas or filter systematic strategy signals. Always combine matrix insights with proper risk management, position sizing rules, and awareness of broader market context. The estimated win rate feature uses Bayesian statistics specifically to prevent false confidence from limited data, but no amount of smoothing can create reliable predictions from fundamentally insufficient sample sizes. Focus on high-confidence cells (green-colored confidence indicators) with occurrence counts well above your minimum threshold for the most actionable insights.

HermesHERMES STRATEGY - TRADINGVIEW DESCRIPTION
OVERVIEW
Hermes is an adaptive trend-following strategy that uses dual ALMA (Arnaud Legoux Moving Average) filters to identify high-quality entry and exit points. It's designed for swing and position traders who want smooth, low-lag signals with minimal whipsaws.
Unlike traditional moving averages that operate on price, Hermes analyzes price returns (percentage changes) to create signals that work consistently across any asset class and price range.
HOW IT WORKS
DUAL ALMA SYSTEM
The strategy uses two ALMA lines applied to price returns:
• Fast ALMA (Blue Line): Short-term trend signal (default: 80 periods)
• Slow ALMA (Black Line): Long-term baseline trend (default: 250 periods)
ALMA is superior to simple or exponential moving averages because it provides:
• Smoother curves with less noise
• Significantly reduced lag
• Natural resistance to outliers and flash crashes
TRADING LOGIC
BUY SIGNAL:
• Fast ALMA crosses above Slow ALMA (bullish regime)
• Price makes new N-bar high (momentum confirmation)
• Optional: Price above 200 EMA (macro trend filter)
• Optional: ALMA lines sufficiently separated (strength filter)
SELL SIGNAL:
• Fast ALMA crosses below Slow ALMA (bearish regime)
• Optional: Price makes new N-bar low (momentum confirmation)
The strategy stays in position during the entire bullish regime, allowing you to ride trends for weeks or months.
VISUAL INDICATORS
LINES:
• Blue Line: Fast ALMA (short-term signal)
• Black Line: Slow ALMA (long-term baseline)
TRADE MARKERS:
• Green Triangle Up: Buy executed
• Red Triangle Down: Sell executed
• Orange "M": Buy blocked by momentum filter
• Purple "W": Buy blocked by weak crossover strength
KEY PARAMETERS
ALMA SETTINGS:
• Short Period (default: 30) - Fast signal responsiveness
• Long Period (default: 250) - Baseline stability
• ALMA Offset (default: 0.90) - Balance between lag and smoothness
• ALMA Sigma (default: 7.5) - Gaussian curve width
ENTRY/EXIT FILTERS:
• Buy Lookback (default: 7) - Bars for momentum confirmation (required)
• Sell Lookback (default: 0) - Exit momentum bars (0 = disabled for faster exits)
• Min Crossover Strength (default: 0.0) - Required ALMA separation (0 = disabled)
• Use Macro Filter (default: true) - Only enter above 200 EMA
BEST PRACTICES
RECOMMENDED ASSETS - Works well on:
• Cryptocurrencies (Bitcoin, Ethereum, etc.)
• Major indices (S&P 500, Nasdaq)
• Large-cap stocks
• Commodities (Gold, Oil)
RECOMMENDED TIMEFRAMES:
• Daily: Primary timeframe for swing trading
• 4-Hour: More active trading (increase trade frequency)
• Weekly: Long-term position trading
PARAMETER TUNING:
• More trades: Lower Short Period (60-80)
• Fewer trades: Raise Short Period (100-120)
• Faster exits: Set Sell Lookback = 0
• Safer entries: Enable Macro Filter (Use Macro Filter = true)
STRATEGY ADVANTAGES
1. Low Lag - ALMA provides faster signals than traditional moving averages
2. Smooth Signals - Minimal whipsaws compared to crossover strategies
3. Asset Agnostic - Same parameters work across different markets
4. Trend Capture - Stays positioned during entire bullish regimes
5. Risk Management - Multiple filters prevent poor entries
6. Visual Clarity - Easy to interpret regime and filter states
WHEN TO USE HERMES
BEST FOR:
• Trending markets (crypto bull runs, equity uptrends)
• Swing trading (hold days to weeks)
• Position trading (hold weeks to months)
• Clear trend identification
• Risk-managed exposure
NOT SUITABLE FOR:
• Ranging/sideways markets
• Scalping or day trading
• High-frequency trading
• Mean reversion strategies
RISK DISCLAIMER
This indicator is for educational purposes only. Past performance does not guarantee future results. Always use proper position sizing and risk management. Test thoroughly on historical data before live trading.
CREDITS
Inspired by Giovanni Santostasi's Power Law Volatility Indicator, generalized for universal application across all assets using adaptive ALMA filtering.
Strategy by Hermes Trading Systems
QUICK START
1. Add indicator to chart
2. Use on daily timeframe for best results
3. Look for green buy signals when blue line crosses above black line
4. Exit on red sell signals when blue line crosses below black line
5. Adjust parameters based on your trading style:
• Conservative: Enable Macro Filter, increase Buy Lookback to 10
• Aggressive: Disable Macro Filter, lower Short Period to 60
• Default settings work well for most assets

ZS Master Vision Pro - Advanced Multi-Timeframe Trading SystemZS MASTER VISION PRO - PROFESSIONAL TRADING SUITE
Created by Zakaria Safri
A comprehensive, all-in-one trading system combining multiple proven technical analysis methods into a single, powerful indicator. Designed for traders who demand precision, clarity, and actionable signals across all timeframes.
KEY FEATURES
CORE TREND ALGORITHM
Adaptive ATR-based trend detection with dynamic support and resistance zones. Features Type A and Type B signal modes for different trading styles, strong signal detection in key reversal zones, and optional EMA source smoothing for noise reduction.
MULTI-LAYER EMA CLOUD SYSTEM
Five customizable EMA cloud layers for multi-timeframe analysis with theme-adaptive color coding across five professional themes. Optional line display for detailed MA tracking with configurable periods from scalping to position trading.
WAVE TREND OSCILLATOR
Advanced momentum oscillator with channel-based calculations featuring smart reversal detection at extreme overbought and oversold levels. Includes directional strength confirmation and customizable sensitivity with adjustable reaction periods.
DIVERGENCE SCANNER
Detects four types of divergence automatically:
- Regular Bullish: Price making lower lows while oscillator making higher lows
- Regular Bearish: Price making higher highs while oscillator making lower highs
- Hidden Bullish: Trend continuation signals in uptrends
- Hidden Bearish: Trend continuation signals in downtrends
Automatic fractal-based detection with clear visual labels on chart.
MARKET BIAS INDICATOR
Heikin Ashi-based trend strength analysis with real-time bias calculation showing Bullish or Bearish combined with Strong or Weak conditions. Smoothed for cleaner signals and perfect for trend confirmation.
MOMENTUM SYSTEM
Proprietary momentum calculation using adaptive smoothing with growing and falling state detection. Normalized values for consistent interpretation and responsive to rapid market changes.
DYNAMIC SUPPORT AND RESISTANCE
Automatic pivot-based support and resistance level detection with adjustable left and right bar lookback. Non-repainting levels with visual clarity through color-coded lines.
LIVE INFORMATION DASHBOARD
Real-time market analysis panel displaying current trend direction, market bias based on Heikin Ashi, Wave Trend status and value, and momentum trend with state. Customizable display options with theme-adaptive colors.
VISUAL CUSTOMIZATION
FIVE PROFESSIONAL COLOR THEMES:
Pro - Modern green and red color scheme (default)
Classic - Traditional teal and red combination
Cyberpunk - Neon cyan and magenta contrast
Ocean - Blue and orange contrast
Sunset - Gold and red warmth
SIGNAL STYLES:
Labels with emoji indicators (BUY with rocket, SELL with bear, STRONG with lightning)
Arrows for clean minimal appearance
Triangles for classic approach
DISPLAY OPTIONS:
Color-coded candles following trend direction
Trend background highlighting for instant trend recognition
Optional EMA line display for detailed analysis
Adjustable transparency levels for personal preference
SMART ALERTS
Pre-configured alert conditions for all major signals:
Buy signals for standard entry opportunities
Sell signals for standard exit or short opportunities
Strong buy signals for high-confidence long entries
Strong sell signals for high-confidence short entries
Bullish divergence detection alerts
Bearish divergence detection alerts
Alert messages automatically include ticker symbol, current price, and specific signal type for quick decision making.
HOW TO USE
FOR TREND TRADERS:
Enable EMA Clouds with focus on Cloud 5 featuring 50 and 200 period moving averages. Wait for trend background color change to confirm direction. Enter on STRONG signals aligned with higher timeframe trend direction. Use support and resistance levels for strategic exits.
FOR SWING TRADERS:
Enable Wave Trend Oscillator information display. Look for oversold and overbought reversal setups. Confirm potential reversals with divergence scanner. Enter on smart reversal signals with proper risk management.
FOR SCALPERS:
Use Type B signal mode for more frequent trading signals. Enable Cloud 1 with 5 and 13 periods for quick trend confirmation. Focus on momentum growing and falling states for entry timing. Take quick entries on regular buy and sell signals.
FOR POSITION TRADERS:
Use Type A mode with higher ATR multiplier set to 3.0 or above. Enable only Cloud 5 with 50 and 200 periods for major trend confirmation. Only take STRONG signals for highest probability setups. Hold positions through minor pullbacks and noise.
RECOMMENDED SETTINGS
STOCKS ON DAILY TIMEFRAME:
Trend Period: 180
ATR Period: 155
ATR Multiplier: 2.1
Signal Mode: Type A
FOREX ON HOURLY AND 4-HOUR TIMEFRAMES:
Trend Period: 150
ATR Period: 120
ATR Multiplier: 2.5
Signal Mode: Type A
CRYPTOCURRENCY ON 15-MINUTE AND 1-HOUR TIMEFRAMES:
Trend Period: 100
ATR Period: 80
ATR Multiplier: 3.0
Signal Mode: Type B
SCALPING ON 1-MINUTE AND 5-MINUTE TIMEFRAMES:
Trend Period: 50
ATR Period: 40
ATR Multiplier: 2.0
Signal Mode: Type B
WHAT IS INCLUDED
Trend Analysis using ATR-based adaptive algorithm
Five EMA Cloud Layers for multi-timeframe confluence
Wave Trend Oscillator for momentum and reversal detection
Divergence Scanner detecting four types of divergence
Market Bias using Heikin Ashi-based trend strength
Momentum System with advanced momentum tracking
Support and Resistance Levels with automatic pivot detection
Live Dashboard showing real-time market analysis
Smart Alerts featuring six pre-configured alert types
Five Color Themes offering professional visual options
TECHNICAL DETAILS
CALCULATION METHODS:
Average True Range (ATR) for volatility adaptation
Exponential Moving Average (EMA) and Simple Moving Average (SMA) for trend smoothing
Wave Trend channel oscillator for momentum analysis
Fractal-based divergence detection algorithm
Heikin Ashi transformation for bias calculation
Logarithmic momentum calculation for precision
PERFORMANCE CHARACTERISTICS:
Optimized for maximum speed and efficiency
No repainting signals ensuring reliability
Works on all timeframes from 1 minute to monthly
Compatible with all instruments including stocks, forex, crypto, and futures
RISK DISCLAIMER
This indicator is a technical analysis tool and should not be used as the sole basis for trading decisions. Always use proper risk management and never risk more than you can afford to lose. Combine with other analysis methods and practice on demo accounts first. Past performance does not guarantee future results. Trading carries substantial risk and is not suitable for all investors.
SUPPORT AND UPDATES
Regular updates and continuous improvements
Based on proven technical analysis principles
Developed following Pine Coders best practices and standards
Clean, well-documented, and optimized code structure
WHY CHOOSE ZS MASTER VISION PRO
All-in-one solution eliminating the need for multiple indicators
Highly customizable to adapt to your specific trading style
Professional grade analysis with institutional-quality standards
Clean interface that is not cluttered or confusing
Works everywhere across all markets and all timeframes
Smart signals filtered for quality over quantity
Beautiful design featuring five professional color themes
Active development with regular improvements and updates
Transform your trading with ZS Master Vision Pro today.
Version 2.0 | Created by Zakaria Safri | Pine Script Version 5

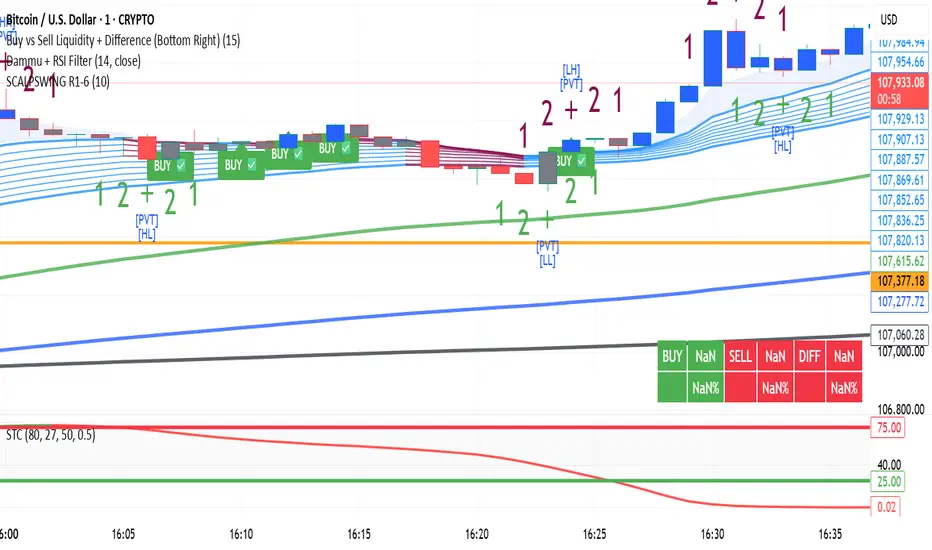
DAMMU Swing Trading PRODammu Scalping Pro – Short Notes
1️⃣ Purpose:
Scalping and swing trading tool for 15-min and 1-min charts.
Designed for trend continuation, pullbacks, and reversals.
Works well with Heikin Ashi candles (optional).
2️⃣ Core Components:
EMAs:
Fast: EMA5-12
Medium: EMA12-36 Ribbon
Long: EMA75/89 (1-min), EMA180/200 (15-min), EMA540/633
Price Action Channel (PAC): EMA-based High, Low, Close channel.
Fractals: Regular & filtered (BW) fractals for swing recognition.
Higher Highs / Lower Highs / Higher Lows / Lower Lows (HH, LH, HL, LL).
Pivot Points: Optional display with labels.
3️⃣ Bar Coloring:
Blue: Close above PAC
Red: Close below PAC
Gray: Close inside PAC
4️⃣ Alerts:
Swing Buy/Sell arrows based on PAC breakout and EMA200 filter.
Optional “Big Arrows” mode for visibility.
Alert messages: "SWING_UP" and "SWING_DN"
5️⃣ Workflow / Usage Tips:
Set chart to 15-min (for trend) + 1-min (for entry).
Optionally enable Heikin Ashi candles.
Trade long only above EMA200, short only below EMA200.
Watch for pullbacks into EMA channels or ribbons.
Confirm trend resumption via PAC breakout & bar color change.
Use fractals and pivot points to draw trendlines and locate support/resistance.
6️⃣ Optional Filters:
Filter PAC signals with 200 EMA.
Filter fractals for “Pristine/Ideal” patterns (BW filter).
7️⃣ Visuals:
EMA ribbons, PAC fill, HH/LL squares, fractal triangles.
Pivot labels & candle numbering for patterns.
8️⃣ Notes:
No extra indicators needed except optionally SweetSpot Gold2 for major S/R levels.
Suitable for scalping pullbacks with trend confirmation.
If you want, I can make an even shorter “one-screen cheat sheet” with colors, alerts, and EMAs, perfect for real-time chart reference.
Do you want me to do that?

DAMMU Swing Trading PRODammu Scalping Pro – Short Notes
1️⃣ Purpose:
Scalping and swing trading tool for 15-min and 1-min charts.
Designed for trend continuation, pullbacks, and reversals.
Works well with Heikin Ashi candles (optional).
2️⃣ Core Components:
EMAs:
Fast: EMA5-12
Medium: EMA12-36 Ribbon
Long: EMA75/89 (1-min), EMA180/200 (15-min), EMA540/633
Price Action Channel (PAC): EMA-based High, Low, Close channel.
Fractals: Regular & filtered (BW) fractals for swing recognition.
Higher Highs / Lower Highs / Higher Lows / Lower Lows (HH, LH, HL, LL).
Pivot Points: Optional display with labels.
3️⃣ Bar Coloring:
Blue: Close above PAC
Red: Close below PAC
Gray: Close inside PAC
4️⃣ Alerts:
Swing Buy/Sell arrows based on PAC breakout and EMA200 filter.
Optional “Big Arrows” mode for visibility.
Alert messages: "SWING_UP" and "SWING_DN"
5️⃣ Workflow / Usage Tips:
Set chart to 15-min (for trend) + 1-min (for entry).
Optionally enable Heikin Ashi candles.
Trade long only above EMA200, short only below EMA200.
Watch for pullbacks into EMA channels or ribbons.
Confirm trend resumption via PAC breakout & bar color change.
Use fractals and pivot points to draw trendlines and locate support/resistance.
6️⃣ Optional Filters:
Filter PAC signals with 200 EMA.
Filter fractals for “Pristine/Ideal” patterns (BW filter).
7️⃣ Visuals:
EMA ribbons, PAC fill, HH/LL squares, fractal triangles.
Pivot labels & candle numbering for patterns.
8️⃣ Notes:
No extra indicators needed except optionally SweetSpot Gold2 for major S/R levels.
Suitable for scalping pullbacks with trend confirmation.
If you want, I can make an even shorter “one-screen cheat sheet” with colors, alerts, and EMAs, perfect for real-time charT
EMA 3 Lines✅ JP
1つのインジケーター枠内に3本のEMA(短期・中期・長期)を表示します。
初期設定では 8(青)/50(赤)/200(緑)の期間が適用されます。
設定画面から期間・ラインカラー・太さを自由にカスタマイズできます。
✅ EN
This indicator displays three EMAs (short-term, mid-term, and long-term) within a single indicator window.
By default, the EMA periods are set to 8 (blue), 50 (red), and 200 (green).
You can freely customize the EMA lengths, line colors, and line thickness from the settings panel.

Swing Breakout Strategy ver 1Overview
A multi-confirmation swing strategy that seeks trend breakouts and adds three optional confluence modules: candlestick patterns, RSI/MACD regular divergences, and simple chart patterns (double top/bottom). Built for clarity, fast testing, and togglable debug markers.
Core Logic
Trend filter: SMA(50) vs SMA(200) + price vs SMA(21).
Breakout engine: Close breaks prior N-bar high/low (lookback configurable).
Momentum: Stochastic cross (optional view), MACD cross/zone, RSI regime (>50 or <50).
Volume: Above SMA(volume) filter.
Optional Confluence Modules
Candlestick analysis (enable/disable):
Bull/Bear Engulfing, Hammer, Shooting Star, Inside Bar (bull/bear flavors).
Divergence (enable/disable):
Regular divergences on RSI and MACD histogram using confirmed pivots (HH/LH or LL/HL).
Chart patterns (enable/disable):
Double Bottom (two similar lows + neckline break).
Double Top (two similar highs + neckline break).
Tolerance and pivot width are configurable.
Entries & Exits
Entry Long: Any of (Base Breakout + Trend + Momentum + Volume) OR enabled confluences (candles / divergence / pattern).
Entry Short: Symmetric logic for downside.
Risk management: Optional ATR-based stop loss and take profit (configurable length & multipliers).
Note: If you prefer confluences to be filters (AND), change the final buySignal/sellSignal lines accordingly.
Inputs (key)
SMA lengths (21/50/200), RSI length, Stochastic lengths & smoothing, MACD (12/26/9).
Breakout lookback, Volume SMA.
ATR exits (on/off, ATR length, SL/TP multipliers).
Toggles for Candlesticks, Divergences, Patterns, plus per-module debug markers.
Plots & Markers
Plots SMA 21/50/200.
Buy/Sell arrows on chart.
Optional debug markers for each condition (global-scope safe).
Divergence/pattern markers offset to the actual pivot/neckline bars.
Good Practices
Test on multiple timeframes and instruments; tune lookbacks and ATR multipliers.
Consider using the modules as filters in trending markets to reduce whipsaws.
Always forward-test and combine with position sizing.
Disclaimer
For educational purposes only. This is not financial advice. Trading involves risk.
Version & Credits
Pine Script® v6 — Strategy.
Developed by: Mohammed Bedaiwi.

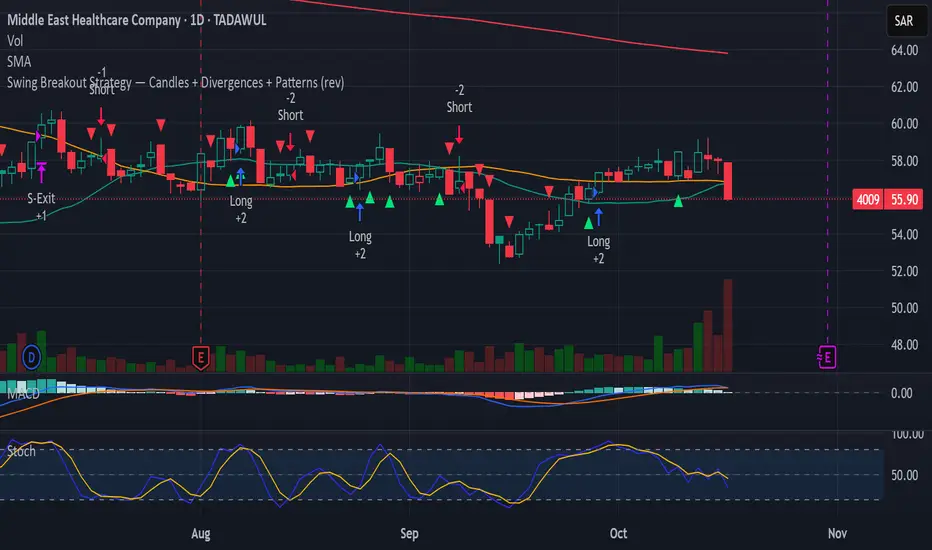
Swing Breakout Strategy — Candles + Divergences + Patterns (rev)Overview
A multi-confirmation swing strategy that seeks trend breakouts and adds three optional confluence modules: candlestick patterns, RSI/MACD regular divergences, and simple chart patterns (double top/bottom). Built for clarity, fast testing, and togglable debug markers.
Core Logic
Trend filter: SMA(50) vs SMA(200) + price vs SMA(21).
Breakout engine: Close breaks prior N-bar high/low (lookback configurable).
Momentum: Stochastic cross (optional view), MACD cross/zone, RSI regime (>50 or <50).
Volume: Above SMA(volume) filter.
Optional Confluence Modules
Candlestick analysis (enable/disable):
Bull/Bear Engulfing, Hammer, Shooting Star, Inside Bar (bull/bear flavors).
Divergence (enable/disable):
Regular divergences on RSI and MACD histogram using confirmed pivots (HH/LH or LL/HL).
Chart patterns (enable/disable):
Double Bottom (two similar lows + neckline break).
Double Top (two similar highs + neckline break).
Tolerance and pivot width are configurable.
Entries & Exits
Entry Long: Any of (Base Breakout + Trend + Momentum + Volume) OR enabled confluences (candles / divergence / pattern).
Entry Short: Symmetric logic for downside.
Risk management: Optional ATR-based stop loss and take profit (configurable length & multipliers).
Note: If you prefer confluences to be filters (AND), change the final buySignal/sellSignal lines accordingly.
Inputs (key)
SMA lengths (21/50/200), RSI length, Stochastic lengths & smoothing, MACD (12/26/9).
Breakout lookback, Volume SMA.
ATR exits (on/off, ATR length, SL/TP multipliers).
Toggles for Candlesticks, Divergences, Patterns, plus per-module debug markers.
Plots & Markers
Plots SMA 21/50/200.
Buy/Sell arrows on chart.
Optional debug markers for each condition (global-scope safe).
Divergence/pattern markers offset to the actual pivot/neckline bars.
Good Practices
Test on multiple timeframes and instruments; tune lookbacks and ATR multipliers.
Consider using the modules as filters in trending markets to reduce whipsaws.
Always forward-test and combine with position sizing.
Disclaimer
For educational purposes only. This is not financial advice. Trading involves risk.
Version & Credits
Pine Script® v6 — Strategy.
Developed by: Mohammed Bedaiwi.
Multi-Timeframe Trend Indicator with Signals═══════════════════════════════════════════════════════════════
Multi-Timeframe Trend Indicator with Signals
by Zakaria Safri
═══════════════════════════════════════════════════════════════
⚠️ IMPORTANT DISCLAIMERS:
━━━━━━━━━━━━━━━━━━━━━━━━━━━━━━━━━━━━━━━━━━━━━━━━━━━━━━━━━━━━━━
• This indicator may REPAINT on unconfirmed bars
• Signals appear in real-time but may change or disappear
• FOR EDUCATIONAL PURPOSES ONLY - NOT FINANCIAL ADVICE
• Past performance does not guarantee future results
• Always do your own research and use proper risk management
• The Risk Management feature is VISUAL ONLY - does not execute trades
━━━━━━━━━━━━━━━━━━━━━━━━━━━━━━━━━━━━━━━━━━━━━━━━━━━━━━━━━━━━━━
📊 OVERVIEW:
━━━━━━━━━━━━━━━━━━━━━━━━━━━━━━━━━━━━━━━━━━━━━━━━━━━━━━━━━━━━━━
This indicator combines multiple technical analysis tools to help identify
potential trend directions and entry/exit points across different timeframes.
It uses SuperTrend, EMAs, ADX, RSI, and Keltner Channels to generate signals.
🎯 KEY FEATURES:
━━━━━━━━━━━━━━━━━━━━━━━━━━━━━━━━━━━━━━━━━━━━━━━━━━━━━━━━━━━━━━
📍 SIGNAL TYPES:
• All Signals: Shows all SuperTrend crossovers
• Filtered Signals: Additional EMA filter for potentially higher quality signals
• Signals use barstate.isconfirmed to reduce (but not eliminate) repainting
📈 TREND ANALYSIS:
• Trend Ribbon: 8 EMAs creating a visual trend direction indicator
• Trend Cloud: EMA 150/250 cloud for long-term trend context
• Chaos Trend Line: Dynamic support/resistance trend line
• Multi-timeframe dashboard showing trend across 8 timeframes (3m to Daily)
📊 TECHNICAL INDICATORS:
• Keltner Channels: Dynamic price channels
• RSI Background: Visual overbought/oversold zones
• Candlestick Coloring: Three modes (CleanScalper/Trend Ribbon/Moving Average)
• ADX-based trend strength analysis for MTF dashboard
🎯 VISUAL TOOLS:
• Order Blocks: Supply/demand zones (optional)
• Channel Breakouts: Pivot-based support/resistance levels
• Reversal Signals: RSI-based potential reversal indicators
• Visual TP/SL Lines: For reference only - does NOT execute trades
📊 DASHBOARD:
• Real-time multi-timeframe trend analysis
• Volatility indicator (Very Low to Very High)
• Current RSI value with color coding
• Customizable position and size
⚙️ SETTINGS:
━━━━━━━━━━━━━━━━━━━━━━━━━━━━━━━━━━━━━━━━━━━━━━━━━━━━━━━━━━━━━━
MAIN SETTINGS:
• Sensitivity: Controls signal frequency (lower = more signals)
• Signal Type: Choose between All Signals or Filtered Signals
• Factor: ATR multiplier for SuperTrend calculation
TREND SETTINGS:
• Toggle Trend Ribbon, Trend Cloud, Chaos Trend, Order Blocks
• Moving Average: Customizable EMA (default 200)
ADVANCED SETTINGS:
• Candlestick coloring with 3 different modes
• Overbought/Oversold background coloring
• Channel breakout levels
• Show/hide signals
RISK MANAGEMENT (VISUAL ONLY):
• ⚠️ Does NOT execute trades automatically
• Shows potential Take Profit levels (TP1, TP2, TP3)
• Shows potential Stop Loss level
• Adjustable TP strength multiplier
• For educational reference only
📖 HOW TO USE:
━━━━━━━━━━━━━━━━━━━━━━━━━━━━━━━━━━━━━━━━━━━━━━━━━━━━━━━━━━━━━━
1. SIGNAL INTERPRETATION:
• "Buy" signals appear below candles when conditions are met
• "Sell" signals appear above candles when conditions are met
• Wait for bar close confirmation to avoid repainting
• Use multiple timeframes for confluence
2. TREND CONFIRMATION:
• Check the multi-timeframe dashboard for trend alignment
• Use Trend Ribbon for visual trend direction
• Trend Cloud shows longer-term market bias
• Green candles = potential uptrend, Red = potential downtrend
3. ENTRY/EXIT STRATEGY:
• Combine signals with other analysis tools
• Check volatility status before entering trades
• Use support/resistance levels for confirmation
• The visual TP/SL lines are for planning only
4. RISK MANAGEMENT:
• Always use stop losses (indicator shows suggested levels only)
• Position size according to your risk tolerance
• Never risk more than you can afford to lose
• The indicator does NOT manage trades automatically
⚠️ LIMITATIONS & RISKS:
━━━━━━━━━━━━━━━━━━━━━━━━━━━━━━━━━━━━━━━━━━━━━━━━━━━━━━━━━━━━━━
REPAINTING:
• Signals may appear and disappear on unconfirmed bars
• Always wait for bar close before taking action
• Historical performance may look better than real-time results
FALSE SIGNALS:
• No indicator is 100% accurate
• Signals can fail in ranging/choppy markets
• Use additional confirmation methods
• Consider market context and fundamentals
VISUAL TP/SL:
• Lines are for reference/planning only
• Does NOT place or manage actual trades
• You must manually set your own stop losses
• TP levels are calculated estimates, not guarantees
🔧 TECHNICAL DETAILS:
━━━━━━━━━━━━━━━━━━━━━━━━━━━━━━━━━━━━━━━━━━━━━━━━━━━━━━━━━━━━━━
• Version: Pine Script v5
• Overlay: Yes (displays on main chart)
• Anti-repaint measures: Uses barstate.isconfirmed on signals
• Security function: Uses lookahead protection for higher timeframes
• Dynamic requests: Enabled for MTF analysis
• Max labels: 500
📚 COMPONENTS EXPLAINED:
━━━━━━━━━━━━━━━━━━━━━━━━━━━━━━━━━━━━━━━━━━━━━━━━━━━━━━━━━━━━━━
SUPERTREND:
• Core signal generator using ATR-based bands
• Crossovers indicate potential trend changes
• Adjustable via Sensitivity and Factor inputs
EMA FILTER:
• Uses 200 EMA as trend filter (customizable)
• Filtered signals require price above/below EMA
• Helps reduce false signals in ranging markets
ADX TREND QUALITY:
• Measures trend strength across timeframes
• Used in multi-timeframe dashboard
• Shows Bullish/Bearish/Neutral states
KELTNER CHANNELS:
• Multiple bands showing volatility zones
• Color-coded based on RSI levels
• Helps identify overbought/oversold conditions
ORDER BLOCKS:
• Identifies supply/demand zones
• Based on price structure and pivots
• Can extend to the right for projection
💡 BEST PRACTICES:
━━━━━━━━━━━━━━━━━━━━━━━━━━━━━━━━━━━━━━━━━━━━━━━━━━━━━━━━━━━━━━
✓ Use multiple timeframe confirmation
✓ Wait for bar close before acting on signals
✓ Combine with support/resistance analysis
✓ Check overall market conditions
✓ Use proper risk management (1-2% per trade)
✓ Backtest on your specific market/timeframe
✓ Paper trade before using real money
✓ Keep a trading journal
✓ Adjust settings to your trading style
✗ Don't rely solely on this indicator
✗ Don't ignore risk management
✗ Don't trade on unconfirmed signals
✗ Don't overtrade every signal
✗ Don't use without understanding how it works
✗ Don't expect the TP/SL feature to trade for you
📞 SUPPORT & UPDATES:
━━━━━━━━━━━━━━━━━━━━━━━━━━━━━━━━━━━━━━━━━━━━━━━━━━━━━━━━━━━━━━
Creator: Zakaria Safri
Version: 4.3 (Compliance Update)
For questions or feedback, please use TradingView's comment section.
⚖️ FINAL DISCLAIMER:
━━━━━━━━━━━━━━━━━━━━━━━━━━━━━━━━━━━━━━━━━━━━━━━━━━━━━━━━━━━━━━
This indicator is provided for EDUCATIONAL and INFORMATIONAL purposes only.
It is NOT financial advice, investment advice, or a recommendation to buy/sell.
Trading involves substantial risk of loss. Past performance, whether actual or
indicated by historical tests of strategies, is not indicative of future results.
The creator assumes NO responsibility for your trading results. You are solely
responsible for your own investment decisions and due diligence.
Always consult with a qualified financial advisor before making investment decisions.
By using this indicator, you acknowledge and accept these risks and limitations.

Ripster: DTR/ATR + SMA Div + RVOL🧭 Overview
The indicator combines three major analytical tools into one TradingView Pine v6 script — designed for clean, at-a-glance insight into range, divergence, and volume activity.
It shows:
DTR vs ATR Table – current Daily True Range compared to Average True Range.
SMA Price Divergence + EMA Signal – a histogram with color-coded momentum bands.
RVOL Table + Candle Coloring + Change Labels – relative-volume analysis with visual cues on the chart.
Short title: ripcombo
Runs on chart overlay (no separate pane).
📊 1. DTR vs ATR Table
Compares today’s price range (High-Low) to the average true range over a selectable length.
Supports multiple smoothing methods: EMA, RMA, SMA, WMA.
Table position and text size are configurable.
Color logic:
🟢 ≤ 70 % of ATR → low volatility
🟡 70–90 % → average
🔴 ≥ 90 % → expanded range
📈 2. SMA Divergence + EMA Signal
Computes fast (14 SMA) and slow (30 SMA) divergences of price.
Plots two histograms plus an EMA signal line of the slow divergence.
Visuals:
Columns shaded by transparency for clarity.
Rising EMA → lime line (up momentum).
Falling EMA → red line (down momentum).
Optional upper/lower bands and zero line provide quick overbought/oversold zones.
🔥 3. RVOL (Relative Volume)
Adds powerful volume-based context:
a. Table Display
Shows:
Candle Volume
RVOL (Now)
RVOL (Prev)
Δ RVOL (change Now − Prev)
Colors:
🔴 > 200 % (very high volume)
🟠 100–200 % (high volume)
🟡 < 100 % (normal/low volume)
Δ column is green ▲ for increase, red ▼ for decrease.
b. Candle Coloring (optional)
Colors price candles themselves by current RVOL threshold so high-volume candles visually stand out.
c. Last-Bar Label (optional)
Prints a compact label on the latest candle showing:
RVOL: ### % Δ: ▲/▼## %
so you can instantly see the current volume strength and how it changed from the previous bar.
⚙️ User Settings
All major elements are toggle-controlled:
Enable/disable ATR, Divergence, or RVOL sections.
Choose table positions (top/middle/bottom × left/center/right).
Select text sizes, smoothing types, color modes, and visual transparency.
Candle coloring + label visibility are optional.
🧠 At a Glance
Component Purpose Key Visuals
DTR vs ATR Measures volatility expansion One-cell colored table
SMA Divergence Detects price momentum shifts Columns + EMA line + bands
RVOL Analysis Highlights unusual trading volume Colored table + Δ column + candle colors + label
✅ Result
You get a single on-chart tool that:
Quantifies volatility, momentum, and volume context together.
Highlights strong activity days (ATR & RVOL) in color.
Shows whether current candle’s volume is rising or falling vs the previous.
Perfect for spotting breakouts, reversals, or exhaustion moves without switching indicators.

Custom MTF EMA CloudsVisualize market structure and trend alignment across multiple timeframes with six layered EMA clouds — from short-term momentum to macro trend anchors.
Each pair of EMAs forms a dynamic cloud that adapts to your selected timeframe.
Colors, lengths, and visibility are fully customizable, allowing you to tailor the setup for any trading style.
⚙️ Default Configuration
EMA Short Long Purpose
1 8 13 🔸 Intraday momentum cloud (scalping layer)
2 21 24 🟩 Short-term trend confirmation
3 50 55 🔵 Medium-term swing structure
4 120 144 🔴 Long-term support/resistance band
5 200 238 🟠 Institutional trend foundation
6 400 460 🟣 Macro directional anchor
🧩 Features
✅ Up to 6 independent EMA clouds
✅ Fully customizable short & long lengths
✅ Individual line and cloud colors
✅ Toggle each layer on/off
✅ Works with any timeframe via the Resolution input
✅ Automatic cloud transparency for better chart clarity
📈 How to Use
Use EMA 1–2 (8/13, 21/24) for momentum shifts and intraday entries.
Use EMA 3–4 (50/55, 120/144) for swing confirmation and trend continuation.
Use EMA 5–6 (200/238, 400/460) as long-term anchors to stay aligned with institutional flow.
Watch for crossovers or price breaking in/out of clouds — they often precede strong directional moves.

200W MA Valuation ZonesInspired by "Crypto Currently"
📈 200-Week MA Valuation Zones Indicator
This script visualizes long-term valuation zones based on the 200-week moving average (MA) — a widely followed metric for identifying major market cycle bottoms and tops.
It divides price levels into five distinct zones relative to the 200W MA:
🟦 Very Cheap — Below 200W MA
🟩 Cheap — 1.0× to 1.5× 200W MA
🟨 Fair Value — 1.5× to 2.0× 200W MA
🟧 Expensive — 2.0× to 2.5× 200W MA
🟥 Very Expensive — Above 2.5× 200W MA
You can choose to anchor zones to the current price or display full historical bands.
Color-coded regions and labels make it easy to identify when an asset is historically undervalued or overvalued based on long-term moving averages.

EMAs de JahazielThis indicator displays seven Exponential Moving Averages (EMA 5, 6, 9, 20, 50, 100, and 200) to help identify short-, medium-, and long-term market trends.
When shorter EMAs (5, 6, 9) cross above longer EMAs (50, 100, 200), it suggests increasing bullish momentum and potential uptrend continuation.
Conversely, when shorter EMAs cross below longer EMAs, it indicates potential bearish momentum and a possible downtrend.
📈 The combination of these EMAs helps traders visualize market structure, momentum shifts, and key dynamic support/resistance levels.
🧠 Suitable for scalping, intraday trading, swing trading, or confirming higher time frame trends across any market — Forex, indices, crypto, or commodities.

Diwali Lights Pro — 7-Diyas Signal Matrix [KedArc Quant]🎯 Overview
“Diwali Lights Pro — 7-Diyas Signal Matrix” is a precision-built trend-sentiment indicator that blends the glow of seven technical “diyas” — each representing a different momentum or strength dimension — into one intuitive signal matrix. It was designed to celebrate light, discipline, and clarity in trading — helping traders filter noise, identify strong trend shifts, and take trades with conviction. Each diya is powered by a proven indicator component: RSI, Stochastic, EMA trend strength, and momentum slopes.Together, they light up your chart with buy/sell signals only when technical confluence aligns — like the diyas of Diwali shining in harmony.
💡 Core Concept
The indicator computes a composite score (–9 to +9) by evaluating seven key parameters:
| # | Diya | Logic | Interpretation |
| 1 | RSI | Overbought / Oversold | Short-term momentum exhaustion |
| 2 | Stochastic | Direction & zones | Confirmation of RSI |
| 3 | Price vs EMA20 | Position of price | Near-term trend bias |
| 4 | EMA20 Slope | Short-term momentum | Strength confirmation |
| 5 | EMA50 Slope | Mid-term trend | Trend stability |
| 6 | EMA100 Slope | Medium-term sentiment | Institutional bias |
| 7 | EMA200 Slope | Long-term sentiment | Market direction baseline |
The total of these 7 diyas creates a signal matrix that dynamically adapts to trend conditions.
⚙️ Inputs & Configuration
| RSI Length | 14 | Standard RSI window |
| Stochastic Length | 14 | Measures momentum oscillation |
| EMA Periods | 20, 50, 100, 200 | Multi-layer trend structure |
| Overbought / Oversold Zones | 70 / 30 | Configurable thresholds |
| Show Buy/Sell Labels | ✅ | Toggle signal markers |
| Show Banner | ✅ | Festive Diwali header with fireworks |
| Twinkle Interval | 10 bars | Animation timing |
| Fireworks Count | 18 | Visual celebration intensity |
| Background Opacity | 100% | Style preference |
🧭 Entry & Exit Logic
# ✅ Buy Signal (🪔)
A Buy triggers when:
* The total diya score crosses above zero,
* And at least four of seven components turn bullish.
This indicates that short-term oscillators, price action, and moving averages are all turning in unison — a strong entry zone after a pullback.
# 🔥 Sell Signal (🔥)
A Sell triggers when:
* The total diya score crosses below zero,
* And multiple slopes or price conditions flip bearish.
This flags weakening momentum and possible trend exhaustion.
# 💬 Suggested Usage
* Works beautifully on 5-min to 1-hour charts.
* Best when used with trend confirmation tools (volume, price structure).
* Avoid entering trades when signals flip rapidly within narrow ranges (sideways zones).
🧪 Mathematical Formulae
1. RSI Bucket (p₁):
p₁ =
2 if RSI < Very Oversold
1 if RSI < Oversold
0 if neutral
-1 if RSI > Overbought
-2 if RSI > Very Overbought
2. Stochastic Bucket (p₂): Similar to RSI bucketing.
3. Price vs EMA20 (p₃):
p₃ = sign(close - EMA20)
4–7. Slope Sign (EMA20, 50, 100, 200):
p₄₋₇ = sign(EMA - EMA )
Total Score = Σ(p₁…p₇)
→ Crossover(total_score, 0) → Buy Signal
→ Crossunder(total_score, 0) → Sell Signal
📊 Why It’s Not Just a Mash-Up
Diwali Lights Pro uses:
* A unified scoring engine with weighted logic rather than conflicting triggers.
* Each component (diya) contributes equally, creating a normalized sentiment index.
* Smart signal filtering prevents repetitive false flips by enforcing trend alignment across multiple time frames.
* A dynamic, responsive structure optimized for clarity and minimal repainting.
🎆 Unique Add-Ons
* Top-Right Diwali Banner: Festive “Happy Diwali” with animated fireworks 🎇 and diyas 🪔.
* Signal Filtering: Reduces noise in volatile ranges.
* EMA Cloud Context: Visual clarity of multi-layer trend zones.
* Optional Light Mode: Change fireworks opacity for a subtle or bright effect.
📘 FAQ
Q1: Does this repaint?
No — it uses confirmed values (RSI, Stochastic, EMA slopes). Signals appear only after the bar closes.
Q2: Which timeframes work best?
Between 5m and 1h, depending on your strategy.
Use higher EMAs for swing setups.
Q3: Can I use it with alerts?
Yes, both Buy and Sell triggers come with built-in `alertcondition()` for instant notifications.
Q4: Can it be combined with other indicators?
Absolutely — it pairs well with volume profiles, volatility bands, or order-flow systems.
🪔 Glossary
| Diya | Candle or light — here, each diya = one technical indicator |
| EMA | Exponential Moving Average — measures smoothed trend bias |
| RSI | Relative Strength Index — momentum overbought/oversold oscillator |
| Stochastic | Momentum oscillator measuring closing levels relative to highs/lows |
| Slope Sign | Direction of EMA movement — rising or falling |
| Signal Matrix | The combined system of all seven diyas generating a unified score |
🧭 Final Note
> *Diwali Lights Pro* is not just a trading tool — it’s a visual celebration of confluence and discipline.
> When the diyas align, trends shine. Use it to trade in harmony with light, not against it. 🌟
⚠️ Disclaimer
This script is provided for educational purposes only.
Past performance does not guarantee future results.
Trading involves risk, and users should exercise caution and use proper risk management when applying this strategy.

Relative Strength Index Remastered [CHE]Relative Strength Index Remastered — Enhanced RSI with robust divergence detection using price-based pivots and line-of-sight validation to reduce false signals compared to the standard RSI indicator.
Summary
RSI Remastered builds on the classic Relative Strength Index by adding a more reliable divergence detection system that relies on price pivots rather than RSI pivots alone, incorporating a line-of-sight check to ensure the RSI path between points remains clear. This approach filters out many false divergences that occur in the original RSI indicator due to its volatile pivot detection on the RSI line itself. Users benefit from clearer reversal and continuation signals, especially in noisy markets, with optional hidden divergence support for trend confirmation. The core RSI calculation and smoothing options remain familiar, but the divergence logic provides materially fewer alerts while maintaining sensitivity.
Motivation: Why this design?
The standard RSI indicator often generates misleading divergence signals because it detects pivots directly on the RSI values, which can fluctuate erratically in volatile conditions, leading to frequent false positives that confuse traders during ranging or choppy price action. RSI Remastered addresses this by shifting pivot detection to the underlying price highs and lows, which are more stable, and adding a validation step that confirms the RSI line does not cross the direct path between pivot points. This design targets the real problem of over-signaling in the original, promoting more actionable insights without altering the RSI's core momentum measurement.
What’s different vs. standard approaches?
- Reference baseline: The classical TradingView RSI indicator, which uses simple RSI-based pivot detection for divergences.
- Architecture differences:
- Pivot identification on price extremes (highs and lows) instead of RSI values, extracting RSI levels at those points for comparison.
- Addition of a line-of-sight validation that checks the RSI path bar by bar between pivots to prevent signals where the line is interrupted.
- Inclusion of hidden divergence types alongside regular ones, using the same robust framework.
- Configurable drawing of connecting lines between validated pivot RSI points for visual clarity.
- Practical effect: Charts show fewer but higher-quality divergence markers and lines, reducing clutter from the original's frequent RSI pivot triggers; this matters for avoiding whipsaws in intraday trading, where the standard version might flag dozens of invalid setups per session.
Key Comparison Aspects
Aspect: Title/Shorttitle
Original RSI: "Relative Strength Index" / "RSI"
Robust Variant: "Relative Strength Index Remastered " / "RSI RM"
Aspect: Max. Lines/Labels
Original RSI: No specification (Standard: 50/50)
Robust Variant: max_lines_count=200, max_labels_count=200 (for more lines/markers in divergences)
Aspect: RSI Calculation & Plots
Original RSI: Identical: RSI with RMA, Plots (line, bands, gradient fills)
Robust Variant: Identical: RSI with RMA, Plots (line, bands, gradient fills)
Aspect: Smoothing (MA)
Original RSI: Identical: Inputs for MA types (SMA, EMA etc.), Bollinger Bands optional
Robust Variant: Identical: Inputs for MA types (SMA, EMA etc.), Bollinger Bands optional
Aspect: Divergence Activation
Original RSI: input.bool(false, "Calculate Divergence") (disabled by default)
Robust Variant: input.bool(true, "Calculate Divergence") (enabled by default, with tooltip)
Aspect: Pivot Calculation
Original RSI: Pivots on RSI (ta.pivotlow/high on RSI values)
Robust Variant: Pivots on price (ta.pivotlow/high on low/high), RSI values then extracted
Aspect: Lookback Values
Original RSI: Fixed: lookbackLeft=5, lookbackRight=5
Robust Variant: Input: L=5 (Pivot Left), R=5 (Pivot Right), adjustable (min=1, max=50)
Aspect: Range Between Pivots
Original RSI: Fixed: rangeUpper=60, rangeLower=5 (via _inRange function)
Robust Variant: Input: rangeUpper=60 (Max Bars), rangeLower=5 (Min Bars), adjustable (min=1–6, max=100–300)
Aspect: Divergence Types
Original RSI: Only Regular Bullish/Bearish: - Bull: Price LL + RSI HL - Bear: Price HH + RSI LH
Robust Variant: Regular + Hidden (optional via showHidden=true): - Regular Bull: Price LL + RSI HL - Regular Bear: Price HH + RSI LH - Hidden Bull: Price HL + RSI LL - Hidden Bear: Price LH + RSI HH
Aspect: Validation
Original RSI: No additional check (only pivot + range check)
Robust Variant: Line-of-Sight Check: RSI line must not cross the connecting line between pivots (line_clear function with slope calculation and loop for each bar in between)
Aspect: Signals (Plots/Shapes)
Original RSI: - Plot of pivot points (if divergence) - Shapes: "Bull"/"Bear" at RSI value, offset=-5
Robust Variant: - No pivot plots, instead shapes at RSI , offset=-R (adjustable) - Shapes: "Bull"/"Bear" (Regular), "HBull"/"HBear" (Hidden) - Colors: Lime/Red (Regular), Teal/Orange (Hidden)
Aspect: Line Drawing
Original RSI: No lines
Robust Variant: Optional (showLines=true): Lines between RSI pivots (thick for regular, dashed/thin for hidden), extend=none
Aspect: Alerts
Original RSI: Only Regular Bullish/Bearish (with pivot lookback reference)
Robust Variant: Regular Bullish/Bearish + Hidden Bullish/Bearish (specific "at latest pivot low/high")
Aspect: Robustness
Original RSI: Simple, prone to false signals (RSI pivots can be volatile)
Robust Variant: Higher: Price pivots are more stable, line-of-sight filters "broken" divergences, hidden support for trend continuations
Aspect: Code Length/Structure
Original RSI: ~100 lines, simple if-blocks for bull/bear
Robust Variant: ~150 lines, extended helper functions (e.g., inRange, line_clear), var group for inputs
How it works (technical)
The indicator first computes the core RSI value based on recent price changes, separating upward and downward movements over the specified length and smoothing them to derive a momentum reading scaled between zero and one hundred. This value is then plotted in a separate pane with fixed upper and lower reference lines at seventy and thirty, along with optional gradient fills to highlight overbought and oversold zones.
For smoothing, a moving average type is applied to the RSI if enabled, with an option to add bands around it based on the variability of recent RSI values scaled by a multiplier. Divergence detection activates on confirmed price pivots: lows for bullish checks and highs for bearish. At each new pivot, the system retrieves the bar index and values (price and RSI) for the current and prior pivot, ensuring they fall within a configurable bar range to avoid unrelated points.
Comparisons then assess whether the price has made a lower low (or higher high) while the RSI at those points moves in the opposite direction—higher for bullish regular, lower for bearish regular. For hidden types, the directions reverse to capture trend strength. The line-of-sight check calculates the straight path between the two RSI points and verifies that the actual RSI values in between stay entirely above (for bullish) or below (for bearish) that path, breaking the signal if any bar violates it. Valid signals trigger shapes at the RSI level of the new pivot and optional lines connecting the points. Initialization uses built-in functions to track prior occurrences, with states persisting across bars for accurate historical comparisons. No higher timeframe data is used, so confirmation occurs after the right pivot bars close, minimizing live-bar repaints.
Parameter Guide
Length — Controls the period for measuring price momentum changes — Default: 14 — Trade-offs/Tips: Shorter values increase responsiveness but add noise and more false signals; longer smooths trends but delays entries in fast markets.
Source — Selects the price input for RSI calculation — Default: Close — Trade-offs/Tips: Use high or low for volatility focus, but close works best for most assets; mismatches can skew overbought/oversold reads.
Calculate Divergence — Enables the enhanced divergence logic — Default: True — Trade-offs/Tips: Disable for pure RSI view to save computation; essential for signal reliability over the standard method.
Type (Smoothing) — Chooses the moving average applied to RSI — Default: SMA — Trade-offs/Tips: None for raw RSI; EMA for quicker adaptation, but SMA reduces whipsaws; Bollinger Bands option adds volatility context at cost of added lines.
Length (Smoothing) — Period for the smoothing average — Default: 14 — Trade-offs/Tips: Match RSI length for consistency; shorter boosts signal speed but amplifies noise in the smoothed line.
BB StdDev — Multiplier for band width around smoothed RSI — Default: 2.0 — Trade-offs/Tips: Lower narrows bands for tighter signals, risking more touches; higher widens for fewer but stronger breakouts.
Pivot Left — Bars to the left for confirming price pivots — Default: 5 — Trade-offs/Tips: Increase for stricter pivots in noisy data, reducing signals; too high delays confirmation excessively.
Pivot Right — Bars to the right for confirming price pivots — Default: 5 — Trade-offs/Tips: Balances with left for symmetry; longer right ensures maturity but shifts signals backward.
Max Bars Between Pivots — Upper limit on distance for valid pivot pairs — Default: 60 — Trade-offs/Tips: Tighten for short-term trades to focus recent action; widen for swing setups but risks unrelated comparisons.
Min Bars Between Pivots — Lower limit to avoid clustered pivots — Default: 5 — Trade-offs/Tips: Raise to filter micro-moves; too low invites overlapping signals like the original RSI.
Detect Hidden — Includes trend-continuation hidden types — Default: True — Trade-offs/Tips: Enable for full trend analysis; disable simplifies to reversals only, akin to basic RSI.
Draw Lines — Shows connecting lines between valid pivots — Default: True — Trade-offs/Tips: Turn off for cleaner charts; helps visually confirm line-of-sight in backtests.
Reading & Interpretation
The main RSI line oscillates between zero and one hundred, crossing above fifty suggesting building momentum and below indicating weakness; touches near seventy or thirty flag potential extremes. The optional smoothed line and bands provide a filtered view—price above the upper band on the RSI pane hints at overextension. Divergence shapes appear as upward labels for bullish (lime for regular, teal for hidden) and downward for bearish (red regular, orange hidden) at the pivot's RSI level, signaling a mismatch only after validation. Connecting lines, if drawn, slope between points without RSI interference, their color matching the shape type; a dashed style denotes hidden. Fewer shapes overall compared to the standard RSI mean higher conviction, but always confirm with price structure.
Practical Workflows & Combinations
- Trend following: Enter longs on regular bullish shapes near support with higher highs in price; filter hidden bullish for pullback buys in uptrends, pairing with a rising smoothed RSI above fifty.
- Exits/Stops: Use bearish regular as reversal warnings to tighten stops; hidden bearish in downtrends confirms continuation—exit if lines show RSI crossing the path.
- Multi-asset/Multi-TF: Defaults suit forex and stocks on one-hour charts; for crypto volatility, widen pivot ranges to ten; scale min/max bars proportionally on daily for swings, avoiding the original's intraday spam.
Behavior, Constraints & Performance
Signals confirm only after the right pivot bars close, so live bars may show tentative pivots that vanish on close, unlike the standard RSI's immediate RSI-pivot triggers—plan for this delay in automation. No higher timeframe calls, so no security-related repaints. Resources include up to two hundred lines and labels for dense charts, with a loop in validation scanning up to three hundred bars between pivots, which is efficient but could slow on very long histories. Known limits: Slight lag at pivot confirmation in trending markets; volatile RSI might rarely miss fine path violations; not ideal for gap-heavy assets where pivots skip.
Sensible Defaults & Quick Tuning
Start with defaults for balanced momentum and divergence on most timeframes. For too many signals (like the original), raise pivot left/right to eight and min bars to ten to filter noise. If sluggish in trends, shorten RSI length to nine and enable EMA smoothing for faster adaptation. In high-volatility assets, widen max bars to one hundred but disable hidden to focus essentials. For clean reversal hunts, set smoothing to none and lines on.
What this indicator is—and isn’t
RSI Remastered serves as a refined momentum and divergence visualization tool, enhancing the standard RSI for better signal quality in technical analysis setups. It is not a standalone trading system, nor does it predict price moves—pair it with volume, structure breaks, and risk rules for decisions. Use alongside position sizing and broader context, not in isolation.
Disclaimer
The content provided, including all code and materials, is strictly for educational and informational purposes only. It is not intended as, and should not be interpreted as, financial advice, a recommendation to buy or sell any financial instrument, or an offer of any financial product or service. All strategies, tools, and examples discussed are provided for illustrative purposes to demonstrate coding techniques and the functionality of Pine Script within a trading context.
Any results from strategies or tools provided are hypothetical, and past performance is not indicative of future results. Trading and investing involve high risk, including the potential loss of principal, and may not be suitable for all individuals. Before making any trading decisions, please consult with a qualified financial professional to understand the risks involved.
By using this script, you acknowledge and agree that any trading decisions are made solely at your discretion and risk.
Do not use this indicator on Heikin-Ashi, Renko, Kagi, Point-and-Figure, or Range charts, as these chart types can produce unrealistic results for signal markers and alerts.
Best regards and happy trading
Chervolino

Sharpshooter 30 – EMA DistanceSharpshooter 30 – EMA Distance Pullback Detector
This indicator is designed for disciplined traders who prefer to wait for deep pullbacks
after a clear trend shift. Following a 7/200 EMA death cross, the script “arms” and waits
for the Fast EMA to move a configurable USD distance below the Slow EMA.
When this distance threshold is reached and confirmed by a closed bar,
the script plots a single BUY signal — signaling a potential rebound entry point.
Recommended timeframe: 5-minute chart (XAU/USD works best)
Key features:
• Adjustable EMA lengths
• Adjustable USD distance threshold
• One-time signal logic to avoid overplotting
Philosophy:
"Always wait" — patience defines precision. The method aims to catch
the first high-probability retracement after trend exhaustion.
日本語説明:
Sharpshooter 30は、トレンド転換後の押し目を狙うトレーダー向けのインジケーターです。
7/200 EMAのデッドクロス後、Fast EMAがSlow EMAより一定金額(例:30ドル)下回った確定足でBUYを1度だけ点灯します。
ルールを守り、焦らず待つことを目的としています。
推奨時間軸:5分足(特にXAU/USDで効果的)
MA期間や乖離幅は調整可能。

EMA+SuperThis comprehensive indicator combines multiple powerful trend-following tools into a single chart overlay, designed for traders seeking clear entry and exit signals with market context.
Features:
Exponential Moving Averages (EMAs): Five EMAs (9, 21, 50, 100, 200) plotted for multi-timeframe trend analysis and dynamic support/resistance.
Supertrend: Classic volatility-based trend indicator highlighting bullish and bearish phases with dynamic colored bands.
NovaWave Cloud: Custom trend cloud created using fast and slow EMAs plus a signal moving average for visualizing market momentum shifts.
Displaced Moving Averages (20, 50, 200 DMA): Simple moving averages with optional displacement to assess lagged trend confirmation and cyclical ranges.
Buy/Sell Signal Labels: Automated labels show “BUY” when the 9 EMA crosses above the 21 EMA, and “SELL” when the 9 EMA crosses below the 21 EMA, providing timely entry/exit cues.
Intended Use:
Perfect for swing and position traders, this indicator combines trend confirmation and actionable signals to help identify sustained price moves in various markets. It works well on multiple timeframes, offering a clear visual framework for market direction and trading decisions.
How to Use:
Look for BUY labels for potential long entry opportunities when momentum shifts bullish.
Look for SELL labels as potential exit or short signals when a bearish momentum crossover occurs.
Use the overlaying EMAs, Supertrend, and cloud as additional confirmation for trend strength and timing.
This all-in-one tool is ideal for traders who want a unified view of trend dynamics combined with simple, clear signals without needing multiple separate indicators.
Feel free to modify or expand based on your style. Let me know if you want a shorter summary or technical details added!

Confluence Zone BuilderWhat It Does
The Confluence Zone Builder is a technical analysis indicator that identifies high-probability price levels by detecting where multiple technical factors align (converge) at the same price area. These "confluence zones" represent levels where price is statistically more likely to react - either bouncing (support/resistance) or breaking through (breakout targets).
How It Works
1. Multi-Factor Analysis
The indicator calculates key technical levels from various sources:
Fibonacci Retracements (23.6%, 38.2%, 50%, 61.8%, 78.6%) - Support/resistance levels based on recent price swings
Fibonacci Extensions (127.2%, 141.4%, 161.8%, 200%, 261.8%) - Breakout targets beyond the current range (both bullish and bearish)
Pivot Points (Classic pivots: P, R1-R3, S1-S3) - Daily/weekly reference points traders watch
Moving Averages (EMA 20, 50 and SMA 100, 200) - Dynamic support/resistance that institutions track
VWAP - Volume-weighted average price, popular among institutional traders
Psychological Levels - Round numbers that attract orders
Previous Period Levels - Prior day/week high, low, and close
2. Proximity Clustering
When multiple factors fall within a defined proximity range (default 0.5%), they're grouped together into a single "confluence zone." This prevents cluttering the chart with dozens of individual lines.
3. Weighted Scoring System
Not all technical factors are equal. The indicator assigns importance weights:
Key Fibonacci levels (61.8%) and major MAs (200, 50) get higher weights (2.0-2.5x)
Pivot points and VWAP get medium weights (1.5x)
Minor factors get lower weights (1.0x)
The total score reflects both the number of factors and their importance.
4. Historical Validation
The indicator analyzes the last 50 bars (customizable) to track:
Touches: How many times price reached each zone
Rejections: Times price bounced off the zone (✅)
Breaks: Times price broke through the zone (❌)
Win Rate: Percentage of times the zone held (rejections ÷ touches)
5. Dynamic Adjustment
Zones aren't static - they adapt based on how price interacts with them:
Strengthens (+0.5 per rejection, +0.2 per touch): Zones that repeatedly hold become more important
Weakens (-0.8 per break): Zones that fail to hold lose credibility
Visual Indicators:
Thick solid lines = Strong zones (more rejections than breaks)
Dashed lines = Weak zones (more breaks than rejections)
Color-coded by score: Blue (low), Yellow (medium), Red (high)
What You Gain From Using It
For Support/Resistance Trading:
High-probability entries: Enter at zones with high confluence scores and strong historical win rates
Better risk management: Place stops beyond strong confluence zones that are likely to hold
Reduced false signals: Multi-factor confirmation reduces reliance on single indicators
For Breakout Trading:
Target identification: Fibonacci extensions provide profit targets beyond current ranges
Breakout confirmation: Weak zones (dashed lines, low win rates) are easier to break - ideal for breakout entries
False breakout avoidance: Strong zones (thick lines, high win rates) require more confirmation before entering
For Position Management:
Exit planning: Take profits at high-confluence zones ahead
Stop placement: Use strong zones as logical stop-loss levels
Trade filtering: Higher probability setups occur at stronger zones
Key Advantages:
Objective confluence detection - No manual line drawing needed
Data-driven validation - Historical performance shows which zones actually matter
Adaptive intelligence - Zones strengthen/weaken based on real price action
Clean visualization - Top zones only, with compact labels showing score and factors
Customizable - Adjust weights, components, and thresholds to your trading style
Bottom Line:
Instead of guessing which technical level matters most, this indicator does the heavy lifting - analyzing multiple factors, validating them historically, and highlighting only the zones where price is most likely to react. It's like having confluence analysis automated with statistical backing.

Digital RPM HUD — 4 Feeds + Confidence + Timeline (v3)🏎️ Digital RPM HUD — 4 Feeds + Confidence + Timeline (v3)
A performance-style trading dashboard for momentum-driven traders.
The Digital RPM HUD gives you an instant visual readout of market “engine speed” — combining four customizable data feeds (Trend, Momentum, Volume, Volatility) into a single confidence score (0–100) and a color-coded timeline of regime changes.
Think of it as a racing-inspired control panel: you only “hit the throttle” when confidence is high and all systems agree.
🔧 Key Features
4 Data Feeds – assign your own logic (EMA, RSI, RVOL, ATR, etc.).
Confidence Meter – blends the four feeds into one smooth 0–100 reading.
Timeline Strip – shows recent bullish / bearish / neutral states at a glance.
Visual Trade Cues – optional on-chart LONG / SHORT / EXIT markers.
Fully Customizable – thresholds, weights, smoothing, colors, layout.
HUD Overlay – clean, minimal, and adjustable to any corner of your chart.
💡 How to Use
Configure each feed to reflect your preferred signals (e.g., trend EMA 200, momentum RSI 14, volume RVOL 20, volatility ATR 14).
Watch the Confidence gauge:
✅ Above Bull Threshold → Market acceleration / long bias.
❌ Below Bear Threshold → Momentum loss / short bias.
⚪ Between thresholds → Neutral zone; stay patient.
Use the Timeline to confirm trend consistency — more green = bullish regime, more red = bearish.
⚙️ Recommended Setups
Scalping: Trend EMA 50 + RSI 7 + RVOL 10 + ATR 7 → Fast response.
Intraday: EMA 200 + RSI 14 + RVOL 20 + ATR 14 → Balanced signal.
Swing: Multi-TF Trend + MACD + RVOL + ATR → Smooth and steady.
⚠️ Disclaimer
This script is not a trading strategy and does not execute trades.
All signals are visual aids — always confirm with your own analysis and risk management.

Total Info Indicator by MikePenzin
Install & Add to Chart
• Copy the script into Pine Editor → click Add to Chart .
• Open the ⚙️ Settings → Inputs to customize.
What It Does
• Displays key info in a floating table — trend, volume, ATR, RSI, stop loss, and more.
• Detects breakouts , smart SELL signals , and opening strength .
• Uses emojis and colours to make trends easy to read: 🟢 good, 🟡 neutral, 🔴 risky.
For Swing Traders
• Works best on Daily or 4H charts.
• Watch for 🟢 Uptrend + ⚡BUY / 🔥BUY breakout signals.
• Use ATR-based Stop Loss (shown in table).
• Avoid new entries a few days before earnings.
Suggested Setup
• 20/50/150 MA Lines: ON
• 200 MA Line: optional
• ATR Multiplier: 1.3
• Breakout Detection: ON (Volume + RSI + Trend filters)
• Smart SELLs: ON (RSI 70, EMA 20)
• Pivots: ON for quick swing levels
How to Read
• MA Row: 🟢 = price above MA (bullish).
• ATR/Stop Loss: Suggests where to place protective stop.
• Volume Info: Today’s vs 20-day average, plus pace.
• RSI & CCI: Shows momentum and overbought/oversold levels.
• Breakouts: ⚡BUY (early), 🔥BUY (confirmed).
• Smart SELLs: RSI🔴 / DIV🟣 / EMA🔵 mean potential exit zones.
Example Use
1️⃣ Find stocks with Uptrend 🟢 , rising volume, and ⚡BUY signal.
2️⃣ Enter near breakout; set Stop = shown level.
3️⃣ Take profits or trail when Smart SELLs appear or RSI peaks.
Tips
• Choose table corner under “Table Visualization.”
• Reduce clutter on small timeframes (turn off Pivots/200 MA).
• Use “Volume speed” to spot surging interest before breakouts.
• Compatible with most equities and ETFs.
Disclaimer
This script is for education & analysis only .
Not financial advice — always manage your own risk.

Daily/Weekly EMAs on Lower TimeframesThis indicator allows traders to view Daily and Weekly EMAs (Exponential Moving Averages) directly on lower timeframes such as 1m, 5m, 15m, or 1h charts — providing a higher timeframe perspective without switching charts.
The script includes individual checkboxes for each EMA length — 5, 8, 9, 21, 50, and 200 — organized into two clear sections:
🟢 Daily EMAs
🔵 Weekly EMAs
You can selectively enable or disable any EMA to match your trading style and reduce chart clutter.
Each EMA is color-coded for clarity and consistency:
5 EMA: Green
8 EMA: Blue
9 EMA: Blue
21 EMA: Orange
50 EMA: Purple
200 EMA: Red
Weekly EMAs appear slightly transparent to distinguish them from daily ones.
This makes it easy to visualize higher timeframe trend direction, confluence zones, and dynamic support/resistance levels while trading intraday.
💡 Key Features
View Daily and Weekly EMAs on smaller timeframes.
Individual checkbox toggles for all 6 EMA lengths.
Separate sections for Daily and Weekly EMAs.
Color-coded lines for easy visual recognition.
Works seamlessly on any symbol or timeframe below Daily.
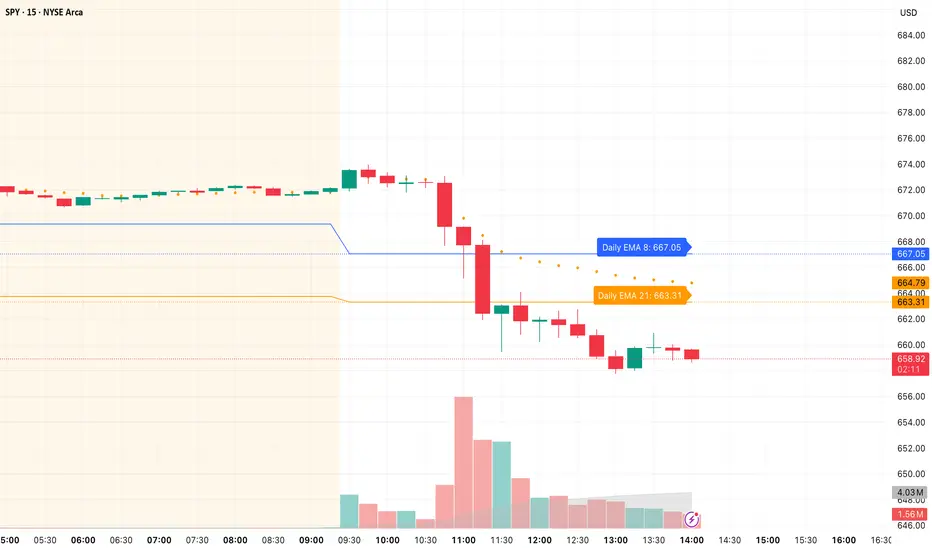
Bitcoin Cycle History Visualization [SwissAlgo]BTC 4-Year Cycle Tops & Bottoms
Historical visualization of Bitcoin's market cycles from 2010 to present, with projections based on weighted averages of past performance.
-----------------------------------------------------------------
CALCULATION METHODOLOGY
Why Bottom-to-Bottom Cycle Measurement?
This indicator defines cycles as bottom-to-bottom periods. This is one of several valid approaches to Bitcoin cycle analysis:
- Focuses on market behavior (price bottoms) rather than supply schedule events (halving-to-halving)
- Bottoms may offer good reference points for some analytical purposes
- Tops tend to be extended periods that are harder to define precisely
- Aligns with how some traditional asset cycles are measured and the timing observed in the broader "risk-on" assets category
- Halving events are shown separately (yellow backgrounds) for reference
- Neither halving-based nor bottom-based measurement is inherently superior
Different analysts prefer different cycle definitions based on their analytical goals. This approach prioritizes observable market turning points.
Cycle Date Definitions
- Approximate monthly ranges used for each event (e.g., Nov 2022 bottom = Nov 1-30, 2022)
- Cycle 1: Jul 2010 bottom → Jun 2011 top → Nov 2011 bottom
- Cycle 2: Nov 2011 bottom → Dec 2013 top → Jan 2015 bottom
- Cycle 3: Jan 2015 bottom → Dec 2017 top → Dec 2018 bottom
- Cycle 4: Dec 2018 bottom → Nov 2021 top → Nov 2022 bottom
- Future cycles will be added as new top/bottom dates become firm
Duration Calculations
- Days = timestamp difference converted to days (milliseconds ÷ 86,400,000)
- Bottom → Top: days from cycle bottom to peak
- Top → Bottom: days from peak to next cycle bottom
- Bottom → Bottom: full cycle duration (sum of above)
Price Change Calculations
- % Change = ((New Price - Old Price) / Old Price) × 100
- Example: $200 → $19,700 = ((19,700 - 200) / 200) × 100 = 9,750% gain
- Approximate historical prices used (rounded to significant figures)
Weighted Average Formula
Recent cycles weighted more heavily to reflect the evolved market structure:
- Cycle 1 (2010-2011): EXCLUDED (too early-stage, tiny market cap)
- Cycle 2 (2011-2015): Weight = 1x
- Cycle 3 (2015-2018): Weight = 3x
- Cycle 4 (2018-2022): Weight = 5x
Formula: Weighted Avg = (C2×1 + C3×3 + C4×5) / (1+3+5)
Example for Bottom→Top days: (761×1 + 1065×3 + 1066×5) / 9 = 1,032 days
Projection Method
- Projected Top Date = Nov 2022 bottom + weighted avg Bottom→Top days
- Projected Bottom Date = Nov 2022 bottom + weighted avg Bottom→Bottom days
- Current days elapsed compared to weighted averages
- Warning symbol (⚠) shown when the current cycle exceeds the historical average
Technical Implementation
- Historical cycle dates are hardcoded (not algorithmically detected)
- Dates represent approximate monthly ranges for each event
- The indicator will be updated as the Cycle 5 top and bottom dates become confirmed
- Updates require manual code maintenance - not automatic
- Users should verify they're using the latest version for current cycle data
-----------------------------------------------------------------
FEATURES
- Background highlights for historical tops (red), bottoms (green), and halving events (yellow)
- Data table showing cycle durations and price changes
- Visual cycle boundary boxes with subtle coloring
- Projected timeframes displayed as dashed vertical lines
- Toggle on/off for each visual element
- Customizable background colors
-----------------------------------------------------------------
DISPLAY SETTINGS
- Show/hide cycle tops, bottoms, halvings, data table, and cycle boxes
- Customizable background colors for each event type
- Clean, institutional-grade visual design suitable for analysis
UPDATES & MAINTENANCE
This indicator is maintained as new cycle events occur. When Cycle 5's top and bottom are confirmed with sufficient time elapsed, the code and projections will be updated accordingly. Check for the latest version periodically.
OPEN SOURCE
Code available for review, modification, and improvement. Educational transparency is prioritized.
-----------------------------------------------------------------
IMPORTANT LIMITATIONS
⚠ EXTREMELY SMALL SAMPLE SIZE
Based on only 4 complete cycles (2011-2022). In statistical analysis, this is insufficient for reliable predictions.
⚠ CHANGED MARKET STRUCTURE
Bitcoin's market has fundamentally evolved since early cycles:
- 2010-2015: Tiny market cap, retail-only, unregulated
- 2024-2025: Institutional adoption, spot ETFs, regulatory frameworks, macro correlation
The environment that created past patterns no longer exists in the same form.
⚠ NO PREDICTIVE GUARANTEE
Historical patterns can and do break. Market cycles are not laws of physics. Past performance does not guarantee future results. The next cycle may not follow historical averages.
⚠ LENGTHENING CYCLE THEORY
Some analysts believe cycles are extending over time (diminishing returns, maturing market). If true, simple averaging underestimates future cycle lengths.
⚠ SELF-FULFILLING PROPHECY RISK
The halving narrative may be partially circular - it works because people believe it works. Sufficient changes in market structure or participant behavior can invalidate the pattern.
⚠ APPROXIMATE DATA
Historical prices rounded to significant figures. Exact bottom/top dates vary by exchange. Month-long ranges are used for simplicity.
EDUCATIONAL USE ONLY
This indicator is designed for historical analysis and understanding Bitcoin's past behavior. It is NOT:
- Trading advice or financial recommendations
- A guarantee or prediction of future price movements
- Suitable as a sole basis for investment decisions
- A replacement for fundamental or technical analysis
The projections show "what if the pattern continues exactly" - not "what will happen."
Always conduct independent research, understand the risks, and consult qualified financial advisors before making investment decisions. Only invest what you can afford to lose.
