Session

Example - Custom Defined Dual-State SessionThis script example aims to cover the following:
defining custom timeframe / session windows
gather a price range from the custom period ( high/low values )
create a secondary "holding" period through which to display the data collected from the initial session
simple method to shift times to re-align to preferred timezone
Articles and further reading:
www.investopedia.com - trading session
Reason for Study:
Educational purposes only.
Before considering writing this example I had seen multiple similar questions
asking how to go about creating custom timeframes or sessions, so it seemed
this might be a good topic to attempt to create a relatively generic example.

Flexible timezone-aware session rangeAllows you to define session range with local time and its timezone, also can toggle session visibility any day of week.

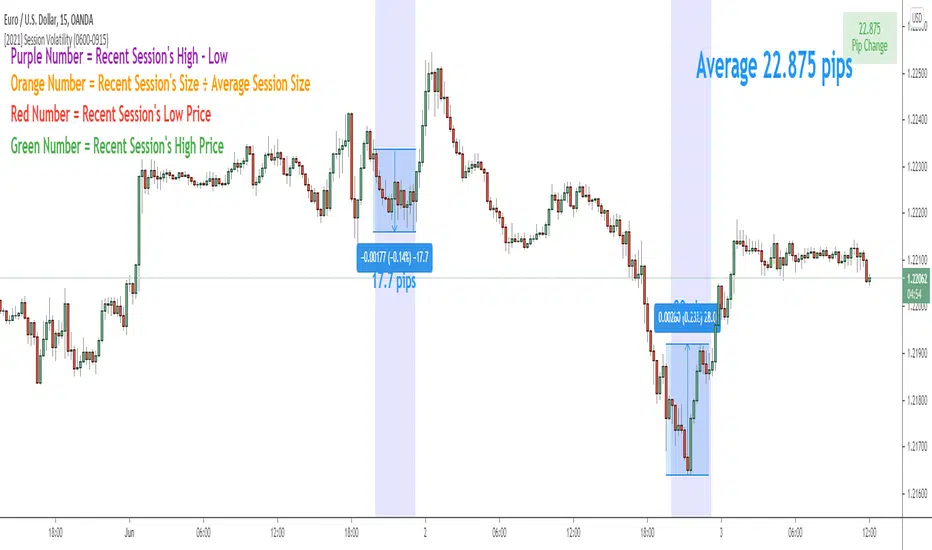
Session Volatility CalculatorHey traders!
This script calculates the average volatility of trading sessions.
You specify a start date, an end date, and a session time (eg. market open, Asian session etc)
The script then scans through all the price action on your chart and calculates the average price movement during that specified period.
What Is It For?
I created this script for my own purposes when developing certain strategies and testing certain ideas.
The purpose of this script is to give you an idea of how much price tends to move during certain times of day for certain markets.
You could think of it as a "session's average true range".
In crypto and forex this might be how much price tends to move on certain pairs during the Australian/Asian session, or the European session, or the overnight U.S. session etc.
In stocks this might be how much a symbol tends to move during the first hour of the day or the last hour of the day.
The point of calculating this information is for better understanding how markets move during certain times of day.
It's not a perfect science obviously since some days can be wilder than others depending on what fundamental events are developing, but it's useful information to have for times when there are no expected volatility-inducing events.
This info can help with optimizing targets and stop loss placement for certain day-trading strategies, and just generally getting an idea of what kinds of moves you might reasonably expect out of overnight positions or certain times of day etc - or at least that's what I use it for.
Settings
Hover your mouse over the "i" symbol to get more information on the script's settings, but here's a brief description:
Start Date: The date to begin calculating from (set to 1000 by default so it scans the entire chart).
End Date: The date to stop calculating (set to 2099 by default so it scans the entire chart)
Time Session: This is the time session during the day that you want to analyze.
Color Background: If turned on, this setting changes the background color to highlight the session.
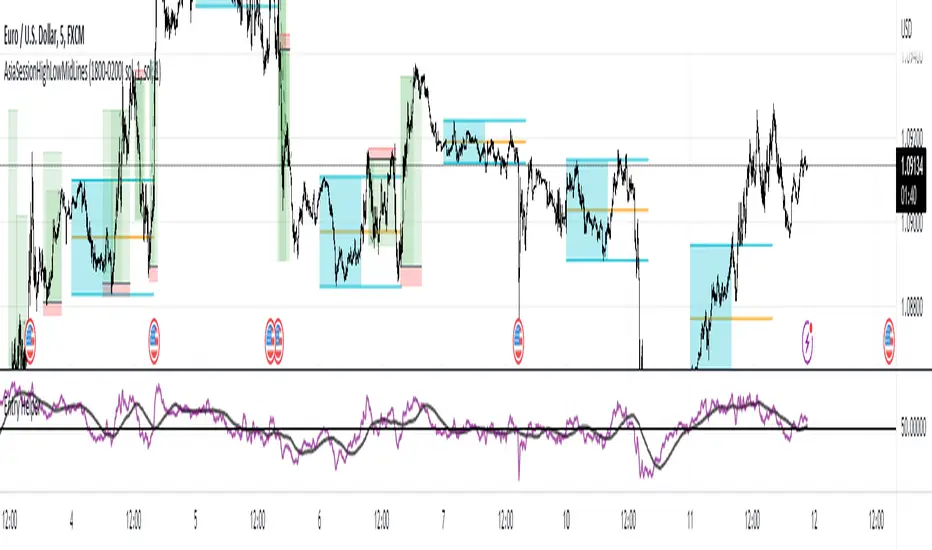
Indicator Values
The indicator outputs a handful of values onto your chart. This is what the colors correspond to:
Top-Right Box: The average price range during the given time of day over historical price action.
Green Number: The recent session's highest price.
Red Number: The recent session's lowest price.
Purple Number: The recent session's price range (high - low).
Orange Number: The recent session's range ÷ the average (outputs a relative % of the average).
Day and Time HighlightYet another sweet little tool that highlights only specific days and time.
For example, you can highlight only Tuesday's and Friday's from 0930-1600
You can adjust to any day of the week and any time of the day.
You can request more improvements upon this version. Cheers!
Like if you Like and Follow me for upcoming indicators/strategies: www.tradingview.com

Trading SessionsSimple Indicator which shows 6 major trading sessions
in a label it shows what sessions are currently active or not
the background will color if you are in the session
The time can be easily adjusted in the settings as well as how the sessions are displayed

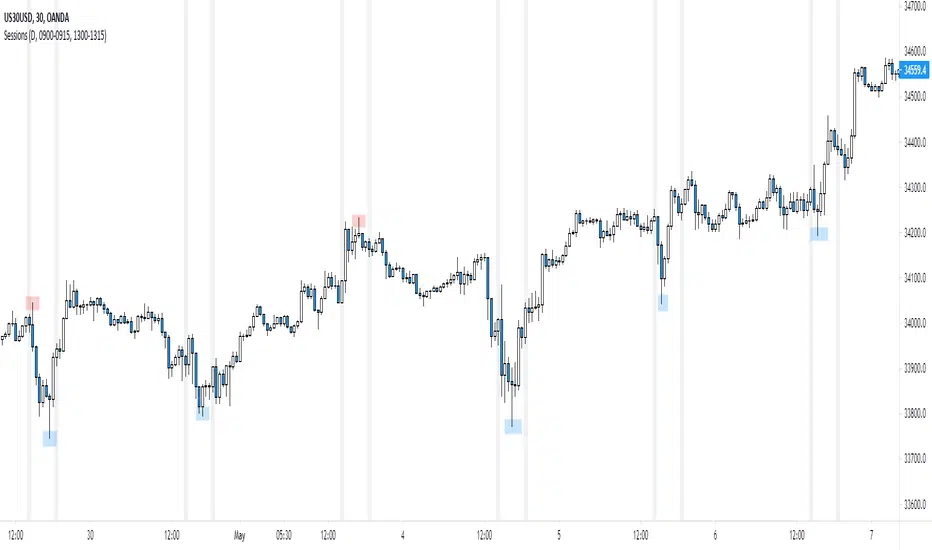
NY Session
Script to highlight the new york session trading hours
-The most volatile hours for us30 & the time in which it's most likely to make a significant high/low
[UTILS] Session Input ParserAn utility function to parse session inputs. Extracts hours, minutes and weekdays (if defined) and returns a tuple as the result.
_parseSession(sessionString) => (hourStart, minuteStart, hourEnd, minuteEnd, weekdaysArray)
Examples presented on the chart.

Session Breaks by KrisWatersThis indicator draw vertical lines on session break dates. There are 1H, 4H, D, W, M, 3M, 12M options. You can change line colors and style as you wish.
If you are using this indicator please drop me comment and like also.

Reivaj MA - PreSession This script contains 9 moving averages which can be changed each between "sma", "ema", "wma", "vwma.
The values of the moving averages are:
MMA20 = SMA20
MMA50 = SMA50
MMA100 = SMA100
MMA200 = SMA200
MMA300 = SMA300.
MMAextra1 = ema 8
MMAextra2 = ema21
MMAextra3 = sma400
MMAextra4 = sma500.
It has an Asian range that goes from 21: 00-07: 00 UTC which turns the color of the candle in green.
And pre-sessions that is one hour before the opening, the time of the opening and the hour after the opening of London and New York.

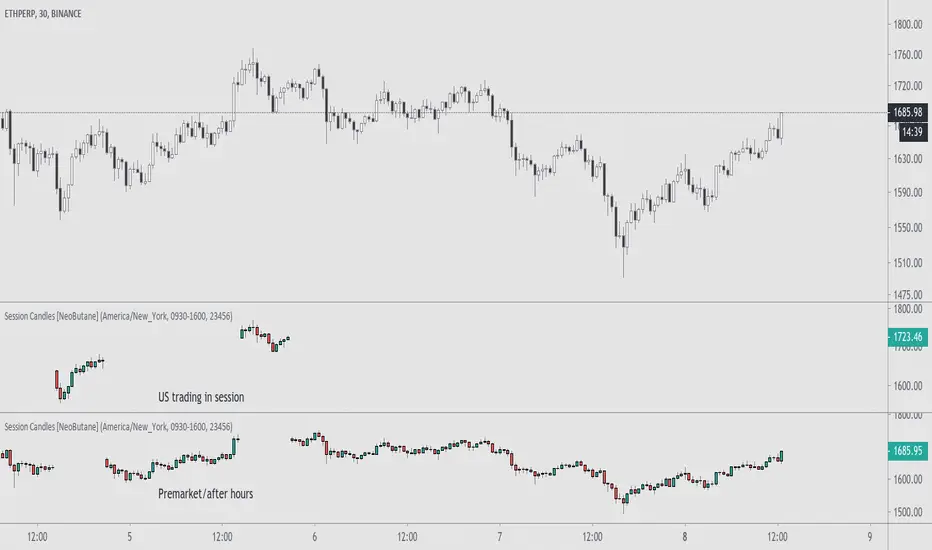
Trading Session Candles [NeoButane]█ OVERVIEW
Display candlesticks for the selected session, regular or extended.
█ CONFIGURATION
Options to change include displaying the regular or extended session, timezone, session hours, and session days.
█ CONCEPTS
Meant for charts with longer trading sessions or to view only extended hours trading action on US stocks that have afterhours available.
█ Notes
For trading days, '23456' refers to Monday to Friday.
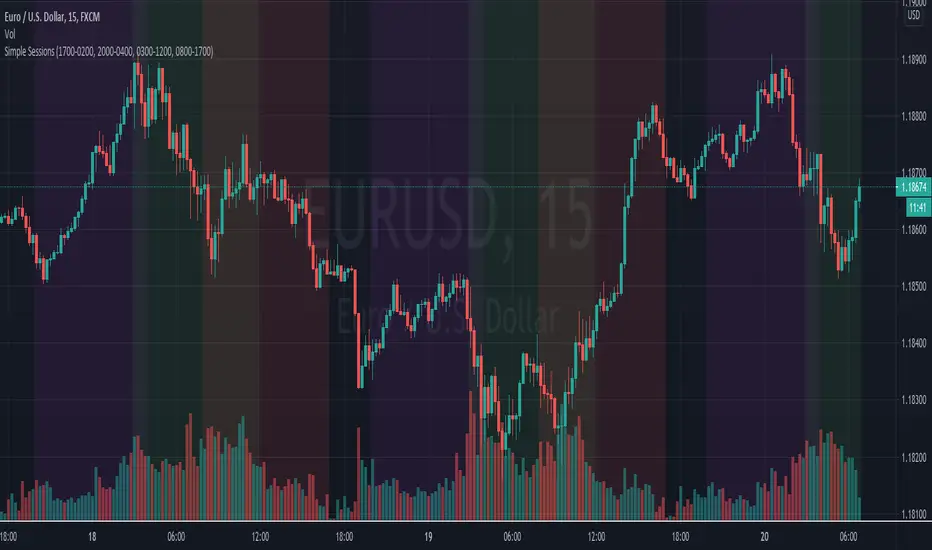
Simple Sessions## Background ##
Simple Sessions is based on the very awesome "Sessions on Chart" by Aurocks_AIF.
I really liked how the background colours worked but wanted to simplify it by removing some parts that I didn't use. I then simplified much of the code, put it into my standard template format and re-published. Hopefully the code is a bit cleaner and easier to read now.
## Usage ##
The default indicator shows the following sessions:
* Sydney in Navy
* Tokyo in Purple
* London in Green
* New York in Red
The good news is that using Green and Red for London and New York, gives a nice distinct yellow for the overlapping sessions. Sydney and Tokyo are by in similar colors by design.
By default, only London and New York show, but you may turn on Sydney and Tokyo in the settings.
## Use, Share, Like, etc #
Have fun!
-- chilts
Session Range and Breakout Summary
This script presents the session range and post session movements relative to that range of all the majors and crosses on a single page. You can also set it to a daily range and weekly range (beta). It will even show you the pip value of the range. I made the indicator to easily stay on top of market movements at london open relative to the Asia session range. Its very easy to see which entire currency group is breaking its asia range WHIST ITS HAPPENING. Focus on NZD in the examples as it was the market lead today - I was able to get some of it when I saw the entire group breaking its range
Showing all the majors and crosses relative to the Asia range (00:00 - 07:00 GMT)
Active 'show on chart' to verify the indicator is measuring the range correctly. Compare below to the NZD box above - you can see how NZD had control of the market this morning and all NZD pairs broke out of their ranges.
'PIP MODE' - active pip mode to see what the pip range was of the session
Notes
The information is presented RELATIVELY - this means that all the ranges and movements are scaled to be the same size. You are therefore seeing the movements relative to their ranges. When you see a breakout it relative to the size of the range - for example, if GBPJPY had a range of 50pips and breaks out of the range by 100 pip and GBPEUR has a range of 20 pips and breaks out by 40 pips they have both broken out double the range and will be displayed as the same distance.
The indicator will show the movements whilst the range is forming. I did this so I can see what the groups are doing before Europe open and be ready - such as lingering at the top end of its INCOMPLETE asia range. Be aware through that if the lines are flat at the top of the range WHILST THE RANGE IS STILL FORMING this does not mean price was flat, it means that price was pushing up and growing the range. (Price can't breakout until the range has formed at the end of the session)
The currency pairs are organised to show the strength or weakness of the selected group - this means that the base currency is always the select group. This is to present the data with currencies moving in the same direction rather than some reversed but meaning the same in relation to currency strength. In the NZD example:
NZDAUD (not AUDNZD )
NZDCAD
NZDCHF
NZDEUR (not EURNZD )
NZDGBP (not GBPNZD )
NZDJPY
NZDUSD
I hope its useful. This is the most powerful indicator I've managed to write yet. It was difficult to make the code efficient enough to fit into the pinescript limit and still do everything.

Universal Global SessionUniversal Global Session
This Script combines the world sessions of: Stocks, Forex, Bitcoin Kill Zones, strategic points, all configurable, in a single Script, to capitalize the opening and closing times of global exchanges as investment assets, becoming an Universal Global Session .
It is based on the great work of @oscarvs ( BITCOIN KILL ZONES v2 ) and the scripts of @ChrisMoody. Thank you Oscar and Chris for your excellent judgment and great work.
At the end of this writing you can find all the internet references of the extensive documentation that I present here. To maximize your benefits in the use of this Script, I recommend that you read the entire document to create an objective and practical criterion.
All the hours of the different exchanges are presented at GMT -6. In Market24hClock you can adjust it to your preferences.
After a deep investigation I have been able to show that the different world sessions reveal underlying investment cycles, where it is possible to find sustained changes in the nominal behavior of the trend before the passage from one session to another and in the natural overlaps between the sessions. These underlying movements generally occur 15 minutes before the start, close or overlap of the session, when the session properly starts and also 15 minutes after respectively. Therefore, this script is designed to highlight these particular trending behaviors. Try it, discover your own conclusions and let me know in the notes, thank you.
Foreign Exchange Market Hours
It is the schedule by which currency market participants can buy, sell, trade and speculate on currencies all over the world. It is open 24 hours a day during working days and closes on weekends, thanks to the fact that operations are carried out through a network of information systems, instead of physical exchanges that close at a certain time. It opens Monday morning at 8 am local time in Sydney —Australia— (which is equivalent to Sunday night at 7 pm, in New York City —United States—, according to Eastern Standard Time), and It closes at 5pm local time in New York City (which is equivalent to 6am Saturday morning in Sydney).
The Forex market is decentralized and driven by local sessions, where the hours of Forex trading are based on the opening range of each active country, becoming an efficient transfer mechanism for all participants. Four territories in particular stand out: Sydney, Tokyo, London and New York, where the highest volume of operations occurs when the sessions in London and New York overlap. Furthermore, Europe is complemented by major financial centers such as Paris, Frankfurt and Zurich. Each day of forex trading begins with the opening of Australia, then Asia, followed by Europe, and finally North America. As markets in one region close, another opens - or has already opened - and continues to trade in the currency market. The seven most traded currencies in the world are: the US dollar, the euro, the Japanese yen, the British pound, the Australian dollar, the Canadian dollar, and the New Zealand dollar.
Currencies are needed around the world for international trade, this means that operations are not dominated by a single exchange market, but rather involve a global network of brokers from around the world, such as banks, commercial companies, central banks, companies investment management, hedge funds, as well as retail forex brokers and global investors. Because this market operates in multiple time zones, it can be accessed at any time except during the weekend, therefore, there is continuously at least one open market and there are some hours of overlap between the closing of the market of one region and the opening of another. The international scope of currency trading means that there are always traders around the world making and satisfying demands for a particular currency.
The market involves a global network of exchanges and brokers from around the world, although time zones overlap, the generally accepted time zone for each region is as follows:
Sydney 5pm to 2am EST (10pm to 7am UTC)
London 3am to 12 noon EST (8pm to 5pm UTC)
New York 8am to 5pm EST (1pm to 10pm UTC)
Tokyo 7pm to 4am EST (12am to 9am UTC)
Trading Session
A financial asset trading session refers to a period of time that coincides with the daytime trading hours for a given location, it is a business day in the local financial market. This may vary according to the asset class and the country, therefore operators must know the hours of trading sessions for the securities and derivatives in which they are interested in trading. If investors can understand market hours and set proper targets, they will have a much greater chance of making a profit within a workable schedule.
Kill Zones
Kill zones are highly liquid events. Many different market participants often come together and perform around these events. The activity itself can be event-driven (margin calls or option exercise-related activity), portfolio management-driven (asset allocation rebalancing orders and closing buy-in), or institutionally driven (larger players needing liquidity to complete the size) or a combination of any of the three. This intense cross-current of activity at a very specific point in time often occurs near significant technical levels and the established trends emerging from these events often persist until the next Death Zone approaches or enters.
Kill Zones are evolving with time and the course of world history. Since the end of World War II, New York has slowly invaded London's place as the world center for commercial banking. So much so that during the latter part of the 20th century, New York was considered the new center of the financial universe. With the end of the cold war, that leadership appears to have shifted towards Europe and away from the United States. Furthermore, Japan has slowly lost its former dominance in the global economic landscape, while Beijing's has increased dramatically. Only time will tell how these death zones will evolve given the ever-changing political, economic, and socioeconomic influences of each region.
Financial Markets
New York
New York (NYSE Chicago, NASDAQ)
7:30 am - 2:00 pm
It is the second largest currency platform in the world, followed largely by foreign investors as it participates in 90% of all operations, where movements on the New York Stock Exchange (NYSE) can have an immediate effect (powerful) on the dollar, for example, when companies merge and acquisitions are finalized, the dollar can instantly gain or lose value.
A. Complementary Stock Exchanges
Brazil (BOVESPA - Brazilian Stock Exchange)
07:00 am - 02:55 pm
Canada (TSX - Toronto Stock Exchange)
07:30 am - 02:00 pm
New York (NYSE - New York Stock Exchange)
08:30 am - 03:00 pm
B. North American Trading Session
07:00 am - 03:00 pm
(from the beginning of the business day on NYSE and NASDAQ, until the end of the New York session)
New York, Chicago and Toronto (Canada) open the North American session. Characterized by the most aggressive trading within the markets, currency pairs show high volatility. As the US markets open, trading is still active in Europe, however trading volume generally decreases with the end of the European session and the overlap between the US and Europe.
C. Strategic Points
US main session starts in 1 hour
07:30 am
The euro tends to drop before the US session. The NYSE, CHX and TSX (Canada) trading sessions begin 1 hour after this strategic point. The North American session begins trading Forex at 07:00 am.
This constitutes the beginning of the overlap of the United States and the European market that spans from 07:00 am to 10:35 am, often called the best time to trade EUR / USD, it is the period of greatest liquidity for the main European currencies since it is where they have their widest daily ranges.
When New York opens at 07:00 am the most intense trading begins in both the US and European markets. The overlap of European and American trading sessions has 80% of the total average trading range for all currency pairs during US business hours and 70% of the total average trading range for all currency pairs during European business hours. The intersection of the US and European sessions are the most volatile overlapping hours of all.
Influential news and data for the USD are released between 07:30 am and 09:00 am and play the biggest role in the North American Session. These are the strategically most important moments of this activity period: 07:00 am, 08:00 am and 08:30 am.
The main session of operations in the United States and Canada begins
08:30 am
Start of main trading sessions in New York, Chicago and Toronto. The European session still overlaps the North American session and this is the time for large-scale unpredictable trading. The United States leads the market. It is difficult to interpret the news due to speculation. Trends develop very quickly and it is difficult to identify them, however trends (especially for the euro), which have developed during the overlap, often turn the other way when Europe exits the market.
Second hour of the US session and last hour of the European session
09:30 am
End of the European session
10:35 am
The trend of the euro will change rapidly after the end of the European session.
Last hour of the United States session
02:00 pm
Institutional clients and very large funds are very active during the first and last working hours of almost all stock exchanges, knowing this allows to better predict price movements in the opening and closing of large markets. Within the last trading hours of the secondary market session, a pullback can often be seen in the EUR / USD that continues until the opening of the Tokyo session. Generally it happens if there was an upward price movement before 04:00 pm - 05:00 pm.
End of the trade session in the United States
03:00 pm
D. Kill Zones
11:30 am - 1:30 pm
New York Kill Zone. The United States is still the world's largest economy, so by default, the New York opening carries a lot of weight and often comes with a huge injection of liquidity. In fact, most of the world's marketable assets are priced in US dollars, making political and economic activity within this region even more important. Because it is relatively late in the world's trading day, this Death Zone often sees violent price swings within its first hour, leading to the proven adage "never trust the first hour of trading in America. North.
---------------
London
London (LSE - London Stock Exchange)
02:00 am - 10:35 am
Britain dominates the currency markets around the world, and London is its main component. London, a central trading capital of the world, accounts for about 43% of world trade, many Forex trends often originate from London.
A. Complementary Stock Exchange
Dubai (DFM - Dubai Financial Market)
12:00 am - 03:50 am
Moscow (MOEX - Moscow Exchange)
12:30 am - 10:00 am
Germany (FWB - Frankfurt Stock Exchange)
01:00 am - 10:30 am
Afríca (JSE - Johannesburg Stock Exchange)
01:00 am - 09:00 am
Saudi Arabia (TADAWUL - Saudi Stock Exchange)
01:00 am - 06:00 am
Switzerland (SIX - Swiss Stock Exchange)
02:00 am - 10:30 am
B. European Trading Session
02:00 am - 11:00 am
(from the opening of the Frankfurt session to the close of the Order Book on the London Stock Exchange / Euronext)
It is a very liquid trading session, where trends are set that start during the first trading hours in Europe and generally continue until the beginning of the US session.
C. Middle East Trading Session
12:00 am - 06:00 am
(from the opening of the Dubai session to the end of the Riyadh session)
D. Strategic Points
European session begins
02:00 am
London, Frankfurt and Zurich Stock Exchange enter the market, overlap between Europe and Asia begins.
End of the Singapore and Asia sessions
03:00 am
The euro rises almost immediately or an hour after Singapore exits the market.
Middle East Oil Markets Completion Process
05:00 am
Operations are ending in the European-Asian market, at which time Dubai, Qatar and in another hour in Riyadh, which constitute the Middle East oil markets, are closing. Because oil trading is done in US dollars, and the region with the trading day coming to an end no longer needs the dollar, consequently, the euro tends to grow more frequently.
End of the Middle East trading session
06:00 am
E. Kill Zones
5:00 am - 7:00 am
London Kill Zone. Considered the center of the financial universe for more than 500 years, Europe still has a lot of influence in the banking world. Many older players use the European session to establish their positions. As such, the London Open often sees the most significant trend-setting activity on any trading day. In fact, it has been suggested that 80% of all weekly trends are set through the London Kill Zone on Tuesday.
F. Kill Zones (close)
2:00 pm - 4:00 pm
London Kill Zone (close).
---------------
Tokyo
Tokyo (JPX - Tokyo Stock Exchange)
06:00 pm - 12:00 am
It is the first Asian market to open, receiving most of the Asian trade, just ahead of Hong Kong and Singapore.
A. Complementary Stock Exchange
Singapore (SGX - Singapore Exchange)
07:00 pm - 03:00 am
Hong Kong (HKEx - Hong Kong Stock Exchange)
07:30 pm - 02:00 am
Shanghai (SSE - Shanghai Stock Exchange)
07:30 pm - 01:00 am
India (NSE - India National Stock Exchange)
09:45 pm - 04:00 am
B. Asian Trading Session
06:00 pm - 03:00 am
From the opening of the Tokyo session to the end of the Singapore session
The first major Asian market to open is Tokyo which has the largest market share and is the third largest Forex trading center in the world. Singapore opens in an hour, and then the Chinese markets: Shanghai and Hong Kong open 30 minutes later. With them, the trading volume increases and begins a large-scale operation in the Asia-Pacific region, offering more liquidity for the Asian-Pacific currencies and their crosses. When European countries open their doors, more liquidity will be offered to Asian and European crossings.
C. Strategic Points
Second hour of the Tokyo session
07:00 pm
This session also opens the Singapore market. The commercial dynamics grows in anticipation of the opening of the two largest Chinese markets in 30 minutes: Shanghai and Hong Kong, within these 30 minutes or just before the China session begins, the euro usually falls until the same moment of the opening of Shanghai and Hong Kong.
Second hour of the China session
08:30 pm
Hong Kong and Shanghai start trading and the euro usually grows for more than an hour. The EUR / USD pair mixes up as Asian exporters convert part of their earnings into both US dollars and euros.
Last hour of the Tokyo session
11:00 pm
End of the Tokyo session
12:00 am
If the euro has been actively declining up to this time, China will raise the euro after the Tokyo shutdown. Hong Kong, Shanghai and Singapore remain open and take matters into their own hands causing the growth of the euro. Asia is a huge commercial and industrial region with a large number of high-quality economic products and gigantic financial turnover, making the number of transactions on the stock exchanges huge during the Asian session. That is why traders, who entered the trade at the opening of the London session, should pay attention to their terminals when Asia exits the market.
End of the Shanghai session
01:00 am
The trade ends in Shanghai. This is the last trading hour of the Hong Kong session, during which market activity peaks.
D. Kill Zones
10:00 pm - 2:00 am
Asian Kill Zone. Considered the "Institutional" Zone, this zone represents both the launch pad for new trends as well as a recharge area for the post-American session. It is the beginning of a new day (or week) for the world and as such it makes sense that this zone often sets the tone for the remainder of the global business day. It is ideal to pay attention to the opening of Tokyo, Beijing and Sydney.
--------------
Sidney
Sydney (ASX - Australia Stock Exchange)
06:00 pm - 12:00 am
A. Complementary Stock Exchange
New Zealand (NZX - New Zealand Stock Exchange)
04:00 pm - 10:45 pm
It's where the global trading day officially begins. While it is the smallest of the megamarkets, it sees a lot of initial action when markets reopen Sunday afternoon as individual traders and financial institutions are trying to regroup after the long hiatus since Friday afternoon. On weekdays it constitutes the end of the current trading day where the change in the settlement date occurs.
B. Pacific Trading Session
04:00 pm - 12:00 am
(from the opening of the Wellington session to the end of the Sydney session)
Forex begins its business hours when Wellington (New Zealand Exchange) opens local time on Monday. Sydney (Australian Stock Exchange) opens in 2 hours. It is a session with a fairly low volatility, configuring itself as the calmest session of all. Strong movements appear when influential news is published and when the Pacific session overlaps the Asian Session.
C. Strategic Points
End of the Sydney session
12:00 am
---------------
Conclusions
The best time to trade is during overlaps in trading times between open markets. Overlaps equate to higher price ranges, creating greater opportunities.
Regarding press releases (news), it should be noted that these in the currency markets have the power to improve a normally slow trading period. When a major announcement is made regarding economic data, especially when it goes against the predicted forecast, the coin can lose or gain value in a matter of seconds. In general, the more economic growth a country produces, the more positive the economy is for international investors. Investment capital tends to flow to countries that are believed to have good growth prospects and subsequently good investment opportunities, leading to the strengthening of the country's exchange rate. Also, a country that has higher interest rates through its government bonds tends to attract investment capital as foreign investors seek high-yield opportunities. However, stable economic growth and attractive yields or interest rates are inextricably intertwined. It's important to take advantage of market overlaps and keep an eye out for press releases when setting up a trading schedule.
References:
www.investopedia.com
www.investopedia.com
www.investopedia.com
www.investopedia.com
market24hclock.com
market24hclock.com

Background to highlight cash/session range [Futures]A simple script which allows the user to highlight the background of a certain session. At the moment there is only one session available, I will work on multiple highlights for numerous sessions at a later date.

Kviateq - Session PivotsFirst of all, I must say that this script wouldn't be possible without the help of one of the best script developers on TradingView - @ahancock (thanks a bunch for your help)
This script draws opening ranges for each of the sessions - Tokyo, London and New York and plots session high, low and pivot range of the previous session.
So if you trade London session - you would only take longs if we're above the Tokyo pivot range and vice versa for shorts.
Often times previous session's highs act as resistance and lows act as support, so careful trading around those levels.
It is obviously meant for lower timeframes, since each of the sessions only lasts a few hours.
Default settings are set to the exchange that I use and my timezone (GMT +7), so you might need to adjust the settings accordingly.
Tokyo - 12am GMT
London - 7am GMT
New York - 12pm GMT

Session High and Session LowI have heard many people ask for a script that will identify the high and low of a specific session. So, I made one.
Important Note: This indicator has to be set up properly or you will get an error. Important things to note are the length of the range and the session definition. The idea is that you would set it up for what's relevant to your trading. Going too far back in the chart history will cause errors. Setting the session for a time that is not on the chart can cause errors. If you set it to look farther back than there are bars to display, you may get an error. What I've found is that if you get an error, you just need to change the settings to reflect available data and it will be able to compile the script. At the time of its publishing, the default range start is set to 10/01/2020. If you're looking at this years later, you'll probably have to set the range to something more recent.
Features:
Plot or Lines:
Using Plot (displayed), the indicator will track the high/low from the end of the session into the next session. Then at the start of the next session, it will start tracking the high/low of that session until its end, then track that high/low until the start of the next session then reset.
Using lines, it will extend horizontal lines to the right indefinitely. The number of sessions back that the lines apply to is a user-defined number of sessions. There are limits to the number of lines that can be cast on a chart (roughly 40-50). So, the maximum number of sessions you can apply the lines to is the last 21 sessions (42 lines total). That gets really noisy though so I can't imagine that is a limiting factor.
Colors:
You can change the background color and its transparency, as well as turn the background color on or off.
You can change the highs and lows colors
You can adjust the line width to your preference
Session Length:
You can use a continuous session covering any user-defined period (provided its not tooooo many candles back)
You can define the session length for intraday
You can exclude weekends
Display Options:
You can adjust the colors, transparency, and linewidth
You can display the plotline or horizontal lines
You can show/hide the background color.
You can change how many sessions back the horizontal lines will track
Let me know if there's anything this script is missing or if you run into any issues that I might be able to help resolve.
Here's what it looks like with Lines for the last 5 sessions and different background color.

Forex Session Breaks DST AWARE!There seems to be no open source forex trading session DST (Daylight Savings Time) aware scripts which I think is absurd. This amazing community deserves better. So I adapted some code by icostan adding DST capabilities.
Original code by icostan here
I added DST code. Warning may not be perfect yet. Could be a bug or two. It only supports 3 major sessions right now but you can add your own rules for the other timezones by copying my logic.
It is open source so please add the other sessions and regions as needed and update me please.

Hancock - RSI [Session]This is an improvement of my RSI Volume indicator.
I have made a session based RSI indicator which helps to aid the decision making upon session opens and gives a good indication of trend during. It also has various fixes for bugs found in the above indicator.
It has multiple settings to configure:
Use session: This toggles the RSI to be session based mode.
Session - Time: The session hours for the RSI .
Session - Days of Week: This is the days for the session based RSI to use.
Session - Mode: The RSI is reset when a new session starts. This mode adjusts how the initial value of the RSI is calculated:
OC: RSI uses the absolute open - close * volume value.
TR: RSI uses the true range * volume value.
VOL: RSI uses the volume value.
TF - Resolution: This is the lower time frame to be used in calculating the wick adjusted buy and sell volume used in the calculation of Volume weighted RSI . A lower time frame produces more accurate buy and sell volumes.
Use Volume: Enabling this produces a Volume weighted RSI . Disabled produces a normal RSI .
Use Wicks: Enabling this adjusts the calculation for buy and sell volume by taking wicks into account.
RSI - Length: This is the length to be used for the RSI . If session based this is the maximum value the RSI length can be - length can be shorter to not include previous session data.
RSI - Overbought: This is the "overbought" level for the RSI .
RSI - Oversold: This is the "oversold" level for the RSI .
RSI - Threshold: This is the threshold used to indicate trend change colours on the RSI .
Happy Trading
Hancock

ICT Killzone For Crypto Markets.Adjusted for Crypto 24/7 markets
Adjusted for UTC
i have hidden the asian open range and daily bars on my charts , you can choose to have them on
Less screen clutter
London Open 8:00 - 4:30 - Killzone 7:00 - 9:00
NewYork Open 9:30 - 4:00 Killzone 8:00 - 10:00
Shanghai open 9:15 Killzone 8:00 - 10:00
NOT MY ORIGINAL SCRIPT. JUST MODIFIED VERSION

High & Low Of Custom Session - OpeningRange Breakout (Expo)High & Low Of Custom Session - OpeningRange Breakout (Expo) prints the high and the low of a custom session.
I use the indicator to trade the re-test of opening range (high/low) as well as breakouts from the opening range. The same logic can be applied to the session you have chosen.
HOW TO USE
1. Use the indicator to trade the re-tests of the session range.
2. Use the indicator to trade breakouts of session range.
INDICATOR IN ACTION
1-min chart
I hope you find this indicator useful , and please comment or contact me if you like the script or have any questions/suggestions for future improvements. Thanks!
I will continually work on this indicator, so please share your experience and feedback as it will enable me to make even better improvements. Thanks to everyone that has already contacted me regarding my scripts. Your feedback is valuable for future developments!
-----------------
Disclaimer
Copyright by Zeiierman.
The information contained in my scripts/indicators/ideas does not constitute financial advice or a solicitation to buy or sell any securities of any type. I will not accept liability for any loss or damage, including without limitation any loss of profit, which may arise directly or indirectly from the use of or reliance on such information.
All investments involve risk, and the past performance of a security, industry, sector, market, financial product, trading strategy, or individual’s trading does not guarantee future results or returns. Investors are fully responsible for any investment decisions they make. Such decisions should be based solely on an evaluation of their financial circumstances, investment objectives, risk tolerance, and liquidity needs.
My scripts/indicators/ideas are only for educational purposes!

NRD Sessions Basic FunctionsThis script is an extension and modification of a popular BackGround color script.
Added
1. Style and programming standards to make is easier to read and modify
2. broke out Asia to Sydney and Tokyo Sessions
3. added override to show ICT Kill zones for London and New York
4. Made all this configurable via settings Menu
Enjoy
watch this space as I intend to do more complex session scripts to allow for High and Lows and Mondays too :-)
