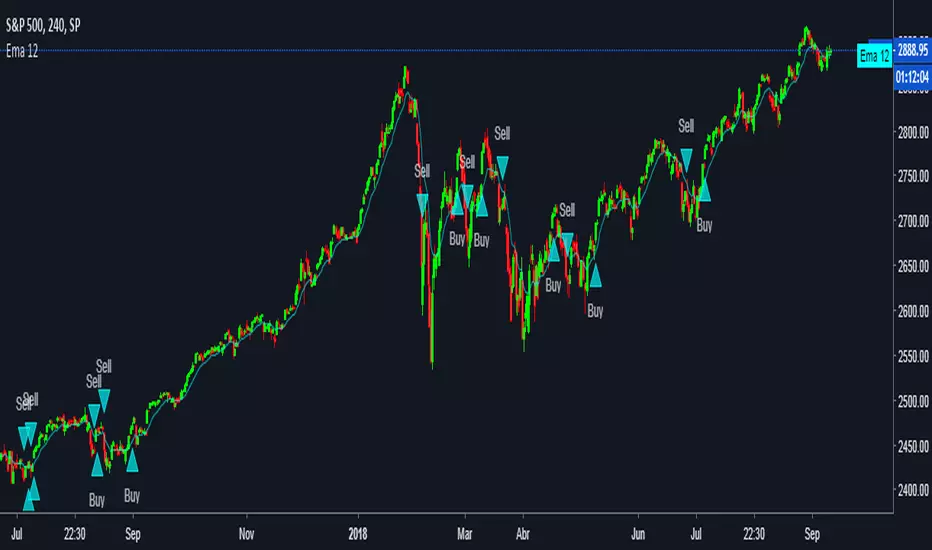
EMA fasterDraw EMA(12) and put a signal when EMA(12) cross with EMA(50). EMA(50) is not rendered on the canvas.Indicateur Pine Script®par SmartChain_Investments1136
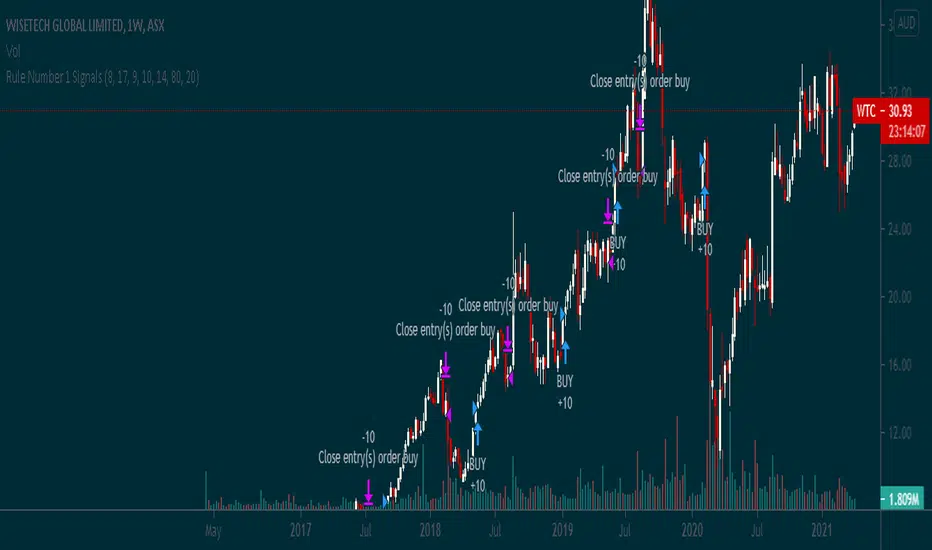
Rule Number 1 SignalsThis script takes the Rule #1 3 tools and plots them on the graph, to provide an additional level of indication for when to sell and when to buy.Stratégie Pine Script®par TraderHalaiMis à jour 66154
Triple EMA-by pooyaPublished by POOYAMONTOYA This is a triple moving average with optional inputs in one oscillator For more information and use our platform please contact usIndicateur Pine Script®par mr_forexbullMis à jour 1153
Double Bollinger Bands + DEMADouble Bollinger Bands + DEMAIndicateur Pine Script®par mustafa-polatMis à jour 11192
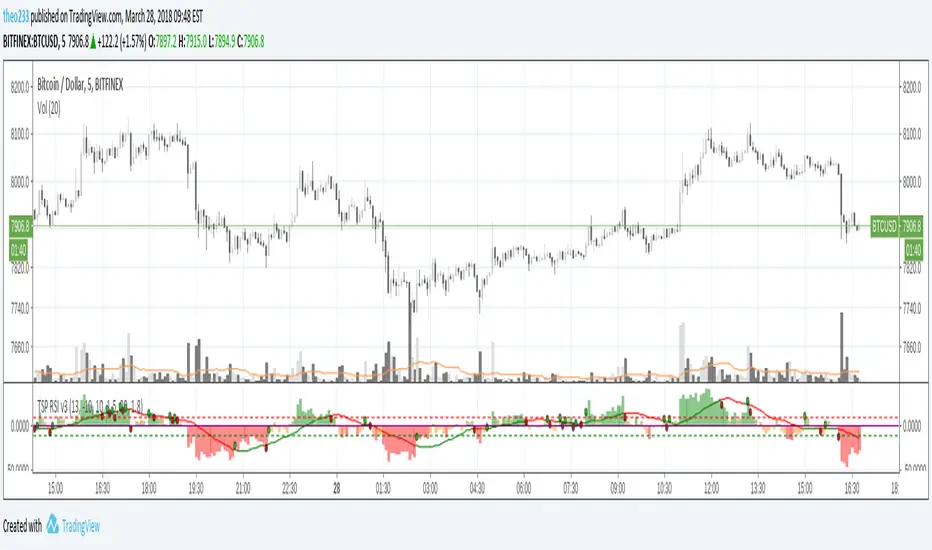
TSP Sexy RSIThe Sexiest RSI in Town ! - Range zone are indicated with lower colors - MA 10 cross signals Indicateur Pine Script®par theo233Mis à jour 33118
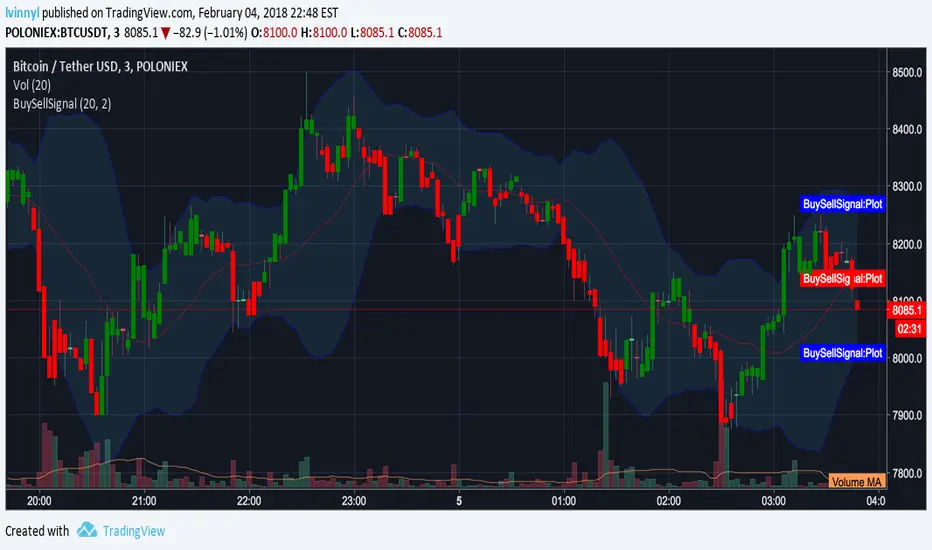
GreenRedSignal with Alerts by lvinnyl// Script created by JoinFree // Modified by lvinnyl to trigger alerts // Click on image below for original script... Indicateur Pine Script®par prosum_solutions55947
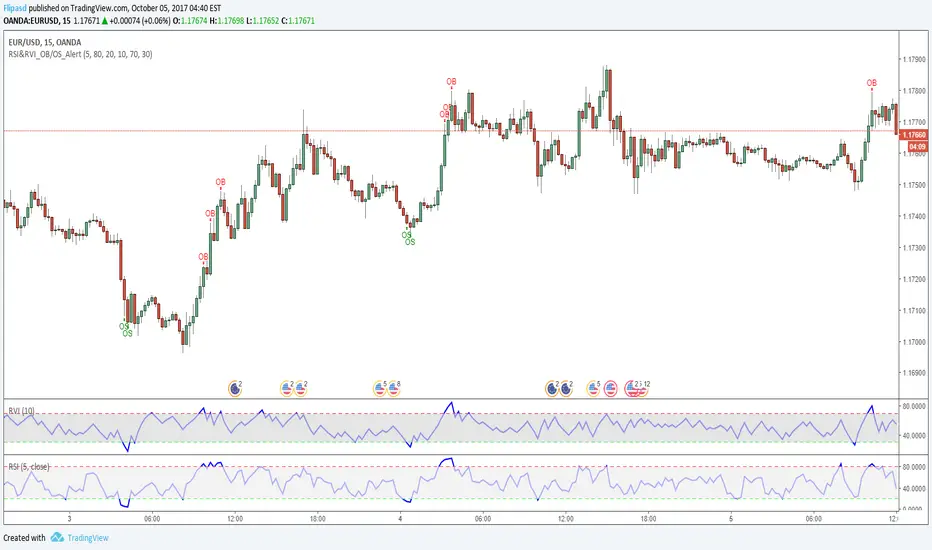
RSI & RVI OB/OS Alert ArrowThe script shows arrows on bars that are in overbought or oversold, based on the set parameters of Relative Strength Index ( RSI ) and Relative Volatility Index (RVI). Also there is a universal allert, which includes both conditions - overbought and oversold. You can change the period of RSI and RVI, as well as the upper and lower boundaries of these indicators.Indicateur Pine Script®par FlipasdMis à jour 22462
RSI DivergenceRSI DIVERGENCE is a difference between a fast and a slow RSI. Default values are 5 for the fast one and 14 for the slow one. You can use this indicator in 2 different ways: normal RSI : check double or triple top/bottom on a chart meanwhile RSI is descending/ascending (check the example on chart) signal line : when RSI Divergence cross zero line from bottom to top you get a buy signal (the line become green), vice versa when the RSI Divergence cross zero line in the opposite way you get a sell signal (the line become red) Indicateur Pine Script®par Shizaru124124 17 K
Grant's PSAR SignalOpen and close signals for long positions on XJO.Stratégie Pine Script®par GrantPeace77618
Stochastic Momentum Index (SMI)Stochastic Momentum Index (SMI) or Stoch MTM is used to find oversold and overbought zones. It also helps to figureout whether to enter short trade or long trade. Red Shade in the Top indicates that the stock is oversold and the Green shade in the bottom indicates overbought. Strategy: Enter Long once the Overbought Zone ended and there's a crossover below -35. Exit Long once the oversold zone is ended and there's a crossover. Enter Short once the oversold zone is ended and there's a crossover above 35. Exit Short once the Overbought Zone ended and there's a crossover. Backup: Always use with another indicator because there will be multiple up and down movement in one Trend.Indicateur Pine Script®par surjithctlyMis à jour 5151 6.4 K
Doji signalsYou can create an alert based on this signal :) Works on standard and Heikin-ashi candles You can also adjust the sensitivity (how big you want the body of the doji) :)Indicateur Pine Script®par some1o11313 1.7 K
Franklin barcolor ATRIndicator for trader.tfc3.ru strategy traders.Indicateur Pine Script®par hell0men55
MULTIPLE TIME-FRAME STRATEGY(TREND, MOMENTUM, ENTRY) Hey everyone, this is one strategy that I have found profitable over time. It is a multiple time frame strategy that utilizes 3 time-frames. Highest time-frame is the trend, medium time-frame is the momentum and short time-frame is the entry point. Long Term: - If closed candle is above entry then we are looking for longs, otherwise we are looking for shorts Medium Term: - If Stoch SmoothK is above or below SmoothK and the momentum matches long term trend then we look for entries. Short Term: - If a moving average crossover(long)/crossunder(short) occurs then place a trade in the direction of the trend. Close Trade: - Trade is closed when the Medium term SmoothK Crosses under/above SmoothD. You can mess with the settings to get the best Profit Factor / Percent Profit that matches your plan. Best of luck!Stratégie Pine Script®par tux44 1.6 K
Ichimoku PanOptic TM-V1Modified Ichimoku indicator with signals from PanOptic Method by User Ichimoku_Trader.Indicateur Pine Script®par BrainZZ647
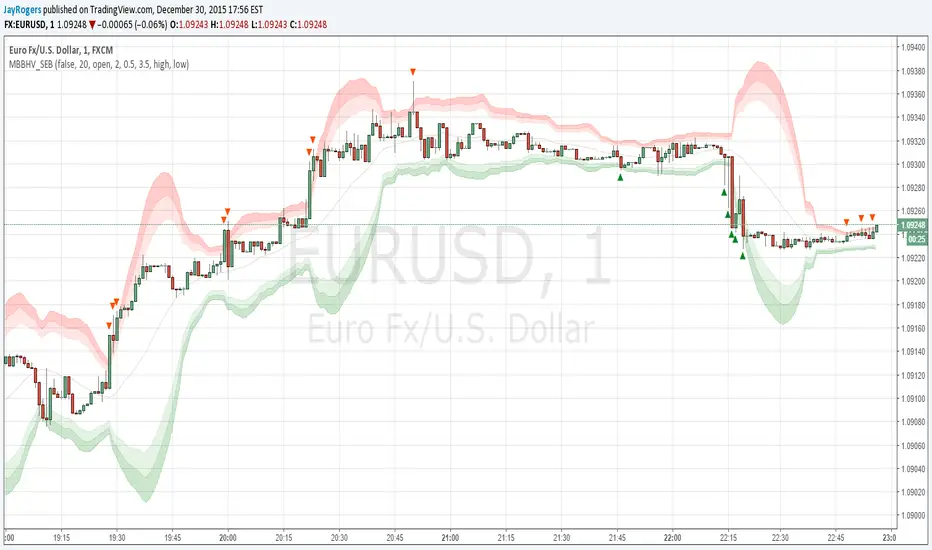
Multi BB Heat Vis - SMA/EMA/Breakout - r2I don't expect to iterate any further on this script, unless any weird issue crops up. Description and usage detailed in the comments at the top of the script. Cheers! To repaint or not to repaint, all the relevant sources are exposed as inputs for customisation - so the choice is yours. Cheers!Indicateur Pine Script®par JayRogers22607
[RS]Linear Regression Bands V2EXPERIMENTAL: added titles to inputs and plots for better understanding what is what(DCC) M = middle, T = top, B = bottom, S = signal.Indicateur Pine Script®par RicardoSantos11277
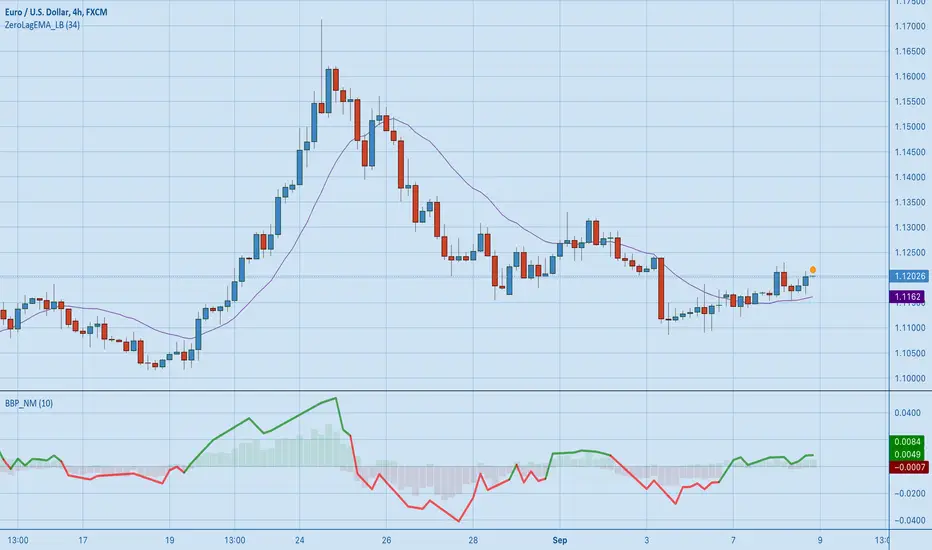
[RS][NM]Improved Linear Regression Bull and Bear Power v01The base code for this indicator was created by RicardoSantos What I added is a signal line that indicates when to buy and when to sell. Advised use : Combine with a zero-lag indicator like ZeroLagEMA_LB by LazyBear (suggested period = 34) Then use the following Rules of engagement : Current price > ZLEMA & Signal line of BBP_NM is green : BUY Current price < ZLEMA & Signal line of BBP_NM is red : SELL Please click the like button if you dig this indicator !Indicateur Pine Script®par Profit_Through_PatienceMis à jour 2828 2.9 K
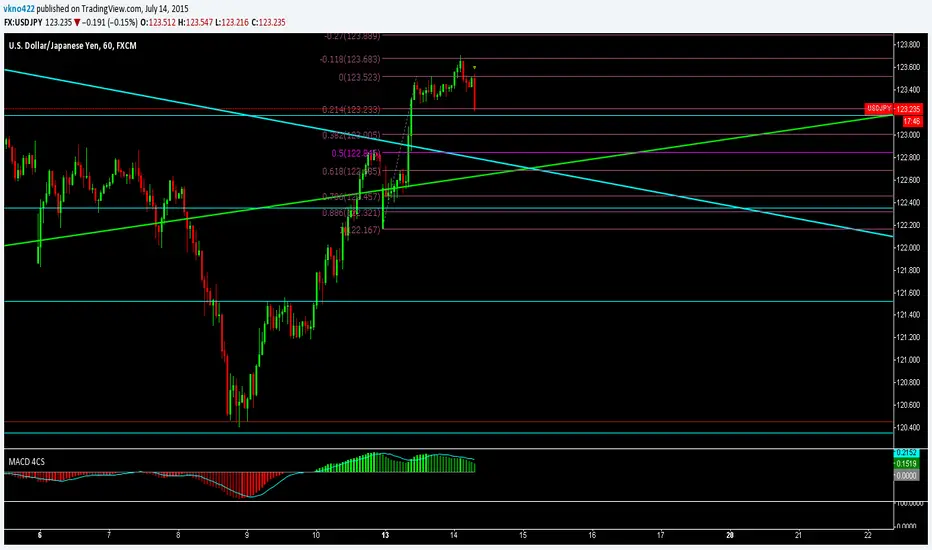
4 colour MACD with signal lineThis is the same as the MACD 4C but it also has the signal line. Indicateur Pine Script®par vkno4221010 1.1 K
TonyUX EMA Scalper - Buy / SellThis is a simple scalping strategy that works for all time frames... I have only tested it on FOREX It works by checking if the price is currently in an uptrend and if it crosses the 20 EMA. If it crosses the 20 EMA and its in and uptrend it will post a BUY SIGNAL. If it crosses the 20 EMA and its in and down it will post a SELL SIGNAL. The red line is the highest close of the previous 8 bars --- This is resistance The green line is the lowest close of the previous 8 bars -- This is support Indicateur Pine Script®par tux107107 18.9 K
[RS]JR Moving Average System V1.bupdate: changes to code, ma's now split over 3 sets fast, medium and slow, removed cloud and sl_lines(no use?), ma's visually display as shapes :p added option to toggle the ma's on/off.Indicateur Pine Script®par RicardoSantosMis à jour 66156
RN MACD SignalsThis is my simple way to quickly see MACD signals without having the MACD taking up space. The one at the bottom is for display to show how this works. A crossover occurs when the arrow flips over. The position of the arrow tells you if it is currently above or below the zero line. You can change the script to overlay and have it show up above or below price also. Let me know what you think.Indicateur Pine Script®par repo321313 1.6 K
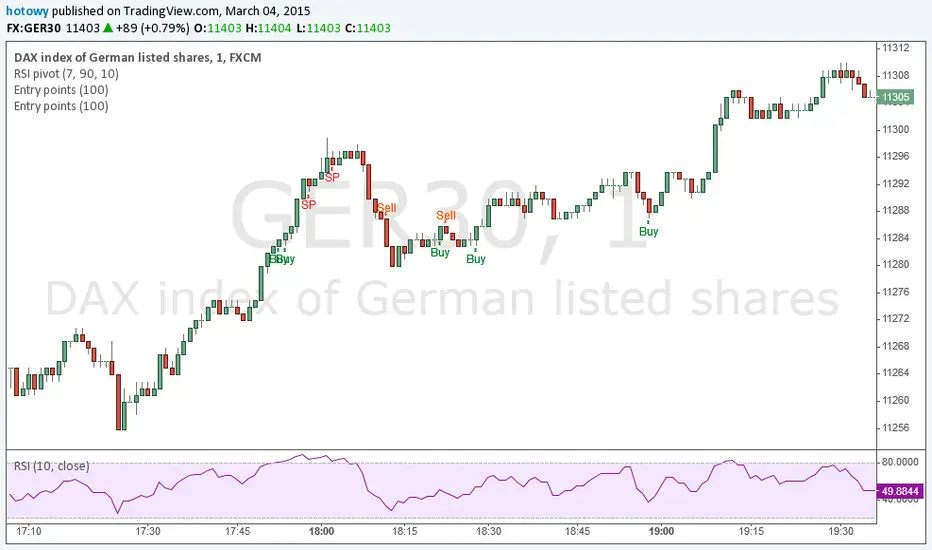
Entry pointsThis great and simple indicator based on EMA generates information about entry points at close of the candle. First signal is the best entry point but you can re-enter at the next. IMPORTANT: this script does not generate exit signals and those shoud be find using money management rules or else. Perfectly catches long runs in trends at all underlayings (forex, stocks, indexes, commodities) at all timeframes. Period=100 works best independently on timeframe but I encourage you to try other. Lower period gives more incorrect signals and shorter runs, higher period gives you late entry and less. Ofcourse it gives false signals from time to time but fortunately it makes a correction very fast. Try it! Good luck and good traiding!Indicateur Pine Script®par hotowy1212 4.7 K
Patrick's Buy HistogramSet up a trailing stop at about 0. Look for the red dots.and that's a good point to enter a long trade.Indicateur Pine Script®par patrickestarian95