OnePunch Algo Momentum Indicator V1This is another Plugin from One Punch Algo Team. We call it OnePunch Algo Momentum Indicator V1.
Basic Use:
One Punch Algo Momentum Indicator plugin is used for momentum stocks and high volatility crypto. It provide signals based on Simple Moving Average, Volume, Support & Resistance Lines.
SIGNALS/ALERTS
Buy Signal: Purple Color uptrend icon gives you a signal of an up-trending movement or we call it momentum movement. This signal basically happen when a stock land in a high volatility zone. We use in-build systems such as SMA, Support and Resistance and Trends to come up with the Buy Signal.
Sell Signal: Gray Color downtrend icon gives you a signal of a downtrend movement.
Other Lines Shown in the Diagram:
Red Line is the 200 Day Simple Moving Average (SMA)
Green Line is the 50 Day Simple Moving Average (SMA)
Strategy Tester
Always make sure to use the strategy tester to test how historically our Algo has performed in different time frames. One Punch Algo Momentum Indicator provide the ability to backtest based on certain time periods. This allows you to backtest our Algo vs some other Algo to find which performed well for the given time period, you if you want to see buy and hold performance better than the use of an Algo. This is a strong tool to use for your analysis of a stock or crypto.
What are the timeframes where it is most effective?
Different Stocks or Crypto perform differently with One Punch Algo Momentum Indicator. Please make sure to backtest a stock or crypto before you use the strategy.
Short Term/Day Trading Setup
For Short Term or Day Trade: 1min, 5min, 15min & 30min candlesticks works really well.
Also 3min, 5min, 7min and 15min works as well
Mid Term Trading Setup
For Mid-term traders: 30min, 1hr,2hr, and 4hr setup works really well.
For Long Term Trading Setup
For long term traders: 4hr, 1D, 1Week and 1Month Setup works well.
Best used with Heikin Ashi or Candlestick charts.
DISCLAIMER: Stocks and options trading involves substantial RISK of LOSS and is NOT suitable for every investor. The valuation of stocks and options may fluctuate, and, as a result, clients may lose more than their original investment. If the market moves against you, you may sustain a total loss greater than the amount you deposited into your account. You are responsible for all the risks and financial resources you use and for the chosen trading system. You should not engage in trading unless you fully understand the nature of the transactions you are entering into and the extent of your exposure to loss. If you do not fully understand these risks, you must seek independent advice from your financial advisor.
All trading strategies are used at your own risk. And OnePunch ALGO Developer, Youtuber or the channel does NOT take any responsibility for your losses using any of the advice or suggestions or strategies are shown/said in any of OnePunch ALGO Youtuber or the channel videos.
Signals
MACD Signal with RSI Indicating StrategyThis strategy looks for MACD signal crossover and RSI confirmation of oversold/overbought condition.
Tune to your crypto/stock for best results using the strategy and sent an alert. Currently set up to use 25% of equity at each buy signal and will sell 1/3 of position at each sell signal. Initial investment is $1000, but adjust as necessary.
Currently tuned to DOGEUSD on 30min chart.
If you like/use/profit, follow me or shoot me a donation. If you are looking for a script design, I can help.

Simple way to BEAT the market [STRATEGY]This script has been created to demonstrate the effectiveness of using market regime filters in your trading strategy, and how they can improve your returns and lower your drawdowns
This strategy adds a simple filter (A historical volatility percentile filter, an implementation of which can be found on my trading profile) to a traditional buy and hold strategy of the index SPY.
Note, There are other filters that could also be added including a long-term moving average/percentile rank filter/ADX filter etc, to improve the returns further.
The filter closes our long position during periods of volatility that exceed the 95th percentile (or in the top 5% of volatile days) and buys back when the volatility is below 95% rank of the past 100 days
Have included the backtest results since 1993 which is 28 years of data at the time of writing. Comparison of traditional buy and hold with this modified strategy can be found below:
Traditional buy and hold:
Return per year: 7.95 % (ex Dividends)
Total return: 851.1 %
Max drawdown: 50.79 %
'Modified' buy and hold (this script):
Return per year: 9.92 % (ex Dividends)
Total return: 1412.2 %
Max drawdown: 31.57 %
Feel free to use some of the market filters in my trading profile to improve and refine your strategies further, or make a copy and play around with the code yourself. This is just a simple example for demo purposes.

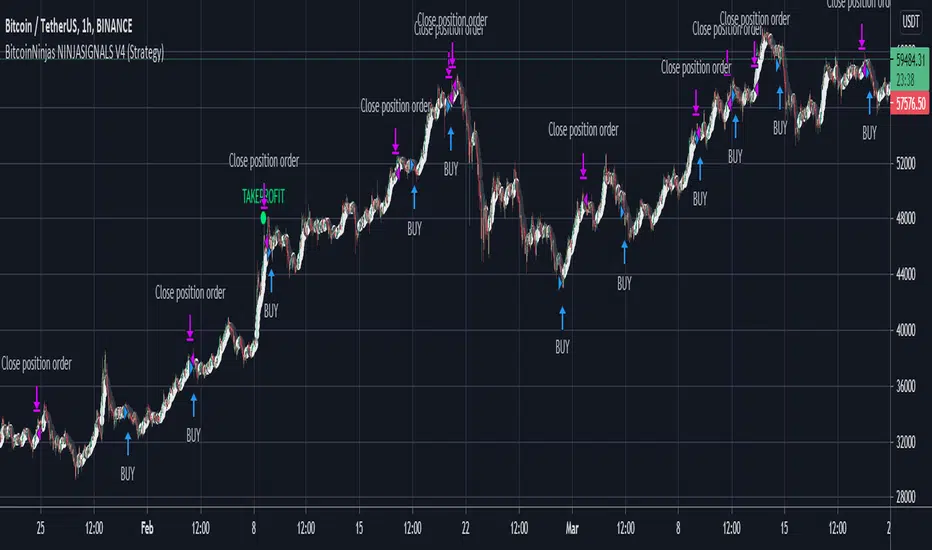
BitcoinNinjas NINJASIGNALS V4 (Strategy)BitcoinNinjas NINJASIGNALS V4 (Strategy)
(for Cryptocurrencies, Forex, GunBot, ProfitTrailer, Autoview, CryptoHopper, manual or automated trading, and more)
This is version 4 of our Ninja Signals trading script, with accompanying backtesting strategy.
BitcoinNinjas NINJASIGNALS V4 (Script)
•Allows users to easily set automated buy/long and sell/short alerts on TradingView for use with automatic and manual trading of cryptocurrencies, Forex securities, and more (alerts are compatible with automatic trading software such as GunBot, ProfitTrailer, Autoview, CryptoHopper, and more).
•Synthesizes many powerful indicators [e.g., Relative Strength Index (RSI), Stochastic RSI, Money Flow Index (MFI), Moving Average Convergence Divergence (MACD), etc.) into one powerful script to generate very precise buy and sell signals in virtually all market conditions.
•Features user-defined adjustable calibration settings, allowing traders to customize the script to fit any currency / security on any exchange available through TradingView.com, simply by adjusting settings.
•Buy/Long arrows, Sell/Short arrows, & EMA trendline can be customized or hidden, if desired.
•Complete with backtesting strategy version of script which allows users to test various trading strategies based on the alerts the script generates (see information and screenshots below).
•Backtesting strategy features a user-defined adjustable date range, so traders can estimate performance of the script over specific periods of time, such as the last week, month, or year.
•Script and backtesting strategy feature many user-adjustable settings including stop loss and take profit alerts, an ‘only sell for profit’ option (Gunbot-specific), many different buy and sell filters, and more. Simply adjust the script settings and the backtesting results will automatically refresh.
•Backtesting strategy allows for pyramid buying to test various average down / dollar cost average trading strategies. Simply adjust the number of pyramid buys and the quantity of each buy.
•Fully compatible with margin and futures trading for any currency / security on TradingView.com.
DISCLAIMER: By using our BitcoinNinjas ‘Ninja Signals’ planning script, you agree to the BitcoinNinjas 'Terms of Use'. No sharing, copying, reselling, modifying, or any other forms of use are authorized for our documents, script / strategy, and the information published with them. This informational planning script / strategy is strictly for individual use and educational purposes only. This is not financial or investment advice. Investments are always made at your own risk and are based on your personal judgement. BitcoinNinjas is not responsible for any losses you may incur. Please invest wisely.
trendOne [Strategy]BITSTAMP:BTCUSD
trendOne
(strategy-tester)
It is not recommended to use this script for generating alerts. Use "trendOne Alerts" instead.
This script combines all our previous trend-based scripts (Bows, Autopilot, Trend Indicator, Price Deviation, etc) in only one script .
To calculate the trend we use:
Volume Weight
Average True Range
Bows calculations
Trends smoothed with alma() function.
For more accuracy on the signals and to filter unwanted signals we layered slower time-frames in the background and added breaking support & resistance rules.
Inputs
Sensitivity
Integer input. Sets the sensitivity for signals generated up and down. Higher values will generate less signals on chart, and vice-versa.
Enjoy!
Disclaimer:
Back-tests do not guarantee performance on the future. Even if a trading setup is profitable in historical data, it could be unprofitable in the future.
To get access to this and other scripts check links below.

alGROWithm Premium - Strategy TesterThe alGROWithm Strategy Tester is a supplement to the original alGROWithm indicator.
Use this strategy to do your own back testing and find the best settings that work for your asset of choice.
█ WHY THIS IS IMPORTANT
Different assets require different settings for optimal results. This strategy script will allow you back test different settings for alGROWithm in order to analyze key metrics such as win rate and P/L. TradingView functionality also enables you to view a high level performance summary and even see every single individual trade made by the algo.
█ BEST PRACTICES
Depending on the asset you are testing, it is very important to update the settings as needed. For example, if you are back testing on US30, you will likely need to increase the starting capital. For other assets, you may also need to change the order size to use the Contracts option.
It is important to decide for yourself which back testing parameter you will weigh more heavily in terms of importance. For example, a day trader may want to use a setting that maximizes win rate rather than profit % since we are humans and not computers. Further, it is highly recommended to utilize all of the rich features that TradingView provides with regards to back testing. For example, using the List of Trades tab, go back to find a failed trade and analyze the trade to see if you actually would have taken it in the moment.
After finding the best sensitivity for your asset, it is important to set that sensitivity value on the non-strategy version of alGROWithm for usage. Changing settings on this version will not carry over to the non-strategy version.
█ DEFAULT SETTINGS
We have set the following default settings on the strategy:
Starting capital: $100k
Order size: 30% of equity
Sell 1/5 of position every Take Profit level

Quansium Series A BacktestThis comes with preconfigured setups or strategies. Simply choose one from our list based on the timeframe it was made for. Leverage can be changed; to keep trading safe, a maximum of 2 is allowed. In our findings, this was able to trade crypto (specifically BTC ), MES (Micro E-mini S&P 500 Index Futures ), and stocks. It is important to know that setups A, B, C, and D use variable position sizing, and dynamic stop loss/trailing stop/take profit, these parameters are provided through the alerts. The rest of the strategies were created with a simpler approach in mind, just plainly entry/exits signals.
Quansium as a framework:
Price reformat: we take the price source (Open, Close, High, Low) and remove any noise that affects the accuracy of our signals.
Time awareness: we take several time periods of the data on the chart such as start, end, and whole. We use this to add more depth to our signals.
Position size: our backtest tries to recreate as much as the real world trades as possible so our position is determined by the current equity. We also use the volatility of the market to increase or decrease our exposure or risk.
Risk awareness: stop loss, take profit, trailing stop are the risk exits we use to provide our users some peace of mind. These parameters are totally dynamic and follow the same behavior of the market.
Signals filtering: to make almost non-existent any errors and increase the quality of our trades, our indicators go through multiple phases, this avoid double entries or early exits, and help maintain a record of what has transpired and what’s currently taking place.
Indicators: whenever we can we use custom code or our own functions instead of the defaults ones provided. This gives us total control of what we’re trying to achieve. In many cases we tend to combine several indicators’ logic into one creating a more personalized take on it.
Easiness: since we started our main goal has been to provide the easiest and fastest way to alerts’ creation. It has taken us years to reach this level where now we already provide a list of preset strategies so the user doesn’t have to spend much time tinkering with scripts and more on other matters, because we know life is more than just trading.
Raw signals: we provide the option to turn off as much of our advanced features such as stop loss, take profit, trailing stop, dynamic sizing, etc, etc for a simple approach. Trade signals still go through the signals filtering method mentioned above,
Timeframe pairing: we take trading very seriously, by no way we’ll want the user to lose money (although such thing is expected because past results aren’t an indicative of futures ones), through years of experience we have found what are usually common mistakes the user makes, this feature allows us to only activate the strategy if the right timeframe is chosen.
Trend filters: through the years we have improved the arts of the trend. We like to keep things simple but yet powerful. We observe the macro and micro trend of the security. This helps confirm we are entering at the desirable timing. We also incorporate volume and volatility into decision making, we simply programmed it to trade when these are increasing and higher than the average values observed in both the short and long term. Finally we take into account the strength of the pair to make our final choice of whether to enter or wait, and if anything flashes contrary movement then we cancel the upcoming signal and stop monitoring until the next one comes along.
Full automated risk: stop loss, take profit, and trailing stops usually are set in percentages, and optimized even more using the current market behavior to become more adaptive. But always remains some sort of fixation, so the user must choose a value somewhere. This is where our framework shines the most, as previously mentioned before when we take time into our calculations, we use several periods to observe performance and get values that keep our risk exits natural and closest to the flow of the market itself.
Setups:
A: Centered oscillator with the difference of several moving averages with more sensitive settings. Momentum focused.
B: Centered oscillator using simple moving averages. Trend-Following focused.
C: Centered oscillator using smoothed data with the help of faster moving averages. Trend-Following focused.
D: Centered oscillator with the difference of several moving averages with less sensitive settings. Trend-Following focused.
E: Centered oscillator with the difference of moving averages where the standard deviation is applied first. It uses less sensitive settings. Trend-Following focused.
F: Finds the relationship between multiple readings of the price’s relative strength to better pin-point downs and ups. Trend-Following focused.
G: Centered oscillator with the difference of moving averages where the standard deviation is applied first. It uses more sensitive settings. Momentum focused.
H: Multiple centered oscillators using various moving averages. Trend-Following focused.
I: Centered oscillator using simple moving averages. Momentum focused.
Note: The framework is composed of almost 1000 lines of code as compared to each indicator that makes up the setup which is around 10. The power from Quansium doesn't come from the strategies themselves but rather the overall system that turns simple signals into complex and advanced trades.
Strategy Tester:
Initial Capital: chosen value is $20,000, as an approximate to Bitcoin’s ATH (All-Time High). In previous iterations we noticed some trades won’t go through if the capital was less than the ATH.
Order Size: 100% of equity (although the script controls this, and this is of no regards to the results).
Pyramiding: 1, system doesn’t place multiple entries in a row, only one at a time.
Commission: This simulates order execution with custom trading fees. Commissions are turned off by default because this script works in various markets and each operates differently. In order to reach results that are close to real world conditions, it is imperative the user fills this based upon their broker or exchange data.
When we started, we were focused on finding the best indicator, or creating it ourselves. After years we came to realize that the secret is not in which indicator you use but the framework behind it. All strategies have bad, good, best, worst performance periods. The key of a good system is to help keep you safe when it’s down and maximize your potential when it’s up. We hope this material at the very minimum inspires you to keep going and not lose faith, because it is not the smartest who win but those who persevere.

GreenCrypto Strategy
This strategy majorly uses MA, Tilson and S&R. MA is used for predicting the trend, Instead of normal cross-over of the MA, we are calculating the trend of the MA itself (whether MA is moving upward or downward by comparing the previous and current value of MA), along with MA we also use Tilson to calculate the MA.
Once we have MA and Tilson we take average and merge both MA and Tilson MA to get a double confirmation on the trend of the market. for entry and exit we use S&R with the merged MA, if the trend change is at the support or resistance level we go for LONG/SHORT respectively. Here we are doing continuous LONG+SHORT position, this provides more opportunity to capture unexpected market trend.
Enter a Long Trade when the script shows "Long" and exit either when you get "Short" signal or when it meets your target.
Parameters:
"Use 1:EST, 2:SST, 3:HST ?" : Select EMA , SMA or HullMA (works best on HullMA)
Length: Length of the EMA / SMA /HullmA
Factor: Used for calculation of Tilson and the Support and resistance .
Date/month/day : for selecting the right backtesting the period (currently it set to Jan 2018 to current day )
for this backtesting i have used 1000$ capital and 0.02% commission for each trade.
This strategy works best on 4H time fram but you can also use it on 1 day or higher timeframe charts
The default config present in this script is designed for ETH but it will also work with other coins)
Config for Specific Crypto coins (Please feel free to try out other configs also) :
ADA, BNB, EOS : "Use 1:EST, 2:SST, 3:HST ?" = 3
"Length" = 8
"Factor" = 0.9
ETC, XLM : "Use 1:EST, 2:SST, 3:HST ?" = 3
"Length" = 8
"Factor" = 0.85
Please DM me if you would like to tryout 7 Days free trail.

ELLIPSE: Bidirectional Swing Trading Strategy (Strategy Version)The eternal question that has occupied humanity since its early existence is what is the meaning of life and why am I here? On a daily basis this quest for meaning is distilled into a somewhat simpler question: What is the reason for getting up every morning?
For many of us, these thoughts arise even more as autumn arrives and it gets dark, bleak and cold outside. I guess it is easier to forget about the meaning of your life, while swimming on a sandy beach, enjoying a cocktail. Than you are living you life and you don’t need to rationalize it. Everything makes perfect sense!
In winter however, you need to get more “creative”. I, for example, would always try to change my perspective of things by doing something that makes my heart beat faster, like drinking a bottle of Heineken on a Friday evening or having endless conversations with my mates about stupid things, or kicking a ball against BALLONTHEROOF 7 on a Saturday morning. During the week, I would take out my frustrations on the fitness equipment at the local gym.
But what if all of this is canceled by CORONA? All that’s left is to work for the boss and run your 10km lap twice a week. The question is, what do you do now, with this huge amount of ”free” time than any old person would give anything for. When you are young time is never ending, when you are older it is never enough. Time has reached a different dimension in these days.
However, you can still do 2 things. You can slowly let the walls come to you and give up or you can actually do something useful with your time and find something that you are good at.
For us this choice was easy. After the success of our positioning trading strategy the MATRIX, at the time of the corona lockdown, we started making a swing trading strategy for the 4H timeframe, called ELLIPSE. We have included all feedback and any improvements we received about the positioning strategy and integrated it into the 4H script.
The main requirements of the script that we had set ourselves were:
Bidirectional
Low max drawdown
High profit factor
Works on all main crypto coins
By fully focusing ourselves on the script over the past few months, I can’t help but (unhumbly) say that we have not only succeeded in our mission, but that we have absolutely surpassed ourselves!
The only bright spot in this heavy corona time is, if a drug becomes available, there is extra money in the bank!
***The script is invite-only, message us to get script access***
-------------------------------------------------------------------------------------------------
User Guidelines:
The trading strategy was designed and optimized for trading cryptocurrencies only; furthermore it works best on established cryptocurrencies that have a clear historical trend such as:
BTCUSD
ETHUSD
LTCUSD
XRPUSD
ADAUSD
The trading strategy is based on swing trading methodology. The script must therefore be used on 4h candles only .
Use USD trading pairs only (e.g. use ETHUSD instead of the ETHBTC) since the individual trend is captured more effectively and therefore gives better results.
The trading strategy is bidirectional , both long and short entries are generated.
-------------------------------------------------------------------------------------------------
Indicators used in this strategy:
Ichimoku Cloud ; acts as the leading indicator.
Volume ; without strong volume , a market move is not valid.
MACD and Vortex ; both being used as confirmation indicators.
Choppiness index ; avoids trading in choppy markets.
Simple and Exponential Moving Averages ; prevents trading against the trend.
The trading strategy is easy to use, bidirectional, trend based and without repainting, meaning once a signal has been made it is permanent and that no future data is used in the decision making. It detects the trend and filters out market noise based on more than 10 technical indicators. ONLY when all indicators align with each other the algorithm prints a LONG or SHORT signal. The trading strategy provides high probability trading signals and minimizes risk! This script aims to capture the profit from short to medium trending moves and by doing so filters out non-substantial trends and avoids the associated risks with these trades.
-------------------------------------------------------------------------------------------------
Features:
NO Repaint once candle is closed.
Stop loss feature ; set your own stop loss to manage your risks.
Customizable Display for the Ichimoku cloud indicator display.
Bidirectional ; both long and short trading positions can be enabled.
Full backtest feature ; Easily generate your own backtest results for each asset (Strategy Version Script).
Alerts ; Get notified via email / pop-up / sms / app once a signal is given! (Alert Version Script).
-------------------------------------------------------------------------------------------------
Backtest results
Below are the back test results. Only well established cryptocurrencies are displayed with a clear historical trend:
Long and short trading positions,
Signal to signal trading (no multiple orders),
Initial Capital: 10 000 USD,
Order size: 10% of equity per trade,
commission fee 0.1%, period: start of chart,
Exchange-----Asset------Timeframe---Percent Profitable----Profit Factor---Total Trades----Max Drawdown----------Net Profit------
Bínance------BTCUSDT------4H-----------------54.4---------------5.32-----------------57----------------1.58%------------40.34%-(4034 USD)
Bínance------ETHUSD-------4H-----------------50.9---------------5.01---------------- 57----------------2.96%------------54.93%-(5493 USD)
Bínance------LTCUSD--------4H-----------------61.0---------------5.08-----------------59----------------2.09%------------57.06%-(5706 USD)
Bínance------XRPUSD-------4H-----------------43.13--------------3.52-----------------51----------------2.42%------------43.13%-(4313 USD)
Bínance------ADAUSD-------4H-----------------57.5---------------3.36-----------------47----------------3.46%------------40.82%-(4082 USD)
-------------------------------------------------------------------------------------------------
Reminder: Use this trading strategy at your own risk and trade responsibly. We are not responsible for any financial loss using this strategy.
***The script is invite-only, message us to get script access***

Super Guppy StrategyCM Super Guppy with Long/Short signals, backtesting, and additional options. Updated for PineScript v4.
COINBASE:BTCUSD
Features 2 primary modes, depending on your risk profile. These options are available in the settings:
"Early Signals" ON (default):
Prints a "long" on grey to green transitions AND red to gray transitions.
Prints a "short" on green to grey transitions AND gray to red transitions.
Will not print back-to-back repeated positions (i.e. green → grey → red will only print the first green → gray "short" signal and not print "short" twice).
Rotates long and short positions with no delay.
"Early Signals" OFF
Will close trades, but never open new ones, when guppy transitions to from any color to gray.
Open long: guppy transitions gray to green.
Close long: guppy transitions green to gray.
Open short: guppy transitions gray to red.
Close short: guppy transitions red to gray.
Does not rotate long and short positions back to back.
Additionally:
Can toggle on/off the 200EMA. Default is off.
Can toggle on/off short positions. Default is on.
In development: alerts

Market Surfers Signalshello guys its siple and easy indicator provide buy and sale signals but there are some rules to be followed are as below;
Plot below indicators;
1. EMA 50 Days
2. Vwap
Once there is indication of buy and price is above EMA 50 &VWAP can long from the next candle open SL will be the signal candle bottom or last swing low in 5 mint candle wise versa for SHORT /Sale.
I am improving it more and will improve further.
Enjoy.
From : Market Surfers (ASIF HUSSAIN)

SIDD-Master-Moving-AverageSIDD-Master-Moving-Average is based on RSI average calculation Moving average plotted on chart.
This Moving Average is giving 2 signals Bullish and Bearish .
Whenever Bullish signals is coming price is doing crossover with moving average on upside and this indicate price will go up from current market price.
Whenever Bearish signals is coming price is doing cross-under with moving average on downside and this indicate price will go down from current market price.
Moving average color is changing based on upside movement or downside movement , for upside its green and for downside its orange color.
This indicator i have created with stop loss line means any price close below cross line for bullish position then that trade should be closed and take the stop loss. similarly for Bearish trade and candle close above stop loss line means trade should be closed and take the stop loss.
Stop loss i have taken care with ATR and Super trend you can see the settings.
I have defined setting for general use of indicator if any modification on setting then result may vary.
Its multi time frame moving average. And I have given time frame for indicator as well so if any trending move need to capture then that setting need to be increased with respect to chart time frame else keep it same.
I have added commission and slippages as well in indicator.
Ping me or DM me to subscribe this indicator.
I have given all my indicator details below link (Signature URL). You can check indicators and call me on given number or email me on given email to access the scripts and indicators. Telegram link is also given you can ping me there.
--------------------------------------------------------------------------------------------------------------------------------------
Disclaimer : Past performance of the indicator is not giving guarantee for future performance as well, it may change as per market condition.
-------------------------------------------------------------------------------------------------------------------------------------

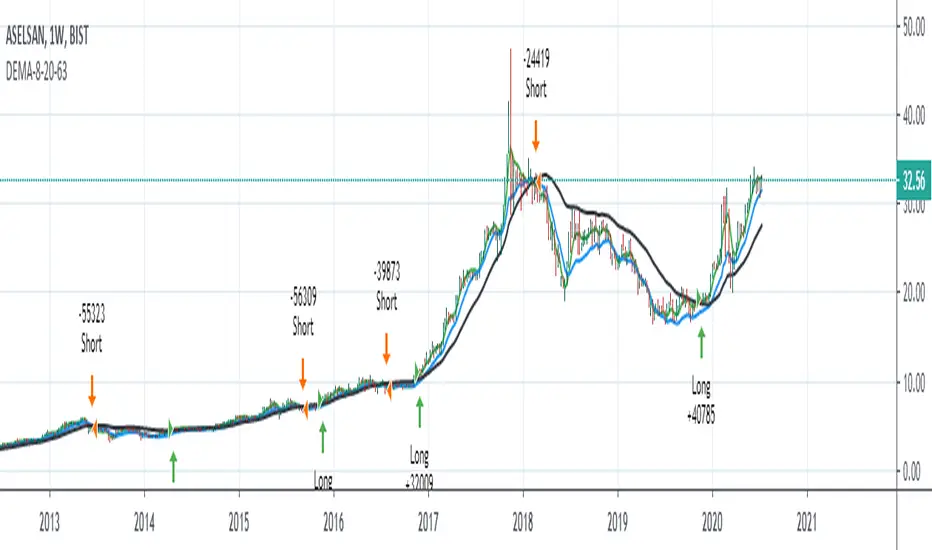
Double Exponential Moving Average 8-20-63 StrategyHello, this script was made upon the request of aliergin63, one of my followers.
I do not know exactly from whom it is quoted. (It may be author HighProfit.)
Long position when 8 dema is over 20 dema and 63 dema,
it opens a short position for the vice versa.
Alarms have been added.
%0.1 comission added.
Regards.
Note : DEMA = Double Exponential Moving Average
Custom Screener with Alerts [QuantNomad]Some time ago I published an example of simple custom screener in PineScript:
The only thing this screener did is created a dynamic label with screener output.
Recently TradingView announced alerts from the strategy with the possibility to add custom messages to alerts.
So using it I was able to create a bit more advanced screener which sends results as alert messages. With tools like Alertatron, you can easily redirect them to Telegram if you want.
It works for 40 symbols (limitation of the number of security calls).
To create your own screener you need to change only screenerFunc. The logic of this function is very simple, it outputs value you want to display in screener and condition based on which your screener should filter your stocks.
To create alerts for this screener create an alert from strategy and use {{strategy.order.alert_message}} as alert message.
Do you know now how to make this screener better? Let me know.
Disclaimer
Please remember that past performance may not be indicative of future results.
Due to various factors, including changing market conditions, the strategy may no longer perform as good as in historical backtesting.
This post and the script don’t provide any financial advice.

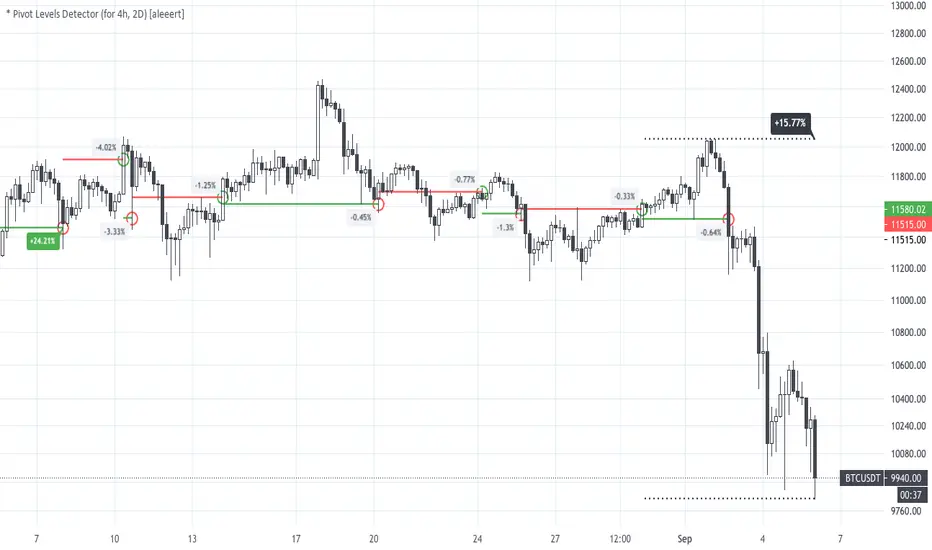
* Pivot Levels Detector (for H4, D2) [aleeert]Pivot Levels Detector is the script based on idea about breakouts of pivot levels which based on certain numbers of bars used for reaching the target and breakout the level. Working timeframes are H4 and 2D . The script works better with BTCUSD, ETHUSD, EOSBTC, AAPL, TSLA.
No repainting!
The script doesn't use any moving averages or other relative methods which cancel or change data on previous bars. Once the signal is showed it will stay forever.
NOTE: The results from Strategy Tester could slight vary from results you see on the chart. It's because of calculation method used on Strategy Tester, which uses a data from closed bars only, not by target reaching. So the results you see on the chart are more correct.
Follow me for receiving more scripts and indicators.
Regards,
aleeert
Relativity BEARS FOREX 50X 4H AlgorithmHello, this script is the correction of my old script related to Forex. (Bear market)
Old script :
4H was chosen as the time frame.
Thus, larger pips are at our disposal and we benefit more from the hedge effect of the leverage.
Commissions per trade have been removed to get more realistic commissions.
Because every wrong trade deletes all the 1% position size.
(with leverage effect)
Use the links below to obtain access to this indicator :

Relativity BULLS FOREX 50X 4H Algorithm
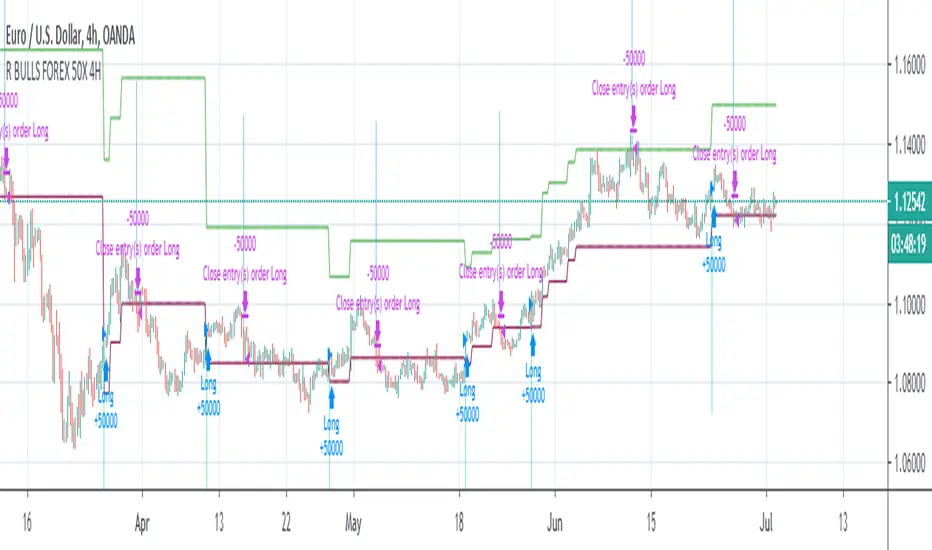
Hello, this script is the correction of my bull script related to Forex. (Bull market)
Old script :
4H was chosen as the time frame.
Thus, larger pips are at our disposal and we benefit more from the hedge effect of the leverage.
Commissions per trade have been removed to get more realistic commissions.
Because every wrong trade deletes all the 1% position size.
(with leverage effect)
Use the link below to obtain access to this indicator :
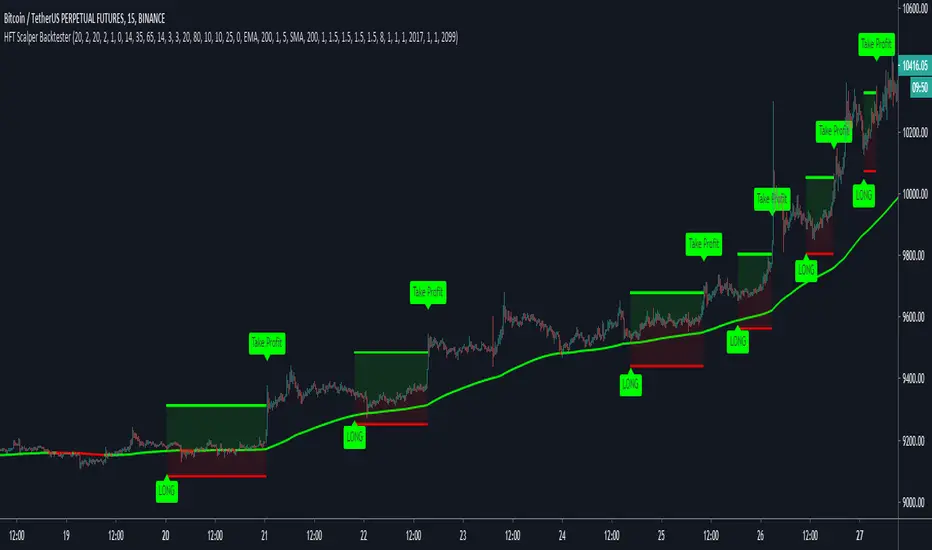
HFT Scalper BacktesterThis strategy is a scalper strategy developed by HFT Research. Scalper is highly customizable and provides endless opportunities to find profitable setups in the market.
Use Bollinger Bands
This piece of the settings will turn and off Bollinger band’s input in the decision making. BB Length will determine the Moving average you are using to take the standard deviation off of which is named as BB Multiplier. Default settings will use 20 moving average and take standard deviation of 2 to create lower and upper bands. Increasing the Multiplier will give you fewer but safer entries.
Use Bollinger Bands %
This setting will allow the user to determine at what Bollinger band width %, he wants to take start looking to take trades. It is known that when prices are stable and moving sideways, Bollinger bands contract and it becomes more reactive to small moves in the market. Using this setting, you can ignore the signals that would be generated while Bollinger bands are contracted. This setting will allow the user to weed out the noise in the market and really allow them to make the most out of Bollinger bands .
Use RSI
You can also turn on and off the RSI as well. Alternatively, there is an option to use RSI on a different time frame than you are currently on. For example, if you are looking at the 5min chart to use Bollinger bands but you would like to look at the RSI value on the 15min chart. You can do so by selecting the custom RSI timeframe as well as adjusting the Oversold and Overbought value.
Use STOCH
For those who want extra protection on their entry can throw STOCH into their decision making. STOCH acts like RSI but it is more prone to small moves. It will help the users to get a better entry if used correctly. Stoch may not be in the buy zone when RSI is at say 35, however, if price dips a little more and STOCH might be in the buy zone when RSI is at say 20. This way it will help you have better entries than just using RSI . In a way, you can use STOCH to scalp RSI .
Use VWAP
VWAP stands for volume weighted average price . It is an extremely useful indicator when trading intra-day. It does reset every trading session which is at 00:00 UTC . Instead of looking at x number of candles and providing an average price, it will take into consideration volume that’s traded at a certain price and weigh it accordingly.
Use ADX
ADX stands for average directional index . It is an indicator that measures volatility in the market. Unfortunately, the worst market condition for this strategy is sideways market. ADX becomes a useful tool since it can detect trend. If the volatility is low and there is no real price movement, ADX will pick that up and will not let you get in trades during a sideways market. It will allow you to enter trades only when the market is trending.
Use MA Filters
Lookback: It is an option to look back x number of candles to validate the price crossing. If the market is choppy and the price keeps crossing up and down the moving average you have chosen, it will generate a lot of “noisy” signals. This option allows you to confirm the cross by selecting how many candles the price needs to stay above or below the moving average. Setting it 0 will turn it off.
MA Filter Type: There is a selection of moving averages that is available on TradingView currently. You can choose from 14 different moving average types to detect the trend as accurate as possible.
Filter Length: You can select the length of your moving average. Most commonly used length being 50,100 and 200.
Filter Type: This is our propriety smoothing method in order to make the moving averages lag less and influence the way they are calculated slightly. Type 1 being the normal calculation and type 2 being the secret sauce .
Reverse MA Filter: This option allows you to use the moving average in reverse. For example, the strategy will go long when the price is above the moving average. However, if you use the reserve MA Filter, you will go short when the price is above the moving average. This method works best in sideways market where price usually retraces back to the moving average. So in an anticipation of price reverting back to the moving average, it is a useful piece of option to use during sideway markets which is the worst market condition for scalper.
Please visit our website for more information
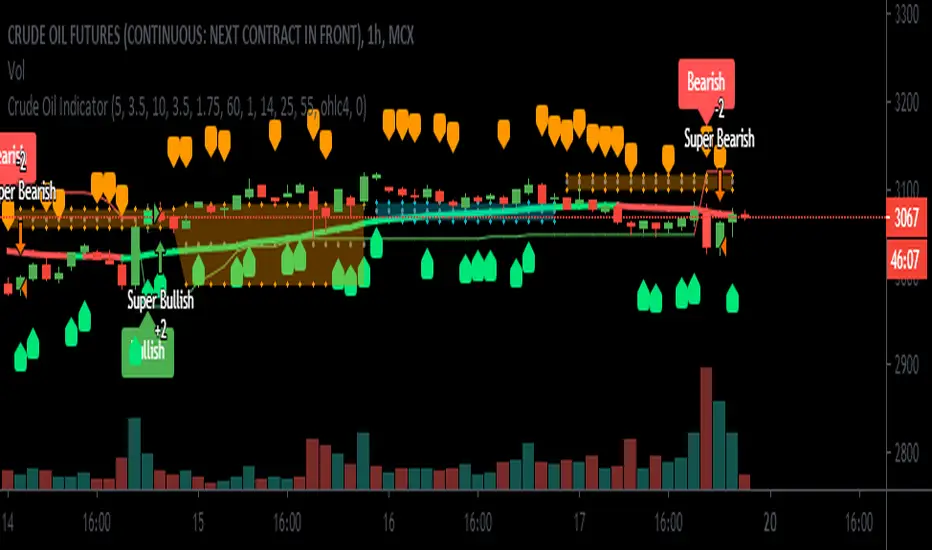
Crude Oil Indicator [SIDD]Crude Oil Indicator is giving two signal Bullish and Bearish . Bullish signal is used to take long trade and Bearish signal is used to close existing long trade and take new short trade and so on.
To get More signal of Bullish and Bearish user must enable More Signals check box that will check crossover and cross down of price close with Gaps.
I am using 2 ATR and one ADX and Gaps and VWMA to make signal profitable with 15 minutes 1 hr ,2hr,3hr,4hr chart time frame.
I have checked last few years data for back testing. Based on past performance it doesn't work well in 30 minute and 1 day chart time frame as results are not good in back testing. I have designed this indicator for Indian crude oil context though it can be used with other market as well.
1st ATR used to find trend with price crossover.
2nd ATR ADX is used to find the trend change details only. I have taken VWMA and ATR both to consider trend change.
Highlight Gap Up and Gap Down is used to know daily market opening gap up and gap down area. Gaps act as support and resistance .
VWMA Plotted as Blue line. Rising VWMA considered as uptrend and falling VWMA considered as downtrend.
Flat VWMA considered as no trend zone. In no trend zone every second third candles cross VWMA .
User must keep the default setting for getting better results as results are back tested. If setting changed then result may vary.
I have added here back tested performance user can see those results. I have added commission and slippage as well. Past year performance not guarantee for future years result so before taking any trade trader must take conscious decision.
This indicator is available on Subscription.
PM/ DM for more information about the script access.
Use the link below to obtain access to this indicator.
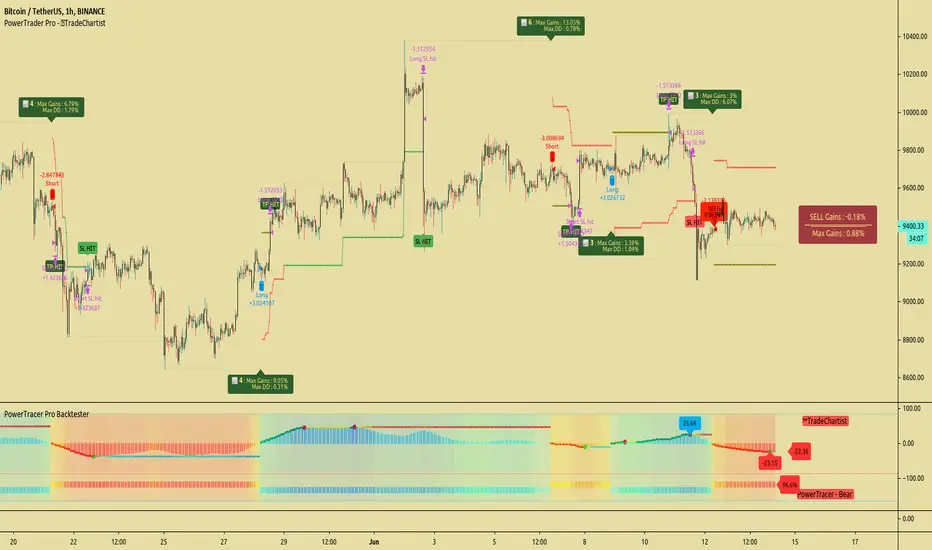
TradeChartist PowerTracer Pro Backtester™TradeChartist PowerTracer Pro Backtester is the strategy script for backtesting ™TradeChartist PowerTracer Pro for best performance settings which can then be used with ™TradeChartist PowerTrader Pro to plot Trades emulating the backtester and use Alerts (once per bar) on real time price chart.
PowerTracer Backtester includes the following options in the settings.
PowerTracer setting - Power Plot Type - (PowerTracer, Bar-wise Power Holder)
PowerTracer setting - Timeframe Multiplier
PowerTracer setting - Smoothing Factor
Backtester setting - Trade Direction - (Both Longs and Shorts, Only Longs, Only Shorts)
Backtester setting - SL Type (Fixed Stop Loss, Trailing Stop Loss)
Backtester setting - Reference for Trailing SL (Close, High/Low)
Backtester setting - Stop Loss %
Backtester setting - Take Profit %
Backtester setting - Quantity to trade at TP %
Using combinations of the settings, the user can find optimal settings for the asset to deliver lucrative entry and exit signals with high ROI and minimal Drawdown which can then be used on PowerTracer Pro and PowerTrader Pro to plot signals and create alerts to start trading in real-time.
Example charts:
GBP-USD 1hr chart - (2,1,Trailing SL, close, 1,1,25)
BTC-USDT 15m chart - (4,5, Trailing SL, high/low, 3.9,1.2,15)
SPX 1hr chart - (1,3, Trailing SL, high/low, 3, 2, 50)
This backtester needs the following scripts to generate signals and plots on main price chart and for real-time alerts
™TradeChartist PowerTracer Pro
™TradeChartist PowerTrader Pro
===================================================================================================================
This is not a free to use indicator. Get in touch with me (PM me directly if you would like trial access to test the indicator)
Premium Scripts - Trial access and Information
Trial access offered on all Premium scripts.
PM me directly to request trial access to the scripts or for more information.
===================================================================================================================
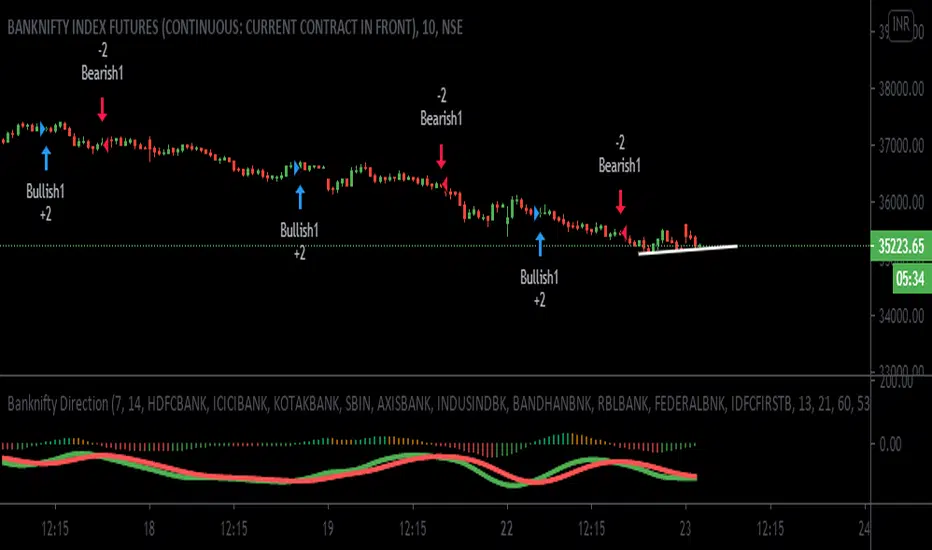
Banknifty-Direction-Bank-StocksBanknifty Direction Bank Stocks is indicator to give Banknifty future direction.
This Indicator is giving signal by taking 11 Major Indian Bank trend into consideration.
This indicator is giving two signal Bullish and Bearish .
Bullish signal can be used for long Banknifty and Bearish signal can be used to close existing Banknifty position and make new short side position and again when Bullish signal come then close existing short position and take new long position and so on.
There is zone area green zone and red zone and central line. Green zone is Bullish area and Red zone is Bearish area.
When ever green line cross over red line then Bullish signal generated and when ever green line cross under red line Bearish Signal generated.
Strong Bullish when Crossover is happening above central line and Strong Bearish when Cross under is happening below central line.
Many Thanks to LazyBear main author, I have used his wave trend function and modified that as per Banknifty index so that we can get better result.
User must keep the default setting for getting better results as results are back tested. If setting changed then result may vary.
I have added here back tested performance user can see those results. I have added commission and slippage as well.
This indicator is available on Subscription.
PM/DM for more information about the script access.
Use the link below to obtain access to this indicator
Trend Following IndicatorTrend Following Indicator is for following trend and being in trend till trend is not changed.
Each Bullish and Bearish signal you can add one more future or option lot and be in trade till bearish signal is not coming.
You can close Long trade i.e. Bullish pyramiding trade when you see there is small red arrows are there
and similarly when you are in Short trade you can pyramid with each Bearish signal and you can close the trade when small green arrow start coming.
Pros: This signal system is working in stocks and Index and Commodity and Currency.
Cons: Choppy market results are not good on that time you have to believe on small arrows for signals.
This signal is available on subscription. contact me or ping me for more details.

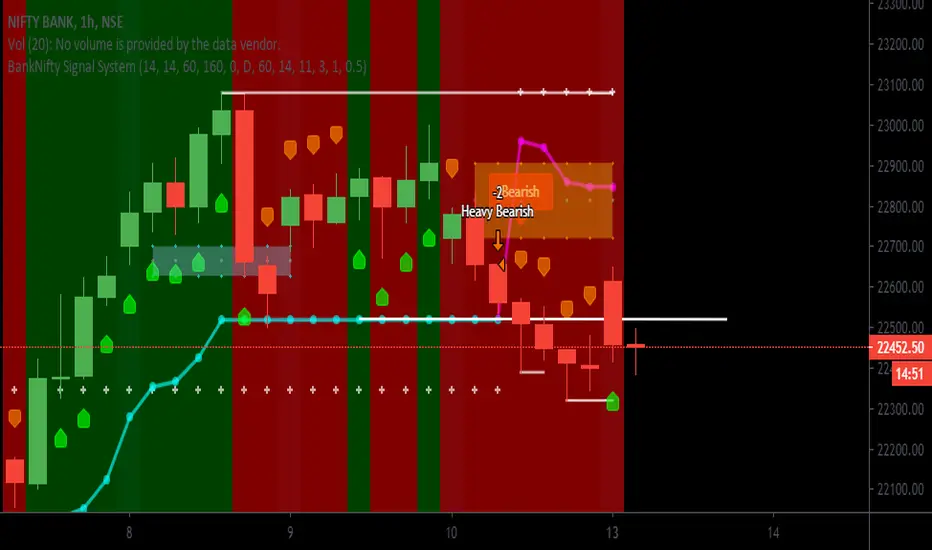
BANKNIFTY Signal SystemThis tool is made for BANKNIFTY Index of India. This system paints background for evident and clear signals based on technical analysis.