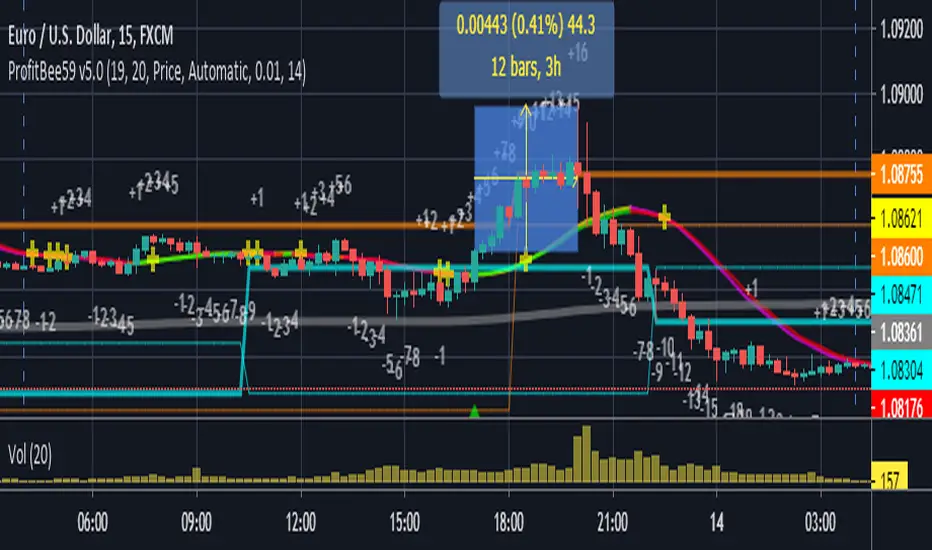
ProfitBee59 v5.0ProfitBee59 v5.0 for TradingView (pb5 ai) helps you do tedious works on your technical charts. It does CC59 counting and prints out positive or negative number on each price bar. When the counting arrives at -9 or +9, it creates respectable support and resistance ( SNR ) levels on the chart. It draws a pair of fast/slow average lines with pink/red colors for corresponding downtrend and yellow/green for uptrend. A yellow cross sign shows a crossing point between these fast/slow average line. It also draws a mega average line in gray to give a mega trend picture. Pb5 ai provides time/price analyseses. Up/Dn arrows are printed out at high probability buy/sell regions. In addition, other auxiliary tools such as Max/Min finder used to find the candlesticks with local max/min prices or Gap finder used to locate discontinuity between candlesticks.
For Forex trading, other intraday parameters are also available including the day opening level, high/low of yesterday and intraday brown background marking time interval for key trading hours in Asian-London-New York markets.
Smart phone/tablet and PC notifications of events occurring in the chart can be sent to you by server-side alerts so that you don't have to stay in front of the screen all the time.
=================================================================
The script ProfitBee59 v5.0 for TradingView (pb5 ai) is locked and protected. Contact the author for your access.
=================================================================
How to install the script:
------------------------------
*Go to the bottom of this page and click on "Add to Favorite Scripts".
*Remove older version of the script by clicking on the "X" button behind the indicator line at the top left corner of the chart window.
*Open a new chart at and click on the "Indicators" tab.
*Click on the "Favorites" tab and choose "ProfitBee59 v5.0".
*Right click anywhere on the graph, choose "Color Theme", the select "Dark".
*Right click anywhere on the graph, choose "Settings".
*In "Symbol" tab, set "Precision" to 1/100 for stock price or 1/100000 for Forex and set "Time Zone" to your local time.
*In "Scales" tab, check "Indicator Last Value Label".
*In "Events" tab, check "Show Dividends on Chart", "Show Splits on Chart" and "Show Earnings on Chart".
*At the bottom of settings window, click on "Template", "Save As...", then name this theme of graph setting for future call up such as "My chart setting".
*Click OK.
SNR
Intraday Support and ResistanceDisplay daily preferred trading and display support and resistance (modified) which is calculate using daily pivots

Signal To Noise Ratio IndicatorThis is a trend indicator at its core so combine with rsi or a moving average of your choice to see which direction the stock is trending in.
Only enter a position (long or short) when signal to noise ratio is above the signal line
This is one of my first indicators posted on here so be sure to leave me feedback

Signal to Noise Ratio [SNR]Intro
This script measures the Signal to Noise ratio of a security and plots it in deciBels scale!
Usage
Ideally, you would want the ratio to be above 10 dB, meaning the Signal strength is 10x the noise strength.
As a baseline, you should not rely on indicators that use any kind of moving average if the SNR is below 6 dB - meaning Signal strength is only 4x noise strength.
I've written the SNR as a functional block so you may simply copy and paste, then call getSNR() to get the ratio in dB.
Principle
I consider a bar's High and Low to be the range of that period and (High + Low)/2 to be the "real" value of the signal.
This script compares a bars range (noise) to the perceived signal using a Hilbert Transform.
Cheers,
DasanC

Support & Resistance FilterVisualize support and resistance levels with a high level of user control. Tired of meaningless, tightly clustered, support and resistance lines (shouldn't those just be considered bounces)? Just filter them out with the Bounce Filter. Want to visualize S&R in a crisp, clear new way? Use "Areas of S&R". Want to have a ridiculous amount of control over what counts for support and resistance in the first place? Use the Swing Filter (built-in). Perhaps most interesting... ...want to see support and resistance for (say) Bitfinex-BTC/USD on a Coinbase chart to see how they affect Coinbase candles? Then check out the advanced settings and have fun ;)
Support & Resistance levels are determined by historic pivots (swings). If a price breaks through the first resistance level, it may really take off. If it breaks through the second level, or through all five resistance levels, you might be on your way to the moon (Lambos not included). The inverse is true when the price breaks-down, through support levels.
5 Levels of Support and 5 levels of Resistance are available.
In a very bullish or bearish situation, searching back in time for the next highest Support or Resistance level can become quite demanding on TradingView's server. I've pushed it to the limit:
R2 & S2 look back 1,000 candles
R3 & S3 look back 2,250 candles
R4 & S4 look back 3,500 candles
R5 & S5 look back 4,999 candles
When TradingView's servers are getting a little bogged down, you may get an error about "a loop being longer than 100ms". That just comes with the territory of searching so many candles back. To resolve it, just click "Force Reload" in the settings.
I'd love to post the manual, the instructions for the settings, here in the description, but the publishing policy sets a limit as to how long these descriptions can be. So check the comments for a manual on how to use this indicator. And if you'd like to plug this kind of indicator into your scripts, just contact me for custom work.
~jdhadwin
