Indicateur Pine Script®
Oscillateur Stochastique
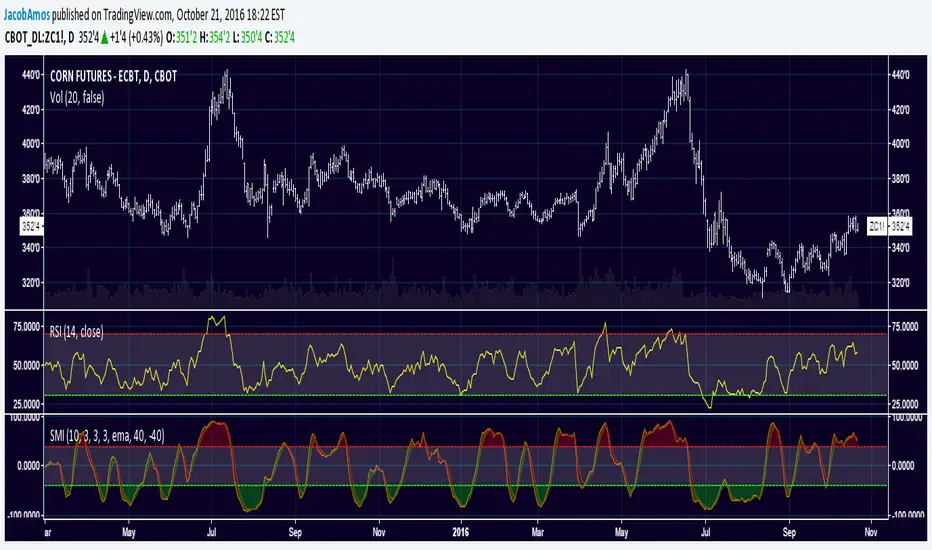
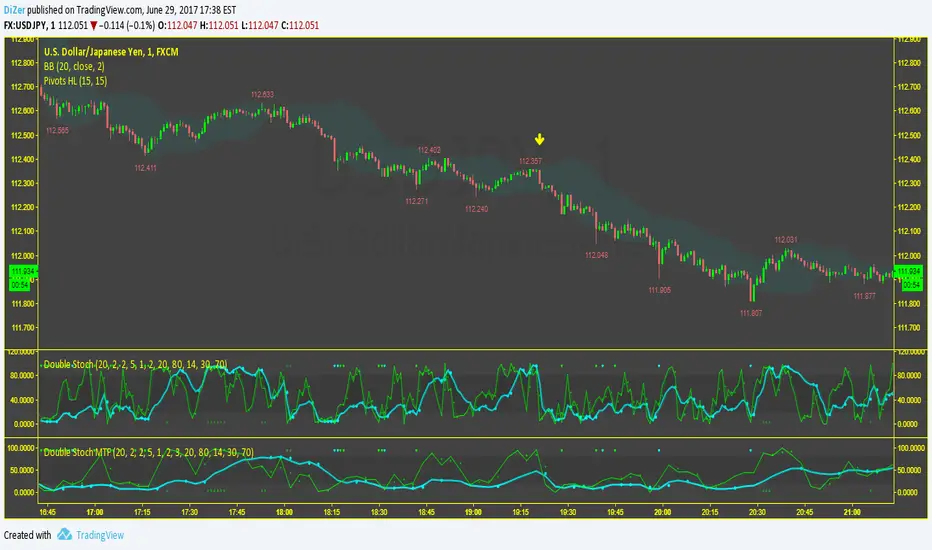
Trend Following StochasticI decided to work on a series of trend-following indicators, which use special moving averages to catch up with the market's trend.
This "Trend Following Stochastic" does a great job in smoothing out unnecessary noises and tries to give users a more accurate direction to which the market is moving.
If you want this TA, please put me on notice in personal message. Happy trading!
Indicateur Pine Script®

Ehlers-Smoothed Stochastic Oscillator [Krypt]This indicator is in principle similar to Stochastic Oscillator, but contains the following improvements:
- advanced Ehlers-based smoothing (typically results in earlier signals than regular EMA smoothing)
- graceful degradation when few candles present for improved accuracy in the beginning of the chart
- buy/sell signals based on K-D crossover above/below thresholds
Indicateur Pine Script®

Stochastics Real DealAfter years studying stochastics, here is the real deal
Stochastics comfirmation with very high probability setups
Green dots = it's time to consider stochastic signal of Buying
Red dots = it's time to consider stochastic signal of Selling
No dots = ignore stochastics signal
The formula for dots is really top secret
It works best on 1D timeframe
You can try the indicator for a trial period (just write in comments to have access), if you want unlimited access you can PM me after trial period
Remember: trading is a risky business, trade at your own risk. I'm not responsable for any gain or loss.
Indicateur Pine Script®

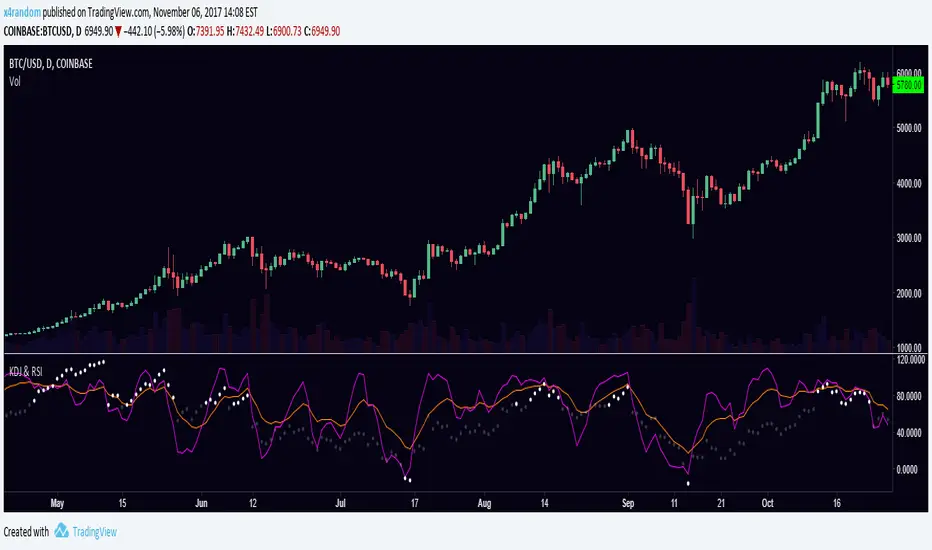
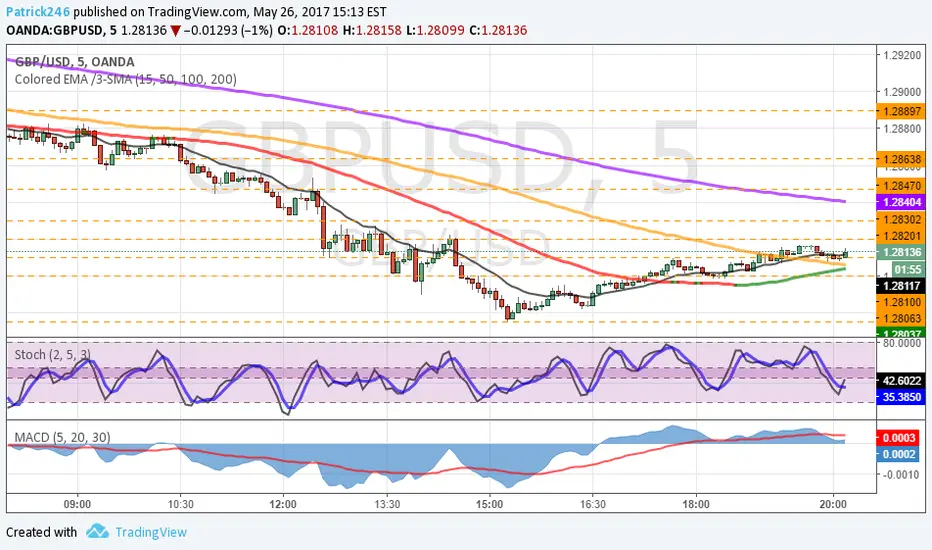
KDJ & RSIRSI and KDJ indicator combined.
KDJ: Buy when J (purple) is going up and and crossing KD (orange) from below. Sell vise versa.
RSI: Overbought when RSI is over 70, oversold when RSI is under -10.
Indicateur Pine Script®
Indicateur Pine Script®

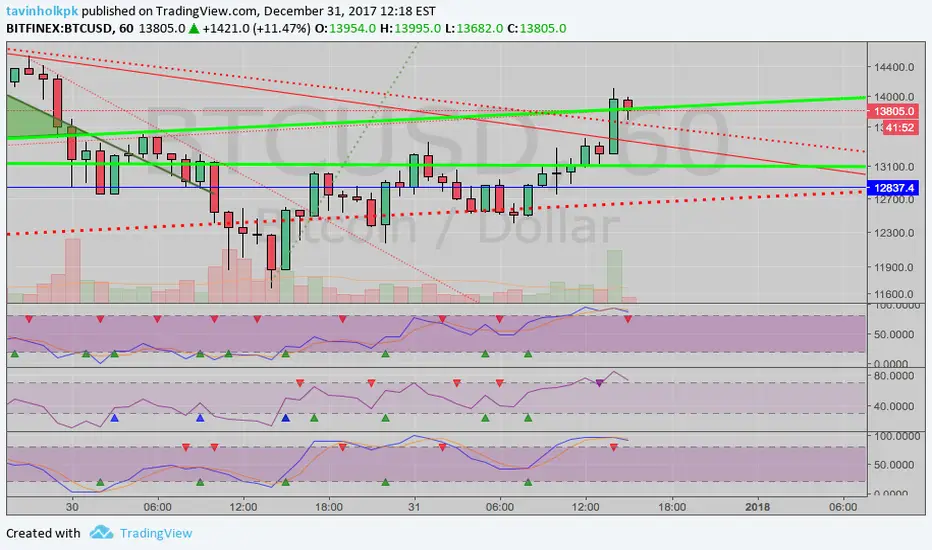
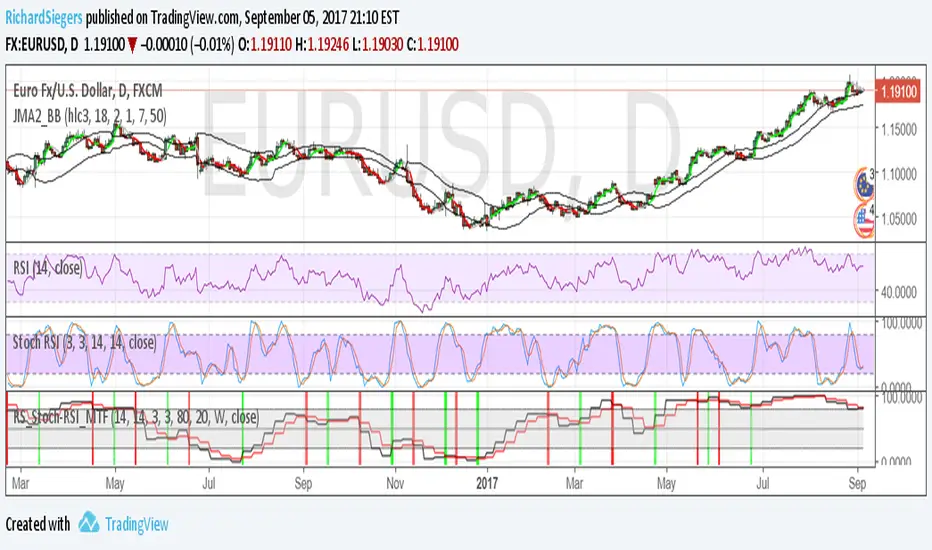
RS_Stoch-RSI_MTFmodification by Richard Siegers that turned stochastic mtf from ChrisMoody into stochastic-rsi mtf
Indicateur Pine Script®
Indicateur Pine Script®
Indicateur Pine Script®
Indicateur Pine Script®
Adaptive Stochastic Oscillator by Tushar ChandeAutomatically determines the best period of the Stochastic Oscillator to adapt to the current market conditions.
Indicateur Pine Script®
Stochastic with False bar R2-2 by JustUncleLThis study project is an updated version of the implementation of the "Stochastic False BAR" indicator.
Description:
The standard Stochastic buy/sell indications come from Stochastic crosses about the standard overbought/oversold zones (80/20). This does not always work and you get stuck in the OB/OS zones with a trend continuation. Utilising a second much longer length Stochastic, the "False BAR" (Black) indicates when it is unsafe to take Stochastic cross over trades. Where the false bar does not appear (aqua, no background highlighing), the overbought / oversold conditions of the Stochastic can be considered higher-probability reversal areas and thus trading opportunities.
This Revision:
Added options to enable/disable False Bar lines and Stochastic trends.
Added options to modify upper and lower limits of false bar Stochastic and trading stochastic trend.
Added option to show the trading Stochastic as coloured Ribbon.
Added name titles for all plots
Added Background highlighting for False Bar.
Indicateur Pine Script®

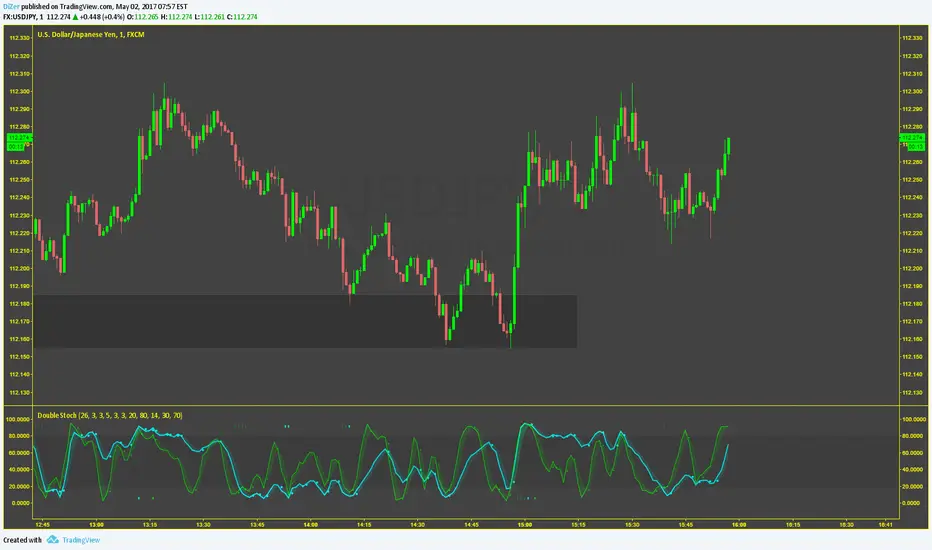
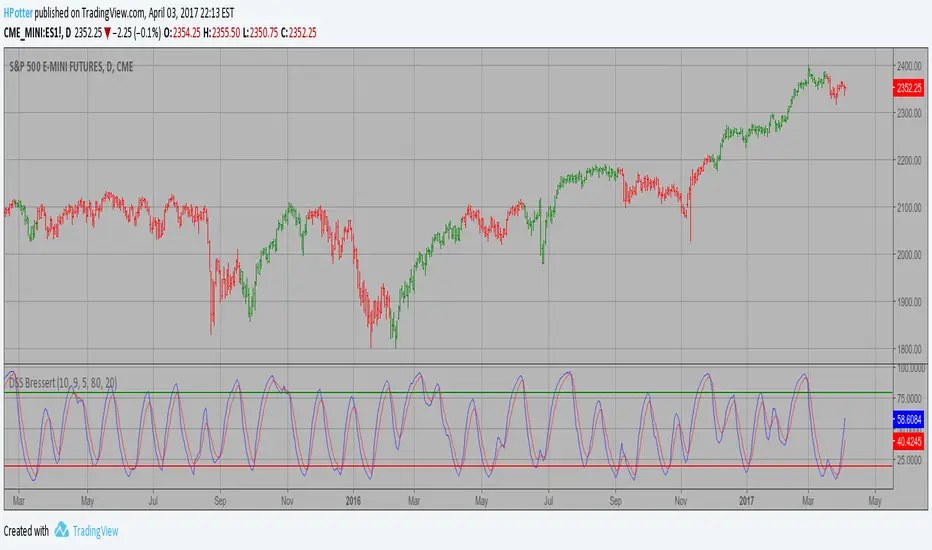
DSS Bressert (Double Smoothed Stochastic) Strategy Double Smoothed Stochastics (DSS) is designed by William Blaw.
It attempts to combine moving average methods with oscillator principles.
Indicateur Pine Script®
Revistochmanic Wave İndicator Revistochmanic Wave is a stock tracking trends indicator & strategy for medium & long term investing.
Stochastic 34 period
smoothK 5 period (ema/red line)
smoothD 13 period (stochastic/black line)
Indicateur Pine Script®

Classical Stochastic OscillatorI guess the build in STOCH indicator has some problem, it shows totally different compare to other software like MT4, so I create this one with the original definition, enjoy it!
Indicateur Pine Script®

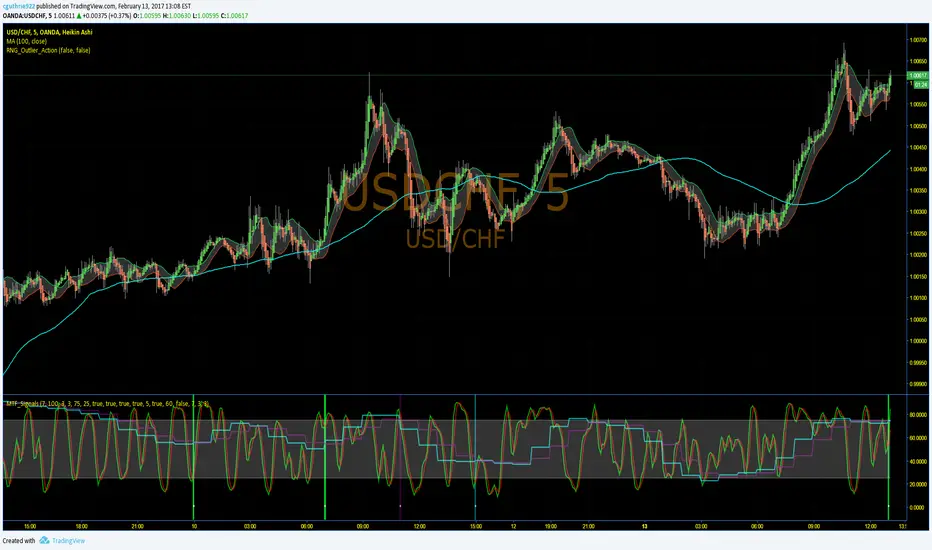
MTF_Stochastic_SignalThis script sets up signals based on Multi-timeframe (MTF) stochastics. Alerts can easily be created to inform users of aggressive and conservative potential BUY and SELL opportunities. Overbought and oversold levels do not matter when it comes to signalling, but each trader can set their own limits.
DEFAULT CRITERION
Conservative BUY criteria is when both stochastic timeframes cross upward at the same time the closing price is above the simple moving average.
Conservative SELL criteria is when both stochastic timeframes cross downward at the same time the closing price is below the simple moving average.
Aggressive BUY criteria is when both stochastic timeframes cross upward at the same time.
Aggressive SELL criteria is when both stochastic timeframes cross downward at the same time.
TO SET UP ALERTS
1. In the "Create Alert" menu, select the "MTF_Stochastic_Signal" as the Condition.
2. To the right of the condition select one of the options that has "greater than 1" at the end of it.
3. Instead of the word crossing in the dropdown below, select "Greater Than"
4. For the value, input 1. (My TRUE values are set to 50 in the event you want to turn the plot on, however, this is not neccessary as it is redundant)
5. Select the remaining options that suit your needs and click "Create". You have now set up alerts. I suggest setting all four options fo reach symbol you monitor.
Please feel free to ask questions and provide comments. I am always looking for ways to improve my scripts.
Enjoy!
Indicateur Pine Script®
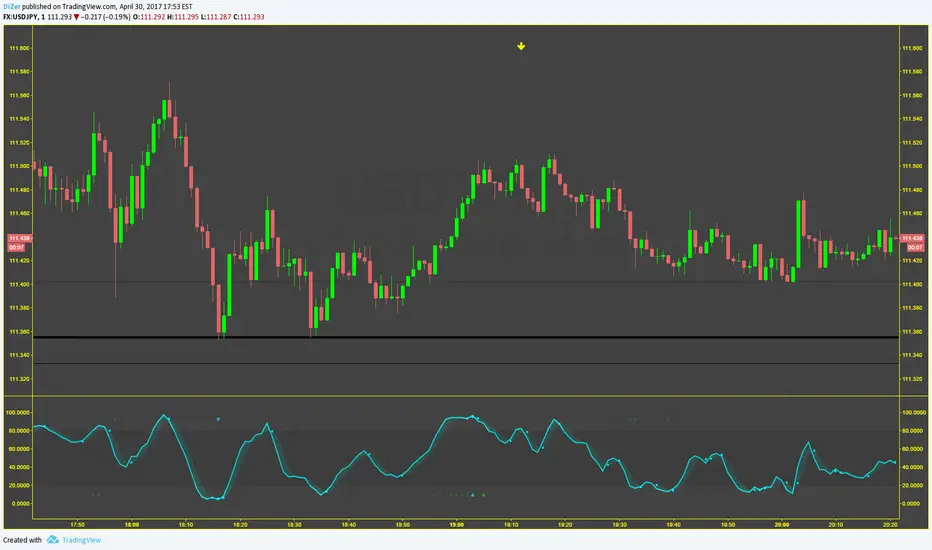
[M] StochasticNormal Stochastic has, painted in color when coming out of the zone of 80-20, remains in the gray zone. It makes for convenience.
-------------------
Обычный Stochastic, окрашивается в цвета когда выходит из зоны 80-20 , в зоне остается серым. Делался для удобства.
Indicateur Pine Script®

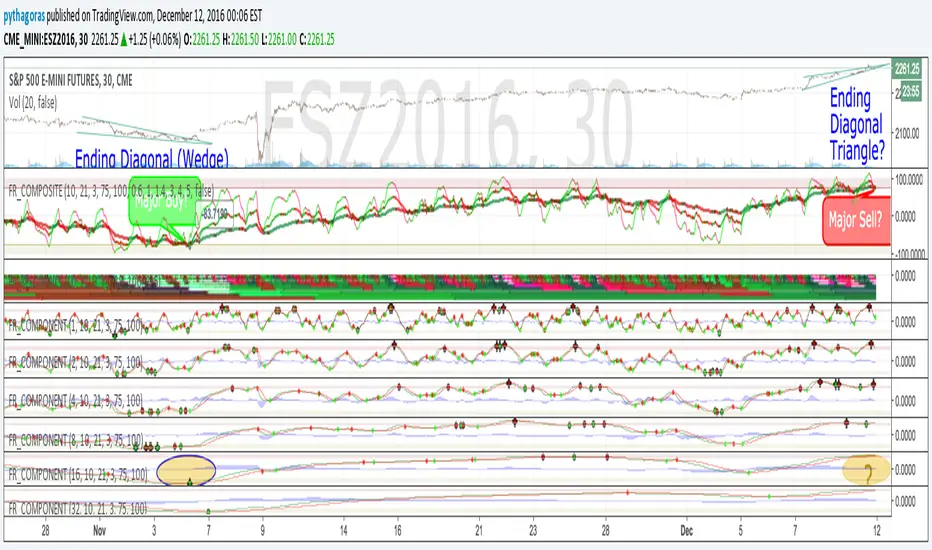
Fractal Resonance CompositeFractal Resonance Composite compresses 8 timescales of stochastic oscillators into just 3 color-coded composite lines: fast, medium and slow. Fast emphasizes the shorter timescale oscillators, medium considers all 8 timescales evenly, and slow emphasizes the longer timeframe oscillators. The composite lines indicate how overbought/sold the market is relative to the size of its recent movements. Major buys occur when all three composites enter the Oversold (green shaded) range and turn up, and major sells when all three reach the Overbought (red shaded) range and turn down. The fast line's quicker reversals and exaggerated alternations on smaller price moves makes it more fit for scalping. Notice the fast and medium lines tend to snap back toward the slow line like stretched rubber bands.
As is particularly apparent in the slow line, the nifty mathematics of the compositing process reconstruct the topology (peaks and valleys) of the underlying price curve in a smoothly distorted "cartoon" form that has a very useful property: the composite lines are confined to +-100% Extreme Overbought/sold oscillatory ranges. (By definition, only extremely rare "parabolic" moves can push all 3 composites beyond +-100%). If we knew that price would always stay confined to a certain range, trading would be much easier, no? Always buy the bottom of the range and sell the top!
How it works
To understand what's behind this nifty property, consider the mathematics of LazyBear's WaveTrend port .
The formula is fairly simple as indicators go yet statistically fundamental in a way that suggests it should have been the grandfather of all market stochastic oscillators. It's just a running average of the ratio:
(price's current deviation from it's mean)
-----------------------------------------------------------
(running average of absolute |price deviation from the mean| )
In formal statistics notation this is written:
E{ (X - E{X}) / E{|X-E{X}|} }
Where X is the price random variable and E{} the averaging or Expectation operator, implemented in this oscillator as exponential moving averages.
Conceptually, the denominator measures and normalizes by the typical size of recent price moves. This normalization process is what stretches or compresses the local price movements such that the whole composite curve can stay within the oscillatory range.
Attributes
The default fast=.6, medium=1, slow=1.4 compositing factors give each line visually distinct behavior, but can be tweaked to emphasize different oscillator "speeds".
Particular lines can be disabled by setting their line width to 0.
Indicateur Pine Script®
Fractal Resonance BarLazyBear's WaveTrend port has been praised for highlighting trend reversals with precision and punctuality (minimal lag). But strong "3rd Wave" trends can "embed" or saturate any oscillator flashing several premature crosses while stuck overbought/oversold. This happens when the trend stretches over a longer timescale than the oscillator's averaging window or filter time constant. Our solution: monitor many timescales. With Fractal Resonance Bar's rich color codings, strong wavefronts form across timescales and jump out like an approaching line of thunderclouds!
Fractal Resonance Bar color-codes the status of eight underlying stochastic oscillators, with each row averaging over twice the time of the row above.
Fractal Resonance Bar shifts its timescales along with your choice of main chart timescale:
1 minute chart: 1 minute through 128 minute (~2 hour) oscillators.
15 minute chart: 15 minute through 1920 minute (~32 hour) oscillators.
1 hour chart: 1 hour through 128 hour (~2 week) oscillators.
Daily chart: 1 day through 128 day (~4 month) oscillators.
The color map is configured as follows:
Hot Pink: Extreme Overbought (> 100%) rolled over to sell, but oscillators probably embedded with more upside (revert to Dark Green) possible after a pause.
Deep Red: Overbought (> 75%) crossover ripe for selling (validated when red spreads to timescales below).
Brown: Minor (< 75%) crossover sell from which could bounce back green or start a plunge toward gray/black.
Gray/Black: Mature (< -75%) sells turning full black in a plunge before the dawn.
Lime Green: Extreme Oversold (< -100%) and bouncing, though may yet bottom even lower.
Green: Oversold (< -75%) crossover ripe for buy. Green spreading to all timescales below will validate bottom is in.
Dark Green/Teal: Mature buy in overbought (> 75%) range, waiting for sell crossover to Hot Pink for a pause or correction.
White Stripes are Impulsive Trend Warning
Fractal Resonance Bar warns of oscillator embedding by showing white stripes when it detects strong, early surges in the timescale rows below.The white stripes usually accompany Hot Pink warning it's too early to go short, or Lime Green warning it's too early to go long.
Heeding these warnings will probably miss the exact top or bottom, but you're less likely to get overrun in a momentum move.
Usually the market gives us a second opportunity to short very close to the top or buy very close to the bottom after the warning white stripes have subsided.
NOTE: Recently rolled over Futures contracts may not have enough history for all oscillator calculations, in which case no bar colors will appear.
Tweakable Attributes
The default Channel Length, Stochastic Ratio Length and Lag Length work reasonably well on all timescales in our experience. Minor tweaks don't hurt but this may just overfit to a particular chart history.
We don't recommend changing the 75% Overbought and 100% Extreme Overbought default levels as these are ideal numbers relative to the underlying oscillator statistic calculations. But these settings can shift the color transition levels.
Embedded attribute controls the sensitivity/conservativeness of the white strip embedding detectors. Closer to 75 increases the warning sensitivity while closer to 100 decreases the aggressiveness of blocking white stripes.
Embed Separation also affects the white stripe sensitivity.
Row width increases each row's thickness to fill the available screen height you've afforded the bar.
Indicateur Pine Script®

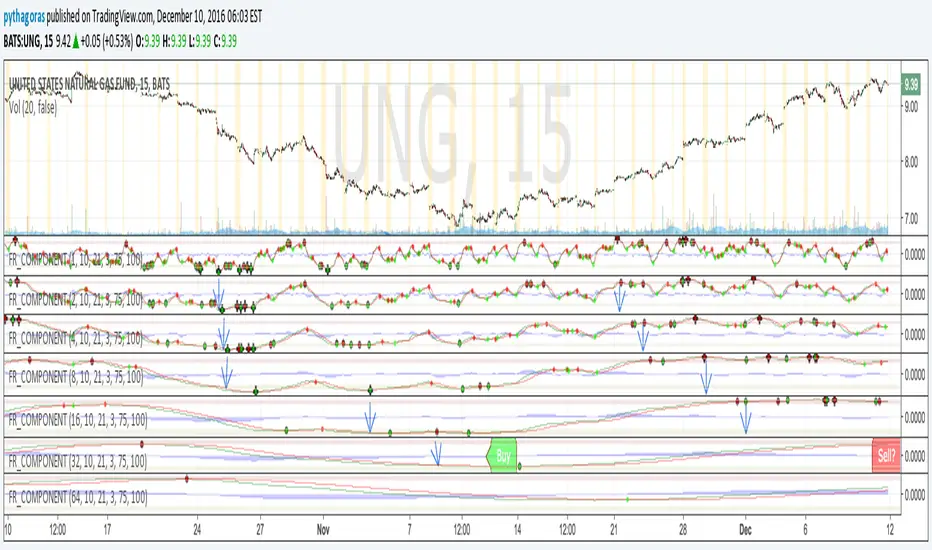
Fractal Resonance ComponentLazyBear's WaveTrend port has been praised for highlighting trend reversals with precision and punctuality (minimal lag). But strong "3rd Wave" trends can "embed" or saturate any oscillator flashing several premature crosses while stuck overbought/oversold. This happens when the trend stretches over a longer timescale than the oscillator's averaging window or filter time constant. Our solution: simultaneously monitor many oscillator timescales. Watch for fresh crossovers in "dominant" timescales alternating most smoothly between the overbought (red shade) and oversold (green shade) range.
Fractal Resonance Component facilitates simultaneous viewing of eight timescales that are power of 2 multiples of the chart timescale. Each timescale shows lead line, lag line, lead-lag difference, and crossover marks. Add 4 to 8 copies to your chart for a good multi-fractal read. Format * the "Timescale Multiplier" attribute of each row to be twice that of the row above for a sequence like 1, 2, 4, 8, 16, 32, 64, 128...
Fractal Resonance Component shifts its timescales along with your choice of main chart timescale:
1 minute chart: 1 minute through 128 minute (~2 hour) oscillators.
1 hour chart: 1 hour through 128 hour (~2 week) oscillators.
Daily chart: 1 day through 128 day (~4 month) oscillators.
Crossovers in different oscillator ranges tend to have different meanings:
Minor (< 75%) crossovers: small green/red dot
usually noise
Overbought/Sold crossovers (shaded 75 to 100%): black outlined dot (o)
reliable reversal indicators (when they appear alone)
Extreme Overbought (> 100%) crossovers: black outlined plus (+).
Can be a major reversal in fast markets, but usually portend the end of Elliot 3rd waves with just a small corrective (4th wave) retrace before the larger impulsive (5-wave) sequence resumes in original direction.
The final 5th-wave terminus should appear later as a lone non-extreme (black outlined circle) crossover on a slower timescale coincident with weaker (non-extreme) dot crosses on this timescale.
Careful examination of historical charts leads to many useful observations such as:
Dominant crossovers punctuating true reversals are usually in the green/red shaded ranges with black outlined dots (o) rather than minor or Extreme (+) ranges.
Due to market's fractal nature, two well-separated timescales like 1 minute and 1 hour can show dominant crosses simultaneously in opposite directions, e.g. the 1 minute showing a very short term high and the 1 hour a medium term low nearby.
Staying Nimble
Watch out for embedding on your supposedly dominant timescale -- a second cross while stuck in the overbought/oversold region suggests a stronger, longer trend than expected. Drop your eyes to a slower timescale below for the real dominant whose crossover will validate main trend reversal.
Embedding can often be predicted even at the first cross mark by checking whether the green lead line of the next slower timescale (one row below) has already hit the Overbought or especially the Extreme Overbought range but isn't close to rolling over. Fractal Resonance Bar (to be published) uses this principle to mark embedded timescales with white stripes, warning of a powerful trend wave on longer timescales you shouldn't fight until the white stripes subside.
Overnight gaps surge all timescales in ways that obscure the dominant timescale, so for shorter than daily charts, these methods work best on Futures contracts that only suffer weekend gaps.
Indicateur Pine Script®
B3 Stochastic FullA colorful take on the classic stochastic indicator, coded from scratch. Enjoy! :)
Indicateur Pine Script®

Price Divergence Detector V3 revised by JustUncleLThis is a revised version of the original "Price Divergence Detector by RicardoSantos".
Description:
Price Divergence detection for various methods : RSI, MACD, STOCH, VOLUME, ACC-DIST, FISHER, CCI, BB %B and Ehlers IdealRSI. Both Hidden and Regular Divergences are detected.
Mofidifications:
Revision 3.0 by JustUncleL
Added option to disable/enable Hidden and Regular Divergence
Added new divergence method BB %B (close only)
Added new divergence mothos Ehlers IdealRSI (close only)
Revision 2.0 - by RicardoSantos
References:
Information on Divergence Trading:
www.babypips.com
www.incrediblecharts.com (BB %B)
Indicateur Pine Script®

Stochastic Momentum IndexThis is an implementation of the Stochastic Momentum Index from William Blau's his article in Stocks & Commodities .
This also allows the use of various different kinds of moving averages for the signal line. Options for this argument are:
sma (simple moving average)
ema (exponential moving average)
wma (weighted moving average)
trima (triangular moving average)
zlema (zero-lag exponential moving average)
dema (double exponential moving average)
tema (triple exponential moving average)
hma (hull moving average)
Indicateur Pine Script®