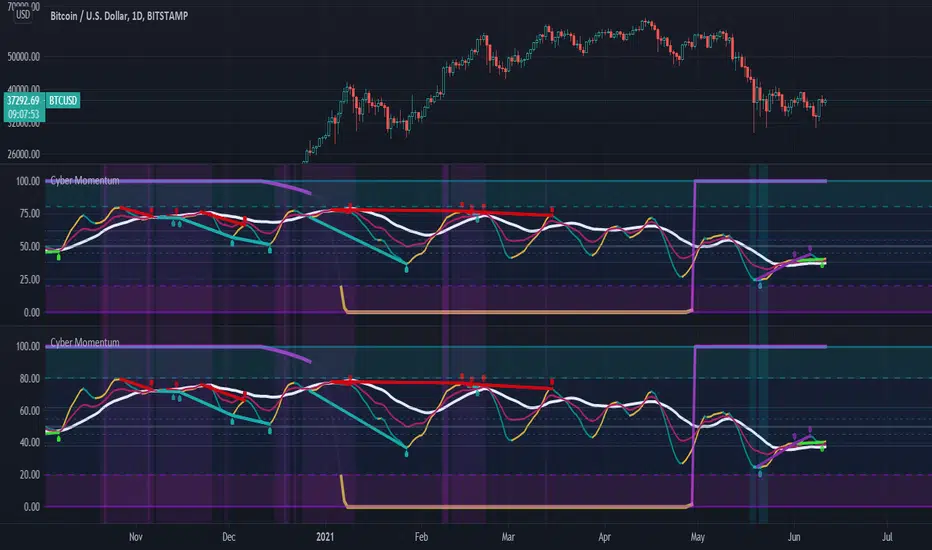
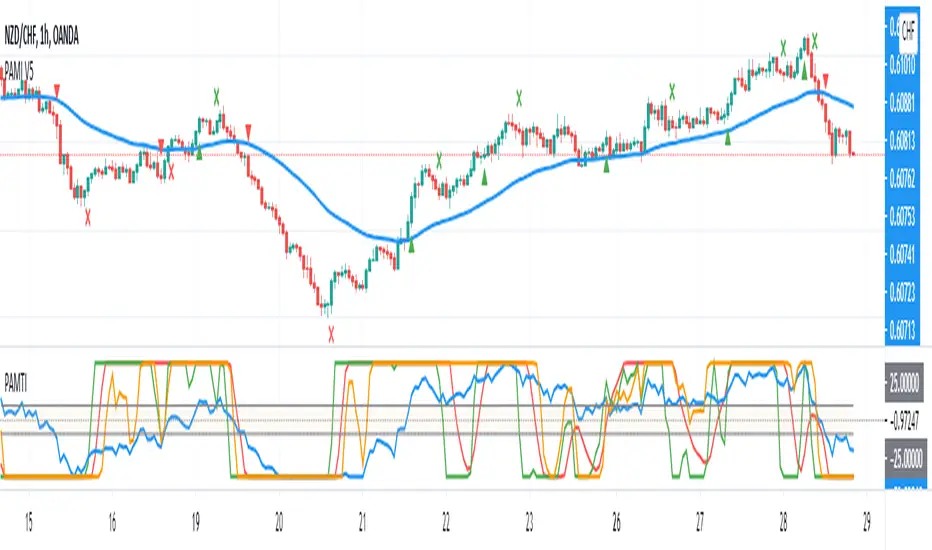
Cyber MomentumThis oscillator is the combination of different settings RSI , RSX , STOCHRSI , MSI ,... in a Stochastic function that can help traders to understand the weakness and strength of momentum in candle sticks in different time frames.
This oscillator organized by three Line , control zone and Divergence Line
1:) Fast Line
2:) Slow Line
3:) Heavy Line
4:) Neutral Zone between Fibo 38.2% & 61.8%
5:) Bullish Control Zone
6:) Bearish Control Zone
7:) Divergence Line
And there are two theories of finding tradable signals behind those parts .
The first and the most simplest theory is the situation that the Fast Line has the possibility to be supported by Slow or Heavy Lines and basically reverse its slope !!
But there are some rules and notes for this theory ... First of all the accuracy and rate of that is variable in three main categories of situation
1:) with or without price action reversal structure like reversal pattern (Head&Shoulder , Quasimodo , .... )
2:) with or without regular divergence
3:) in which control zone ?
So basically the most powerful setup occurs when price action is already in the reversal structure and the potential to have at least one drive of regular divergence exist and also the Fast Line is in the opposite control zone of the current time frame trend .... so obviously if one of those rules will not be satisfied so the signal will be the less value
The second theory is the signals that occur after the reversal, obviously a sign of trend continuation. there are two type of that you can use with this oscillator
The first one happens when price reverses its trend and this oscillator is moving to the neutral zone ... so if at least one drive of hidden divergence exist the neutral zone will have good possibility to reverse the slope of the oscillator obviously this would happen usually after hidden divergence confirmed .
and the second one is basically the first type but after the reversal Subsequently in the outside of the bullish/bearish control zone ... those kinds of signals are NOT the reversal potency signal at all !! they designed for trend continuation... be careful of them and try trade with your old friend trend ! .... also The existence of hidden divergences will be better for trade in this kind of signals .
The idea of this oscillator was inspired by @mrhashem Borjas Tarh Momentum.
Stochastique RSI (STOCH RSI)
Bjorgum RSIRSI output signals are displayed with color change to reflect the plotted value. This makes evaluating RSI conditions require but a glance.
RSI momentum buy signals are given on the cross of the 50 level, whereas sell signals are given on a fall below.
Default values a 5 period RSI which gives more timely entrances and exits for swing traders. This can be adjusted to the typical 14 period if the viewer desires slower signals.
Bullish and bearish area is shaded to accentuate the signal to the eye.
Excellent results can be found when coupling BJ RSI, with BJ TSI, and the reversal system using all 3 as a complete together simultaneously
Default color changes are plotted as a recorded value falls within the following levels:
RSI < 30 = green
RSI 30-50 = red
RSI 50-70 = blue
RSI 70-80 = yellow
RSI 80-90 = orange
RSI 90-100 = white hot

REDWOOD MTF MacD Stochastic RSIOne of out most premium indicators is this MTF MacD Stochastic RSI combo.
This is calculated with specific conditions to give the best signals for market reversals or continued trends.
=======
For a detailed description of how the REDWOOD MacD works, see profile (links of personal indicators arent posting for some reason)
For a detailed description of how the REDWOOD Stochastic RSI works, see profile
=======
These are both powerful indicators alone, but together they work very well together to confirm positions or see new entries or exits.
Without giving too much away on how it is made, this takes trades when the MacD is weak, with a confirming signal from the Stoch RSI
just the other way, it takes trades when the MacD is strong, and the Stoch RSI confirms trend.
This was made to reduce clutter of watching multiple indicators, while still giving you a chance to see what both indicators are doing and how they are flowing together.
Custom alerts are set so you never miss a trade opportunity! Get alerted on all reversals, strong signals, or even signals from the MacD or Stochastic RSI crosses!
This is a Multi Timeframe indicator so you can see what is happening on a long term time frame while trading short time frame bars, getting a better position in the market.
Best trades are when the alert or indicator is signaling, and the close of the MacD is about to happen on the MTF time frame set. All timeframes for both MacD and Stoch can be customized, and they do come with default settings.
Best MTF Time frames are longer timeframes (1hr, 4hr, D) but it can work well with current timeframe and lower timeframes (15min, 30min)
All settings for the MacD and Stoch are the same as the original, you can remove the MacD or histogram, remove or see crosses, and even color in pivot points in the MacD
~~~
Added feature is this indicator by default shows the MacD to tell you the overall trend, but you can uncheck the Show MacD setting to remove the MacD and check the Show Stoch RSI to have the indicator show you the Stoch RSI all in the same indicator! This is extremely useful to see where the Stoch RSI is at when the MacD is turning or pivoting. If the stoch is turning as well and overbought or oversold, it is a good time to enter or exit a position.
Dark Green is showing buy signals, and dark maroon is showing sell signals.
The coloring in the background (red, lime) is showing the trend we are riding and when the color goes away it is an indication of a possible trend reversal or dip coming. These are mostly used to confirm positions.
~~~
The timeframes I recommend would be the 4hr on both, althought it has proven to work well (if you want more signals) to have either the MacD or Stoch RSI on a higher timeframe and the opposite on a lower timeframe.
All plots and inputs can be customized to your own liking, and there is the option to color the bars with the Stoch RSI being overbought or oversold.
Best Trading Strategy : Enter positions according to the colors being alerted (green = buy, red = sell) when the FIRST is alerted. This is the ideal and best entry.
For safer trading you can wait for a second to confirm and enter there.
Trades can be taken on the shading colors too, trading on trend waves, although this is risky as some waves end abruptly. Best signals are as stated above.
This indicator works very well on its own but can work well along side our other indicators listed here :
Bishop MA's or MA Cloud with Fill
This can be a very useful indicator, and I'm sure some may find settings that work even better
than the default or recommended settings.
This indicator works on all markets, forex, cryptocurrency, and stocks.
For access to this and all indicators available, please DM me here or See profile.
We are here to help each other succeed! The more one succeeds the more we all succeed! We are all in this
together and every person deserves to be financially independent and confident when taking trades
and investing.

REDWOOD MTF Stochastic RSI
This MTF Stochastic RSI is custom made to help give you an edge while trading.
As you see the MTF Stochastic RSI is colored depending on the trend and if "K" is above or below "D".
This indicator shows the crossover or crossunder of these values with the colored circles that
are plotted. This can be a very useful indicator to show you Oversold or Overbought areas of an
asset, giving you ideas of when to take profit or enter a new trade.
For more information on Stochastic RSI in general (for reference) Please see the detailed
description here : www.investopedia.com(StochRSI)%20is,than%20to%20standard%20price%20data.
This Stochastic RSI is a Multi Time frame Stochastic, meaning it can show you higher or lower
timeframes of the Stochastic RSI no matter what current time frame your chart is on. This is
applied in the settings of the indicator by default, with a default timeframe of 1hr.
You can easily change back to the current time frame by checking the box "Use current Timeframe?".
This can be very useful to get into a trend early, entering or exiting on low time frame bars while
seeing the live Long time frame Stoch RSI.
All inputs of K, D, RSIlength, Stochlength, Overbought and Oversold areas can be customized to
your liking. By default these run on the recommended Stoch RSI settings and values on tradingview
with overbought and oversold areas at 80 & 20.
There are inputs that will color the bars depending on if the Stoch is showing Overbought(red) or
Oversold(lime) regions, and a separate color setting that colors bars with the color of the Stoch
itself, showing when K is over D and vise versa.
For trading with this indicator, it works very well with a indicator confirming the position or
potential change that is happening, I recommend the MacD. Specifically, the REDWOOD MTF MacD.
When K crosses D and is showing the Stoch green or lime, this is when to take a Long or buy
position.
When D crosses K and is showing the Stoch red, this is when to take a short or sell position.
To filter out false crosses or trades, this is where I recommend the MacD, taking trades on the
Stoch when the MacD is showing signs of a reversal or crosses itself. These provide the strongest
signals and buy and sell positions.
This is recommended as a swing indicator, but can be used for scalping at your own risk.
As for recommended time frames to use for the MTF settings, I would stick to longer timeframes to
show the overall trend. With that being said, it can be used on shorter timeframes as well and
works good. I would sick to the 1hr or 4hr timeframes, and for lower I recommend the 15min or
30min timeframes. The lower you go the more signals will be provided, but with that lots more
false signals will show as well if the asset is volatile.
All settings, colors, and plots can be customized, and all are labeled to make it easy for you.
Alerts for each setting will be added in the future for simplicity, as of now the alerts can be
made as usual, having the indicator plot K crossing the indicator plot D, telling you of a change
in the Stoch.
This can be a very useful indicator, and I'm sure some may find settings that work even better
than the default or recommended settings.
This indicator works on all markets, forex, cryptocurrency, and stocks.
For access to this and all indicators available, please DM me here or See profile. We are here
to help each other succeed! The more one succeeds the more we all succeed! We are all in this
together and every person deserves to be financially independent and confident when taking trades
and investing.

MACD Trend CandlesThe script combines 2 indicators (MACD and Stoch-RSI) and puts them visually directly on the candles - can be used with normal OHLC candles or Heiken Ashi candles. Furthermore, you can derive divergences exremely easy directly visually from the candles as well. Lastly, a SMA 20 high and a SMA 20 low line build a trend channel.
Script is best used in trending markets to trade with the trend.
1) SMA trend channel:
* uptrend: close above
* downtrend: close below
* aggressive entry (uptrend) closing inside channel from below
* conservative entry (uptrend) closing above channel from inside
* hold (uptrend) until close below channel
* can be used accordingly for the downtrend
2) MACD candles
* visualization of the MACD histogram directly on the candles
* dark blue: histogram > 0 and histogram > histogram of previous candle
* light blue: histogram > 0 and histogram < histogram of previous candle
* orange: histogram < 0 and histogram < histogram of previous candle
* light blue: histogram < 0 and histogram > histogram of previous candle
* hold uptrend (dark/light blue candles) - combined with trend channel (above channel)
* hold downtrend (orange /yellow candles) - combined with trend channel (below channel)
* Color divergence: light blue candle > dark blue candle (price and MACD show divergence (bearish)
* Color divergence: yellow candle < orange candle (price and MACD show divergence (bullish)
* Trend change (0 line cross to upside) yellow or orange to dark blue
* Trend change (0 line cross to downside) dark or light blue to orange
3) Stoch RSI diamonds
* visualization of the STOCH-RSI as diamonds above or below the candle
* k, d line > 80: diamond above the candle
* k, d line < 20: diamond below the candle
* divergence caldle without diamond above > candle with diamond above (bearish divergence)
* divergence caldle without diamond below < candle with diamond below (bullish divergence)
Feel free to test each part individually and combine it with other indicators, e.g. BBands and Ichimoku Cloud - you will see it is a powerful visualization script
HAVE FUN

Cyclic Smoothed RSI with Divergence IndicatorI created a single indicator that combines 1) Cyclic Smoothed RSI and 2) the Divergence indicator (bull, bear). It is very handy when used with the MACD and crossover points.
Please refer to for info on how to use the cRSI indicator.
Info on the chart.
1) Red dotted lines = cRSI crossed back from overbought and crossover in MACD
2) Red solid lines = Bear divergence and crossover in MACD
3) Green dotted lines = cRSI crossed back from oversold and crossover in MACD
4) Green solid lines = Bull divergence and crossover in MACD
5) Black transition = cRSI crossover but NO crossover in MACD

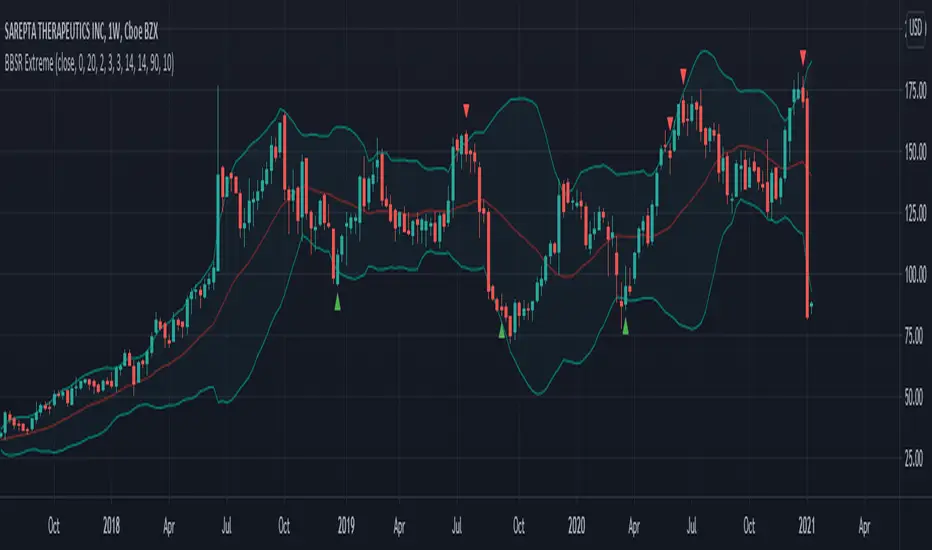
Bollinger Bands Stochastic RSI Extreme SignalThis is the finalized code released to the public that I created in a video linked here.
This indicators combines a Bollinger Band and Stochastic RSI to produce signals for possible price reversal. The signals are displayed by default as green arrows for bullish and red arrows for bearish.
To trigger a signal the indicator checks for the following:
(Bullish)
A candle closes above the upper Bollinger Band
The following candle closes within the upper Bollinger Band
The RSI Stochastic is below the set threshold (10 by default)
(Bearish)
A candle closes below the lower Bollinger Band
The following candle closes within the lower Bollinger Band
The RSI Stochastic is above the set threshold (90 by default)
ALLinDivergence v12.60 :: PinPoint BUY/SELL OpportunitiesEasy to spot BUY/LONG or SELL/SHORT ENTRY POINT opportunities.
Just follow this 9 RULES!
Rule 1. ONLY THINK OF GETTING IN A POSITION when BackgroundWave is coloured GREEN and ON POSITIVE SIDE of Flat White Line
Rule 2. ONLY THINK OF GETTING IN A POSITION when BackgroundWave is coloured RED and ON NEGATIVE SIDE of Flat White LineRule
Rule 3. ENTER BUY POSITION (Same Direction) when HigherHighs of MiniWave are coloured GREEN and they are getting BIGGER - needs to be confirmed with RULE 1.
Rule 4. ENTER BUY POSITION (Change) when LowerLows of MiniWave are coloured RED and they are getting SMALLER - needs to be confirmed with RULE 2.
Rule 5. ENTER SELL POSITION (Change) when HigherHighs of MiniWave are coloured GREEN and they are getting SMALLER - needs to be confirmed with RULE 1.
Rule 6. ENTER SELL POSITION (Same Direction) when LowerLows of MiniWave are coloured RED and they are getting BIGGER- needs to be confirmed with RULE 2.
Rule 7. Draw DIVERGENCE TRENDLINES on HIGHS or LOWS to ease your "spotting capabilities" and to be able to set up whatever ALERT you need
Rule 8. IF NOT SURE - CLOSE THE POSITION
Rule 9. DO NOT BE GREEDY - FOLLOW THE PLAN, whatever it is - but definitely THE PLAN SHOULD EXIST)
TIP:
1. First choose your favourite TimeFrame (mine is 30min) and draw all the Lines you need for better preview of the situation and LOCK them (believe me!:)
2. After some move (BUY/SELL) is just about to get confirmed on 30min TF, you can go on lesser TF (i usually analyze 1min, 3 min, 9 min and 15 min) down to TF that its GREEN/RED waves still makes sense (does that makes sense?)
3. On smaller TF you will get confirmation faster but sometimes they are more unreliable than in bigger TF. But if it aligns with a confirmation from 30min TF than i guess it should be OK to judge a bit early:)

RogTrader AlgoA simple BUY/SELL algorithm based on Moving Averages (EMA), MACD, RSI, Stochastic, ADX, ATR, CCI, OBV, Pivot Points, and Parabolic Sar, and Volume averaged.
Simple algo that uses multiples indicator strengths and weight them to generate buy and sell signals
Indicator strengths are displayed on each candle (green is bullish and red is bearish)
Green Buy and Red Sell shall be primarily used for long positions
Bull and Bear Strengths are created based on Price Action, and Volume, the length of the array shows upward or downward strength
Indicators' Signal Strength shows number Indicators' indication for the direction.
Bollinger Bands are in red and green filled
VWAP Bands are in gray, green, and red
Linear Regression is the blue line
Check multiple timeframes.

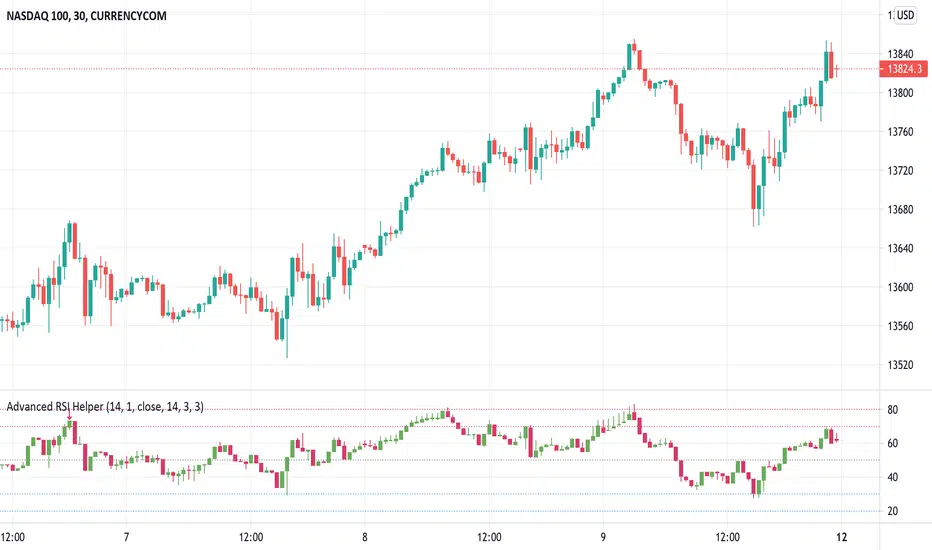
Advanced RSI HelperHere is Advanced RSI Helper. An advanced RSI represented in a candle type chart. It contains a Stochastic and a Pivot Detector (High-Low) and RSI divergences.
It also contains a Filter which you can configure the upper, lower zone to colorize the bars on the chart only when you are overbought or oversold, when you are in range the bars appear "transparent".
You also have the option of placing alerts for divergences or when the rsi exceeds the upper zone 1 / 2 or lower zone 1 / 2.
if you encounter any bugs do not hesitate to let me know in the comment area. The same goes for your suggestions.
Cheers and remember, risk management is the most important!
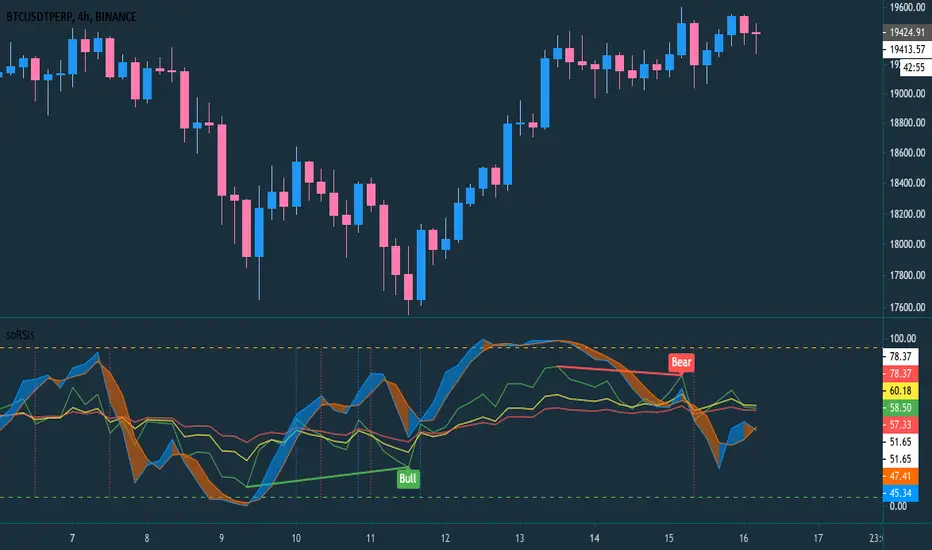
soRSIs - Stochastic RSI versus RSI GroupsoRSIs is about collaboration between Stochastic Relative Strength Index (SRSI) with Relative Strength Index (RSI) Group
RSI Group is group from three RSI, by default is 6,14, and 25
How to read:
If SRSI crossed over RSI Group, it can indicate an uptrend confirmation
If SRSI crossed under RSI Group, it can indicate a downtrend confirmation
If SRSI rejected to cross under RSI Group, it can indicate a correction recovery
If SRSI rejected to cross over RSI Group, it can indicate continuity correction
If RSI group perform descending 25,14,6, it can indicate bearish
If RSI group perform ascending 6,14,25, it can indicate bullish
If RSI group or SRSI reaches overbought line, it can indicate warning for LONG and good for SHORT
If RSI group or SRSI reaches oversold line, it can indicate warning for SHORT and good for LONG
It works in all time frames, but please keep in mind, higher timeframe can have stronger confirmation and trend.
The indicator settings:
Show Crossed RSI: default is true, it will show vertical line if RSI1 crossed under/over the RSI2 and RSI3
Source: default value is close, it is the resource when and where data are taken
RSI1: default value is 6, but user can change any value
RSI2: default value is 14, but user can change any value
RSI1: default value is 25, but user can change any value
Overbought: default value is 95, it is horizontal line on the top that indicates over bought or strength index fullness
Overbought: default value is 5, it is horizontal line on the top that indicates over sold or strength index weakness
The rest settings are about Stochastic RSI
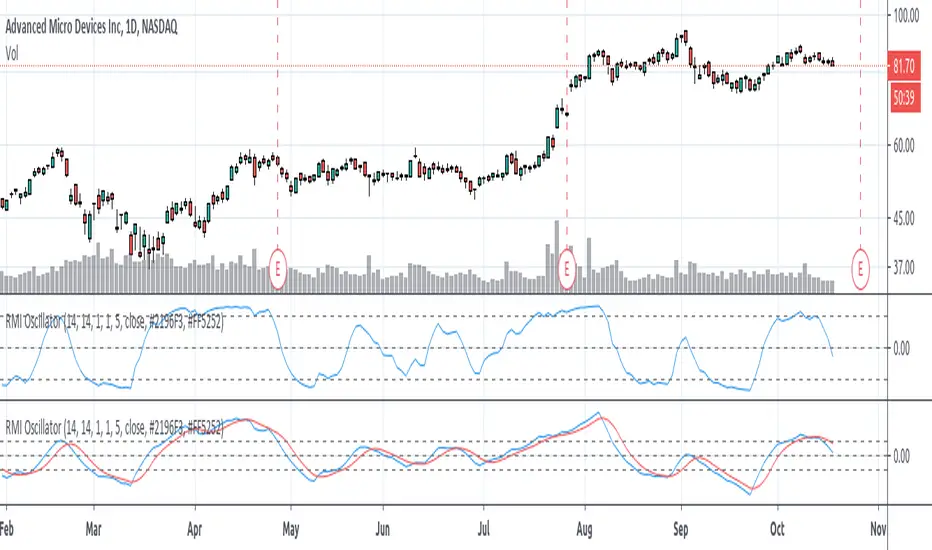
Relative Momentum Index (RMI) OscillatorThe Relative Momentum Index (RMI) is a sibling to the RSI. Where the RSI measures trend based on the average (RMA) of gains and draws over a length of time , the RMI measures based on the SUM of gains and draws . Myself and many others have found that the RMI oscillates better than the RSI does.
I paired the RMI with the oscillation method the Fisher Transformation uses to oscillate the value from -1.0 to 1.0 instead of the Stochastic way of 0 to 100. This way you can enable the Fisher transform, if desired. But I also just prefer the appearance of that.
Some options and features I have coded in-
RMI Length: This is the length of the Relative Momentum Index itself. Like the length of RSI, default 14
Oscillation Length: This is your oscillation length, like a Stochastic. If you put the length at 1 it will turn the indicator into the straight up RMI indicator. (If you select to use the Fisher Transform, the overbought/oversold lines will not show nicely)
Source Pre-Smoothing: The option of smoothing out the source, ie close, before you even run it through the RMI, oscillation, and/or transform
Oscillator Post-Smoothing: The option of smoothing the output of the script
Trailing MA: If desired, you can check the box to Use a Trailing Signal, and enter the length of lookback for a Simple Moving Average (SMA) of the RMI Osc value
Use Fill Colors on MA: If enabled, it will fill the area between the RMI Osc and the trailing MA. I chose to use colors that are similar to some educational ideas I have published, whereby nearing the bottom of the oscillation you get Green to signal Accumulation, and near the top you get Red to signal Distribution. Following red is Black, where you typically get late signal sellers that Capitulate and sell stops trigger. Blue is where traders tend to Chase price up.
The most primitive way of using this indicator would be sell when the value exceeds the overbought/top line and buy when it falls below the oversold/bottom line. You can find ways to use the fill colors, or MA crossovers, rising lows or rising highs, etc. for signals.
Here's a comparison of this indicator to the Stochastic RSI, using similar values-
Here's showing the indicator on intraday values at defaults with some pre- and post-smoothing-
Same thing, but with Fisher Transform enabled-
And an example of the fill bands in action-
Please feel free to use any part of this code as desired.
Stochastics and RSI HybridThis is an interesting study. We know bollinger bands can be a useful tool for price action, but what if we applied them to other indicators?
The top chart is the Stochastics and bottom chart represents RSI. We can see a relationship between the two indicators, where the signal line bounces of the bollinger bands.
The strategy is simple, when the signal lines bounce of their bollinger bands together, review price action and then take the trade. If you see one indicator going in the opposite direction to the other, or opposite to price action, then you may be observing divergence in which case a big move is about to happen.
If you wish to have this indicator further customised, please do not hesitate to contact me.

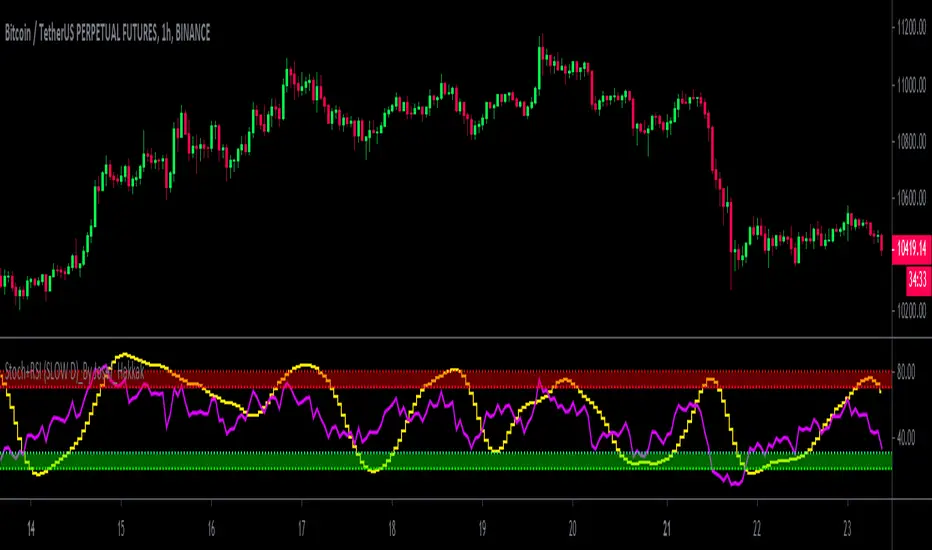
Stoch+RSI (SLOW D)_By Josef_HakkakStoch+RSI (SLOW D)_By Josef_Hakkak
Stochastic and RSI by SLOW D%
-> How to use:
B UY = When the yellow line (D of Slow Stoch ) goes out of the green range, it is better that the purple line ( RSI ) is be low
SELL = When the yellow line (D of Slow Stoch ) goes out of the red range, it is better to have the purple line ( RSI ) is be high
This script was previously written by RRanjanFX and has now been edited by me and changes have been made to optimize for shorter timeframes.
Edited and updated and optimized from:
RRanjanFX
Many thanks and loyal to RRanjanFX
PT RSx RSIVersion 1.0 of our RSx RSI indicator was developed initially as a scalper. It helps determine a possible top/bottom for a specified time frame. The indicator is a modified version of the original RSI . We added a second line to help give you a visual on a bull/bear cross.
Bull crosses at the bottom of the range indicate that the current trend is trying to reverse & vice versa.
We also added a series of Fibonacci levels that act as pivotal areas. We have two highlighted areas that offer volatility . Our Red zone (upper fibs) should prompt you to look for short entries & our Grey zone (mid fibs), which acts as a neutral/range area.
This Oscillator was built around our buy sell indicator & it is used on all time frames for swinging & scalping. It is included as part of the library. Just message us for access!

PT MSTx StochasticVersion 1.0 of our MSTx Stochastic indicator helps determine when a trend is strong vs. exhausted. The indicator is a modified version of the original stochastic. We added a second line for further confluence, which acts as support & resistance. The added smoothing toggle of the indicator can help you get a different perspective of the move. We also added a series of Fibonacci levels that act as pivotal areas. We have two highlighted areas that offer volatility. Our Red zone (upper fibs) should prompt you to look for short entries & our Grey zone (mid fibs), which acts as a neutral/range area.
Main line – Faster settings that move through support/resistance quicker.
Signal line- Slower settings that tend to act as support/resistance for our main line.
Strategy:
Shorting- Look for the Main line to cross down into the Signal line & then retest the Signal line. Stronger signal if algo is active (Maroon).
Longing – Look for the Main line to cross up into the Signal line & then retest the Signal line. Stronger signal if algo is active (Green).
This Oscillator was built around our buy sell indicator & it is used on all time frames for swinging & scalping. It is included as part of the library. Just message us for access!

MTF Stoch RSI ScreenerDisplays when multiple timeframes of Stochastic RSI are overbought/oversold. Multiple consecutive timeframes being overbought/oversold can signify a short term top or bottom.
Thanks to Micse in Pinescripters telegram who helped remove a few errors from this.

GnG - WaveTrend with RSIShow WaveTrend Line and Stochastic RSI line Indicator in one script
When Stochastic RSI Line cross will show signal.
Helping users to know the signal of reversal.
Disclaimer On and Take your Own Risk.

CryptoSignalScanner - OverBought/OverSold Zone IndicatorDESCRIPTION:
This indicator has been designed to do some swing trading on 4 hour and daily candles.
It also gives good results on the lower timeframes 5m, 15m and 1h but trading on those levels is time consuming and stressful.
• This indicator is based on RSI, Stochastic RSI and some other indicator(s).
• This indicator is based on our "CryptoSignalScanner - Advanced BUY/SELL Indicator" but with a small difference in calculation to define the OverBought and OverSold zones.
• It displays the OverBought and OverSold zones.
• It is also possibility to set an OverBought/OverSold, OverBought and OverSold alert.
HOW TO USE:
• When the OverBought zone is displayed it means that the trading pair is OverBought. Wait for the reversal to SELL. Use the Fibonacci tool together with the Eliot Waves Theory to SELL.
• When the OverSold zone is displayed it means that the trading pair is OverSold. Wait for the reversal to BUY. Use the Fibonacci tool together with the Eliot Waves Theory to BUY.
FEATURES:
• You can adjust the OverBought and OverSold zones.
• You can display/hide the RSI.
• You can adjust RSI values.
• You can display/hide the Stochastic RSI.
• You can adjust Stochastic RSI values.
• You can display/hide the ...
• You can adjust the ...
• You can set OverBought/OverSold alert.
• You can set OverBought alert.
• You can set OverSold alert.
• Etc...
REMARKS:
• This advice is NOT financial advice.
• We do not provide personal investment advice and we are not a qualified licensed investment advisor.
• All information found here, including any ideas, opinions, views, predictions, forecasts, commentaries, suggestions, or stock picks, expressed or implied herein, are for informational, entertainment or educational purposes only and should not be construed as personal investment advice.
• We will not and cannot be held liable for any actions you take as a result of anything you read here.
• We only provide this information to help you make a better decision.
• While the information provided is believed to be accurate, it may include errors or inaccuracies.
HOW TO GET ACCESS TO THE SCRIPT:
• Use the link below to subscribe to our indicators.
Good Luck,
SEOCO

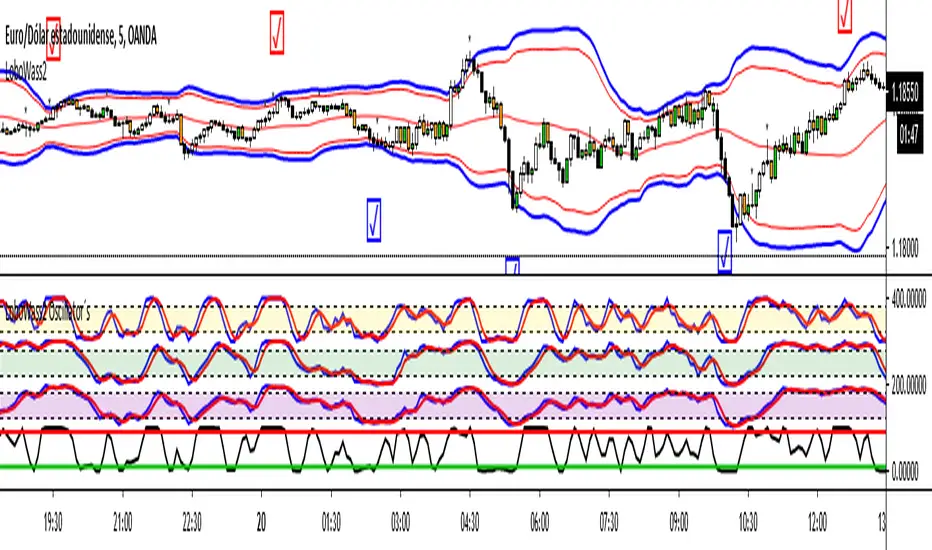
LoboWass2 Oscillator´s by Hashtag_binaryThis indicator composed of several oscillators was designed to be used with the strategy called LoboWass2 to be applied with Binary Options.
The idea of these oscillators is to be able to observe when all together appear in the same position, either overbought or oversold, and take the trade.
Remember that this is a confirmation tool, you must carry out prior analysis as your capital could be at risk. I recommend using this tool for the indicated strategy, as it was designed for that purpose. By working properly and professionally you can achieve great results, it all depends on you.
Profit Accumulator Momentum Trend IndicatorMomentum Trend Indicator
This is a support indicator to the Main Indicator which has also been published.
This indicator uses a modified stochastic trendline and a smoothed momentum line (which combines stochastic, RSI and moving average). This is a centred oscillator from -100 to 100 which makes it easier to track. The stochastic line is the quicker moving line which potentially acts as the first trigger. If the momentum line then begins to follow, then it is an indication that a trade should be made.
Long Trades: The Stochastic line is above 25 and the momentum line is greater than -25.
Short Trade: The Stochastic line is below -25 and the momentum line is less than 25.
Whilst an actual alert function is not set for the indicator, the TradingView alert function can be used to trigger a message when either the stochastic line or momentum line crosses -25/25 (the key levels).
I've been using this successfully on the one hour FX charts, but seems to work equally as well on higher or lower time frames (not less than 15min).
The other indicators which are part of the suite are shown on the website which is highlighted in my signature at the bottom of the page. Purchase of the main indicator gives access to the full suite of eight indicators. I use the other indicators to confirm the direction of the trade and to determine if I want to trade or not. I use it along with the 2min, 15min and 4hr timeframes to identify the best entry window and how long I'm likely to be in the trade.
Support can be provided via private message or in the comments below.
The links are provided below for access to the indicator.
RSI2 with alerts by Mr.TuanDoan for Binary OptionIdea was developed from Larry Connors RSI2.
The 2-period RSI strategy is a fairly simple mean-reversion trading strategy designed to buy or sell securities after a corrective period.
You should look for buying opportunities when 2-period RSI moves below Lower Band (5), which is considered deeply oversold. Conversely, you can look for short-selling opportunities when 2-period RSI moves above Upper Band (95).
This is a rather aggressive short-term strategy for Binary Option.
Best use with Stoch RSI x 2.
The settings for Stoch RSI are
- Slow: 3 3 14 14
- Fast: 3 3 5 5
Only consider a PUT/CALL when both Stoch RSI are in the same state (overbought/oversold).
When arrow appears on the candle, it likely reverse the current trend.
Note
This is not a holy-grail.
Please follow your risk management
Confirmations must be met before entering a trade
It's for Binary Option

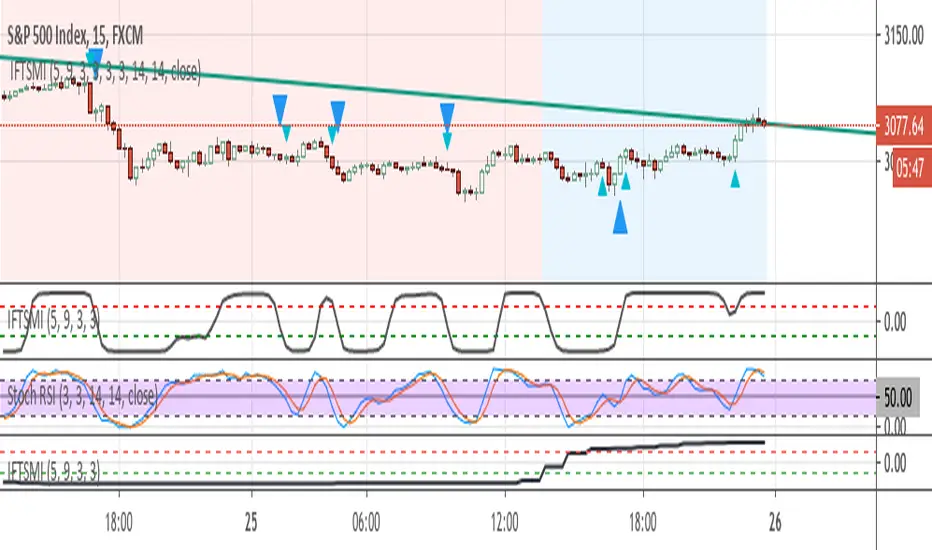
Inverse Fisher Transform of SMI and sto. RSI, MTF confirmedThe system uses 1 hour and 15 min timeframe data. Signals coming from 15 min Inverse Fisher Transform of SMI and stochastic RSI are confirmed by 1 hour Inverse Fisher Transform SMI, according to the following rules:
long cond.: 15 min IFTSMI crosses ABOVE -0.5 or SRSI k-line crosses ABOVE 50 while 1-hour IFTSMI is already ABOVE -0.5
short cond.:15 min IFTSMI crosses BELOW 0.5 or SRSI k-line crosses BELOW 50 while 1-hour IFTSMI is already BELOW 0.5
SMI and Inverse Fisher Transform of SMI codes belong to @kivancozbilgic.