Stochastic RSI Momentum TranformThis is my version of Stochastic RSI, but not the stochastic RSI alone, hell no, it's a lagging indicator, I don't like lagging indicators.
This is a leading indicator that has momentum calculations in it and not only that, it has a momentum shifting calculation based on modified ehler's transformation !
Simple for user, a hell to program !
Price and how to get access to ? contact me in PM !
Stochastique RSI (STOCH RSI)

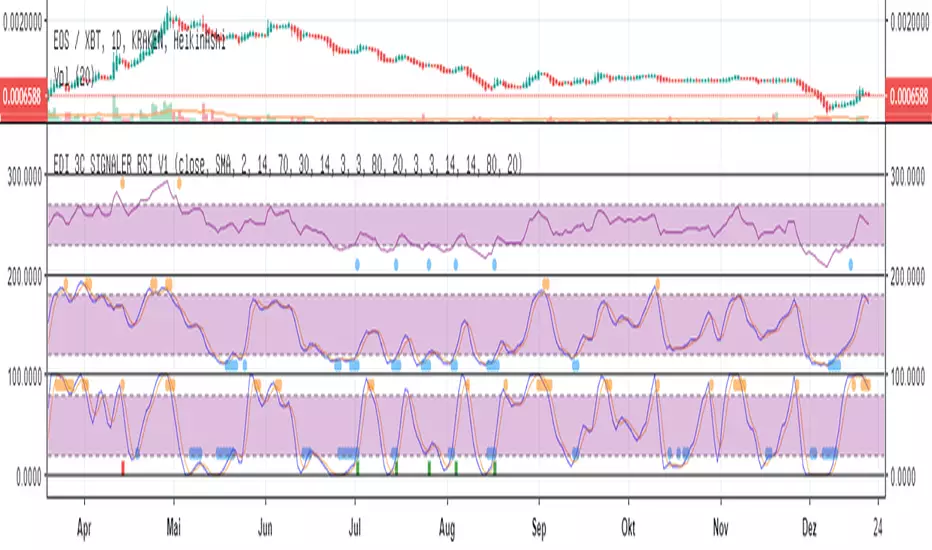
Eds Bot Signaler on Basis of RSI Stoch StochRSIEDS AWESOME BOT SIGNALER
Specially for use with e.g. 3commas or autoview
But can also be used just in normal manual (visual) mode
This Script is very early Beta. Works for visual manual use....
and also for 3Commas Bot as "Signaler" (how to connect with Bot, see the docu on 3commas).
... but can use as Signaler for any Bot who is able to get Tradingview sms-mails. (e.g. autoview)
It combines RSI, Stoch and Stoch-RSI.
You can choose normal RSI, or " returning RSI " (signals when leaving the sell/buy-zone. much higher profits with this)
You can choose how many of the indicators are needed to "fire".
You can choose if one of the indicators is a "must"
For Stoch & Stoch-RSI you can Choose sma or ema calculations of the moving average.
All the Values speak for themselves, if you are used to technical analyses (stay away in the moment, if you dont know, what rsi, stoch etc is used.
The Signals are also shown in the chart, the single ones, but also the combined which fires the Bot-Signal (shown as green and red column-candle at bottom)
Enjoy !! Free use in the moment.
More detailled Explanation in the future. Just play around!
If you wanna give something back:
BTC: 15buigKjh4JYnuVwcEWiYMpYvP3Lbp4ypL
RSI + STOCHRSI - combinedRSI + Stoch RSI combined script
Very usable for free accounts with indicator limits.
Use 2 indicators as 1

MBY_BTC_Long&ShortThis indicator based on 15Min Bitfinex BTC chart.
Can help you watching short/long position on your sheet.
이 인디케이터는 비트파이넥스 15분 봉 비트코인 차트가 기본이 됩니다.
수정하실 수 없습니다.
이 지표는 비트코인 롱/숏 포지션을 사용자의 차트에 표시해줍니다.
감사합니다.
사용을 희망하는 분은 관심과 좋아요 부탁드리겠습니다.


TTM Tsunami Multi Time Frame Stochastic RSITo The Moon's Apollo 11 program Stochastic RSI for leverage trading, scalping, or even trend trading with proper knowledge and settings.
Basic idea:
The indicator's histogram is the "K" Stochastic RSI signal from a higher time frame you define (1hr default) for overall trend indication. The Current time frame's K & D signals are shown as the solid lines. When the current time frame's K & D cross or lift off from the highest or lowest threshold, enter or exit a position; if leverage trading you can pyramid, or reverse your position. It may take a bit of time to get a feel for the proper entry & exit signals and is not a crystal ball, but this can help keep your trades in a trend longer for greater profits.

Stochastic Momentum Indexon indicators you can buy oversold when marked with a green cross. and selling overbought is marked with a red cross.

SITEKONG RSI + Stoch RSIon this indicator I combine 2 indicators, namely RSI and Stochastic. here I give yellow to RSI and Green and red to Stochastic. You can buy during oversold and sell during overbough.

Stochastic RSI Divergences for short term trades @D4NN1_0C34N
Altcoin / Bitcoin -0.38% Stoch RSI Overlay signals:
Bull divergence
Bear divergence
Hidden bull divergence
Hidden bear divergence
All divergence signals are under special circumstances.
Later versions might include additional parameters.
Find me on Twitter: @D4NN1_0C34N
our german website: cointrend.de
or youtube: www.youtube.de

StochRSI+StochRSI+ is a Stoch RSI study enhanced with some background highlights and flags to enhance the visual reading of standard oscillator.
Default Settings:
RSI: 13
Stoch RSI: 13
%K: 3
%D: 3
Oversold: 20
Extended Oversold: 7
Overbought: 80
Extended Overbought: 93
Activate Highlights and/or Flags for:
- Stoch RSI Oversold/Overbought. (Default: Active)
- Stoch RSI Extended Oversold/Overbought. (Default: Active)
- %K crosses %D. (Default: Inactive)
StochRSI + RSI + MACDStochasticRSI, RSI, and a MACD all in one.
StochRSI with an RSI overlay. Relatively, the Overbought and Oversold lines are set at 30.9 and 69.1, respectively
Down below, a Normalized MACD.
The MACD, in the settings, can be adjusted between Exponential(closest to normal MACD) or Smoothed (Less Noise).
Normalization can be adjusted as well.
Optionally, you can change the background color of the MACD area based on the direction the MACD line is heading.

Bitfinex Longs vs. Shorts RSILongs VS shorts RSI indicator.
You can chose length and source.
Uses BitFinex exchange to get long and short data.

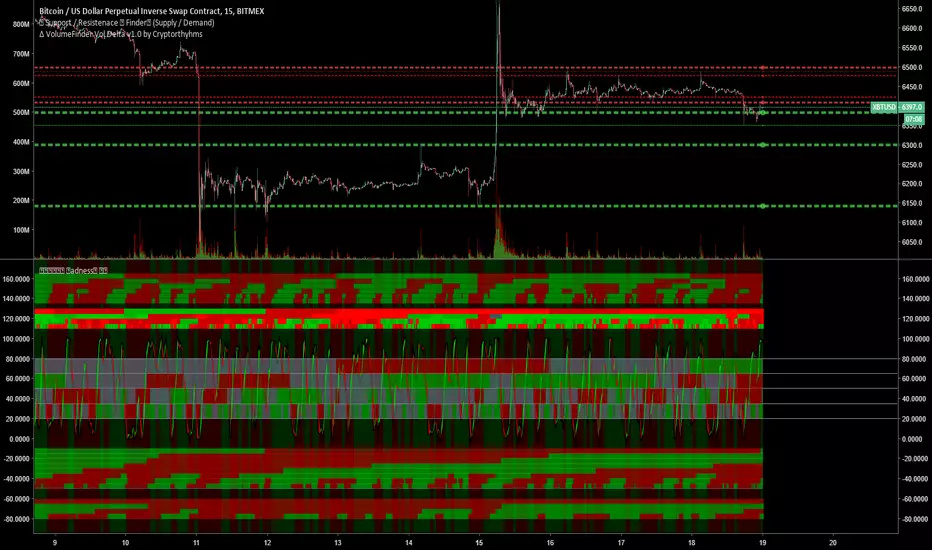
🕟𝕄🕗𝕋🕛𝔽 Madness MTF Grid by 🇨🇷🇾🇵🇹🇴🇷🇹🇭🇾🇭🇲🇸Here is a short description. This indicator being free will not have documentation for ALL things. Just the basics. There are 5 indicators included in it which I will not go into how each one works. There is ALOT of info on all the indicators included in here, just use google for that.
📊For each "row" of colored bands this represents one indicator. This is meant to be used on the 15m (or less) timeframe, and it looks up into higher TF's. It is meant to be maximized, so have this open in one tab and the chart on another. Dual Monitors are best. All options and Time frames are fully configurable inputs.
📈Indicators from top to bottom are:
1.)Polarity Filtration - 6 Timeframes
2.) Price Volume Trend - 4 Timeframes
3.) Stochastic RSI - 4 Timeframe Grid, and Current Timeframe in lines/ribbons
4.) MACD Crossovers - 8 Timeframes
5.)SuperTrend - 4 Timeframes
⏲Inside each larger "band" there are smaller rows. Each of these small rows represents one timeframe (30m, 60, 2h, 4h, etc) What timeframes you choose for them is completely configurable althought the current setup is already ideal to trade on 15m
⏲For these smaller rows the ones on top are highest timeframe(i.e. 4h) and the bottom small rows are lowest timeframe
⏲So each small row is like being able to check that indicator many timeframes at once. This will help you determine overall trends without switching to different timeframes on your chart all the time
📈The last piece of the puzzle is the background color. This background color is whether the chart is going up or down on the 1 hour heiken Ashi candle chart. Heiken ashi always shows up or down based on how they draw the candles, so its another useful trend indicator
👍If you enjoy MTF Madness all I ask in return is that you like the indicator and follow me on tradingview (profile here: www.tradingview.com)
❓If you have any questions, join us in the telegram chat in my signature!
Stochastics RSI && Money FlowIndicator overlaying Stochastics RSI (two levels away from price) and Money Flow (volume based indicator).
The indicator will print a dot when the 80 border is crossed from above - indicating a sell signal.
The indicator will print a dot when the 20 border is crossed from below - indicating a buy signal.
The signals should be used in alignment with the trend of the stock, currency or crypto.
Please let me know in case you have questions, you need improvements or other custom indicators.
Thanks
Patrick

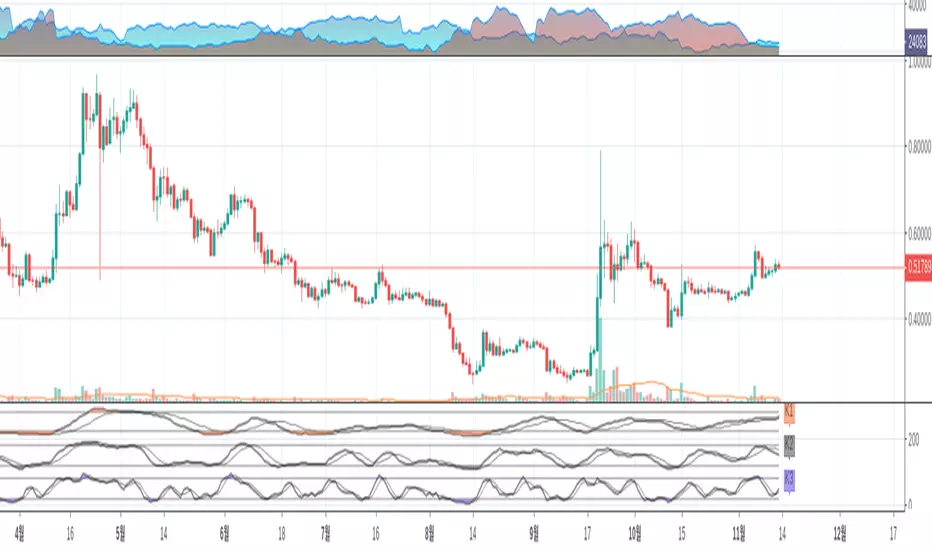
yutas_CCI+RCIS+StochRSI_ver.freever .free
CCI×3
RCI×3
StochRSI cross sign × 1
It can be used as a material to judge the flow by closing CCI , RCI -2.78% and StochRSI.
Three CCIs and three RCIs can be displayed.
With the time axis change function, you can check the flow on one screen.
It is easy to grasp the flow of the whole by watching the eye with one hour's feet etc.
Let's aim at when all directions are complete.
※There will be no upcoming updates as it will be a free public version.
CCIとRCIとStochRSIのクロスで流れを判断する材料に使えます。
CCIとRCIはそれぞれ3本表示可能。
時間軸変更機能により、1画面で流れを確認出来ます。
1時間足等を使って、目を細めて見ると全体の流れを掴みやすいです。
全ての向きが揃った時を狙いましょう。
※無料公開バージョンになりますので今後の更新はない予定です。

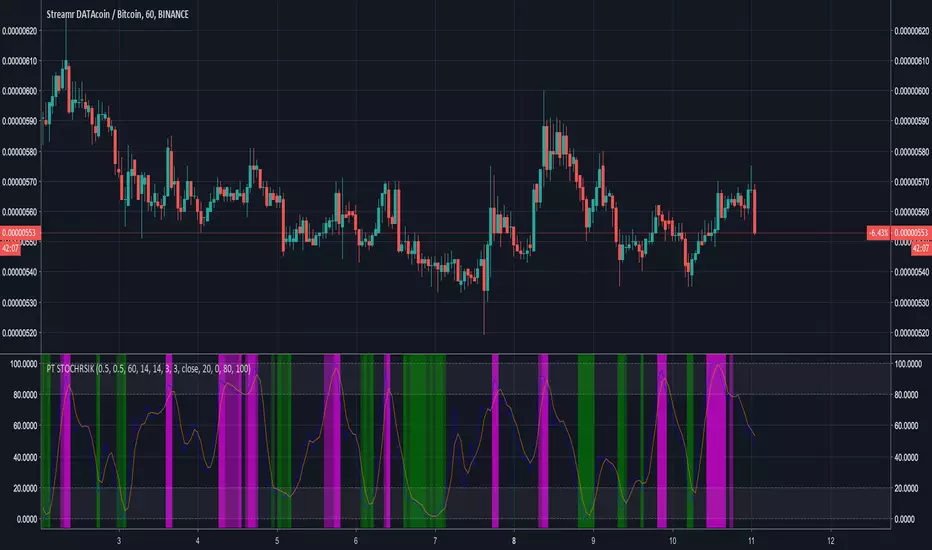
[ProfitTrailer] Stoch RSI K StudyProfitTrailer StochRSI K study for buy/sell strategies.
The script highlights the regions where buy/sell trailing is most likely to succeed.
[ProfitTrailer] Stoch RSI D studyProfitTrailer StochRSI D study for buy/sell strategies.
The script highlights the regions where buy/sell trailing is most likely to succeed.

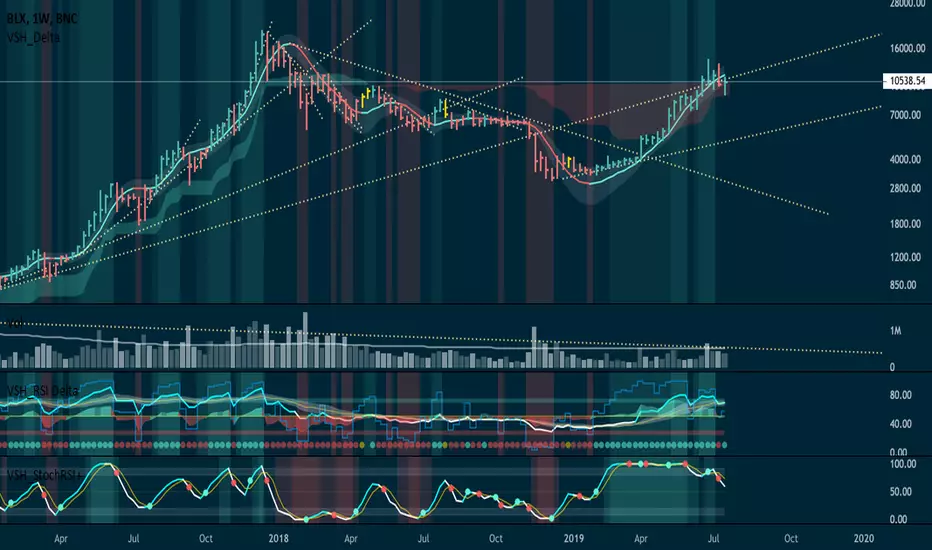
Ultimate Strength Index (USI),Stoch Multi Time Frame(MTF)[cI8DH]Ultimate Strength Index ( USI ) adds stochastic, multi time frame, signal line, histogram, and bar coloring options to RSI and Absolute Strength Index ( ASI ) . It can also turn into an indicator similar to Awesome Oscillator/MACD line. This indicator can be used for analyzing momentum and trendiness/choppiness, as well as identifying swings (stoch). The fix applied in True RSI is also applied here. Chart below shows example multi-TF setup with bar coloring.
For analyzing volume, I made a similar indicator based on money flow and accumulation/distribution, which you can find in the link below.
Aggregation Method
aggregation method = MA Percent => True RSI: momentum and divergence, failure swings
aggregation method = MA => Absolute Strength Index: accurate momentum and divergence
aggregation method = Cumulative => Awesome Oscillator alternative : momentum and divergence, twin peaks, ... (set the smoothing to 5 and signal length to 29ish)
Smoothing, signal line and histogram to detect trend and choppiness
You can apply additional smoothing to USI . Also, you can add a signal line and histogram (histogram is the difference between main line and signal line). To do so, set the signal length to a number greater than one. Signal line can help you detect changes in trend similar to the signal line on MACD. If signal line criss-crosses USI , it shows market is choppy. The worst case is when this criss-crossing coincides with USI flattening near neutral line and histogram height is relatively short; that means market is ded (until it is not; expansion following a contraction period is a common phenomena)! (Bear in mind that histogram will be hidden in stoch mode, and main and signal lines will be hidden in cumulative mode)
Stochastic
To enable stoch, change the stoch length to a number greater than 1 (default stoch length for the built-in RSI stoch is 14). This length should be calibrated depending on TF and asset. If done correctly, it can be a powerful tool for identifying swings. Stoch can be combined with any aggregation method. I recommend using stoch with MA aggregation (i.e. ASI ). For conventional uses of stochastic, please read www.tradingview.com(STOCH) and www.tradingview.com(STOCH_RSI).
Experimental Bar coloring Feature
There is an option to color bars depending on USI's position relative to the signal line. If both TFs are used in coloring and they are in disagreement, the TF with greater histogram height wins. There are two shades of green and red. The darker shade means both TFs agree. If you use the signal line, bar coloring can help with calibrating the indicator (play with parameters until you see a good looking chart i.e. a lot of green candles followed by a lot of red candles in a row). Please note that bar colors might change until candle(s) close(s). The bar coloring rules will most likely change in the future.
Notes
- Smooth MA length N = EMA length 2*N-1
- With correct settings, you can also create an alternative to normalized MACD line in the cumulative mode.
True RSI
Absolute Strength Index
Please give a like, and share the interesting configurations you find in the comments.

[ProfitTrailer] Stoch RSI studyProfitTrailer Stoch RSI study with buy/sell strategies.
The script highlights the regions where trailing is most likely to succeed.

[ProfitTrailer] Stoch RSI Cross StudyProfitTrailer StochRSI Cross study that supports all PT parameters for both buy/sell strategies.
The script highlights the regions where trailing is most likely to succeed.

RSI+RSI+ is an augmented version of standard Relative Strength Index (RSI) enhanced with a EMA cloud and some momentum background highlights.
Includes 7 Color Themes (4 dark, 3 light).

Merge Of RSI & Stochastic RSI [salar88]This Indicator Include Stochastic RSI And Multiple Time Frame RSI
I Wish Its gonna useful for tradingview users
