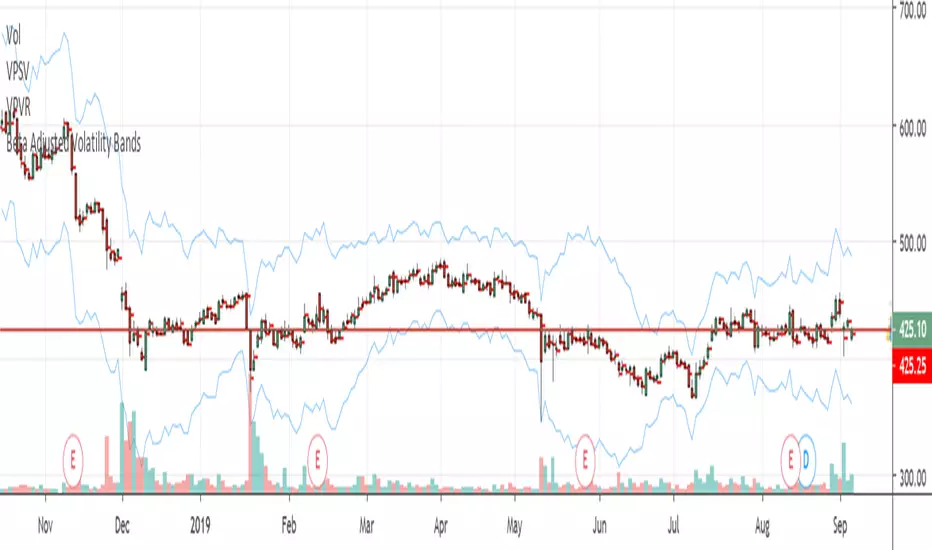
Beta Adjusted Volatility BandsBeat Adjusted Volatility Bands
Input Vix and Beat of the asset Sector.
Example:
Looking to sell options, Sell options beyond the bands.
Stocks
BOSS EMA Trend Meter PRO With Alerts BOSS PRO TRADING SYSTEM INDICATORS
Bullish Uptrend
To determine bullish uptrend there must beat least 2 green squares on all three trend meters. This is a great predictor that a uptrend is imminent. You can set alerts for top two meters being green as well as all 3 meters being green
Bearish Downtrend
To determine bearish downtrend there must beat least 2 red squares on all three trend meters. This is a great predictor that a downtrend is imminent. You can set alerts for top two meters being red as well as all 3 meters being red.
Purchase Here: bosscripts.com


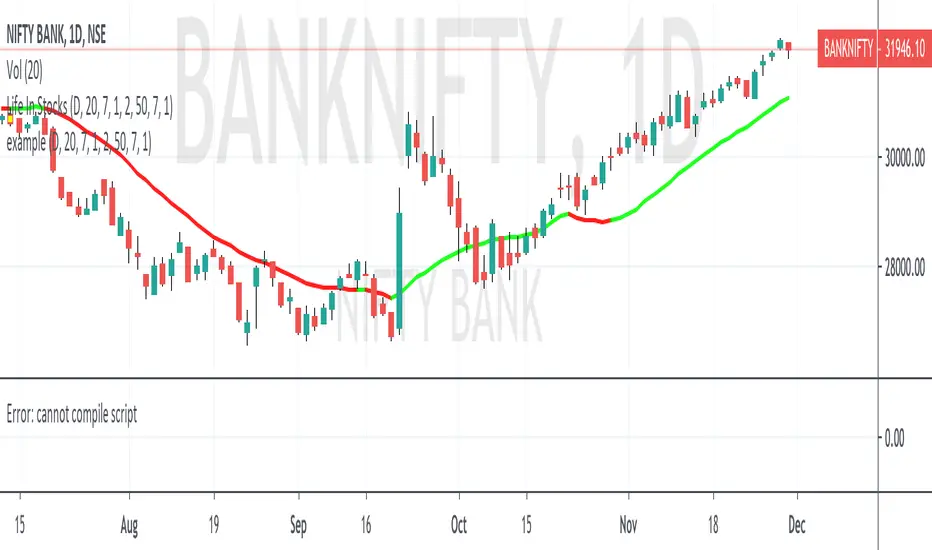
Life In Stocks20 moving average with buy and sell signal, Bullish engulfing, bersish engulfing and you will get the SR in all interval of time.
CoinStudio Signals Full (read the description)CoinStudio Signals Full displays long and short, as well as reasonable targets and allows to set custom alerts based on them.
Possible targets are flagged as "C" for the most previously occurred signal. These targets indicate chances to sell before an expected reversal.
If the signals switch from let's say Short to Long and there are no targets between them, it either means the signal failed or the target is falling together with a new signal.
CoinstudioSignals work for any asset (crypto, stocks, gold , silver , etc.) and work for every time-frame.
However, daily and 4hr usually give the best results.
To add this script, please send me a message and ask for an invite!

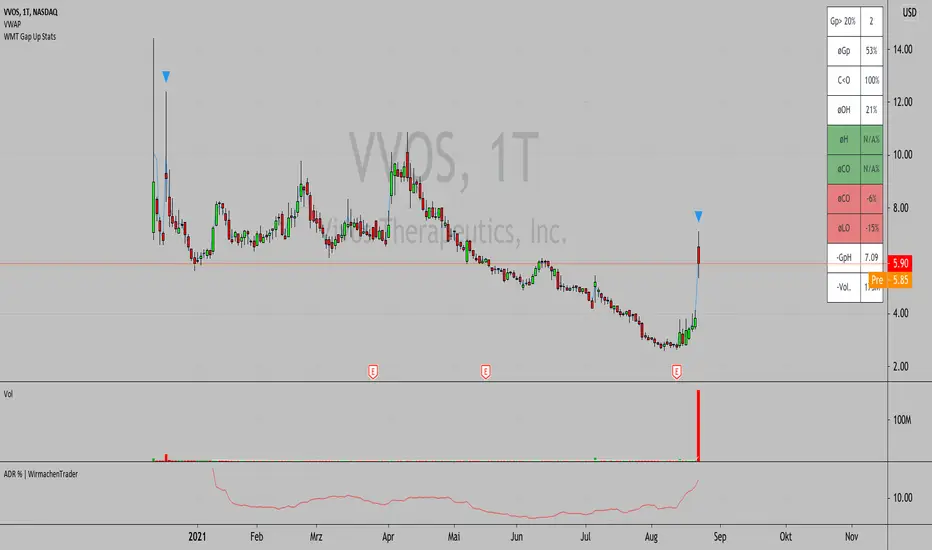
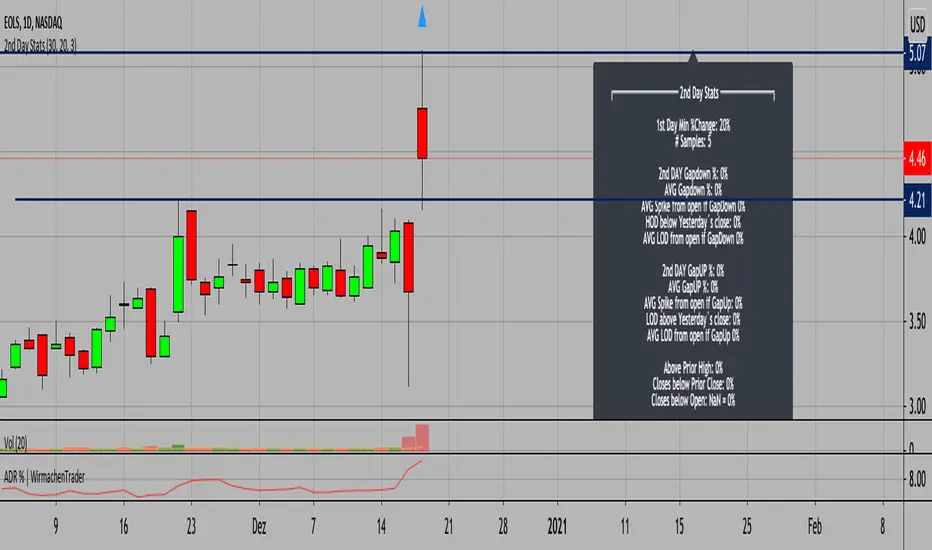
Gap Up Stats - Gap Strategie für Aktien! Was passiert eigentlich nach einem X% Gap? Diese Frage lässt sich nun einfach beantworten! Ändere die % und die Anzahl der Jahre, welche Du testen möchtest mit nur einem Klick. Die unterschiedlichen Werte zeigen Dir dann direkt, ob sich Deine Handelsthese mit den Statistiken der Aktie deckt.
In diesem Fall sehen wir, dass die Aktie über das letzte Jahr in allen Fällen unter dem Eröffnungspreis geschlossen hat. Der durchschnittliche Spike lag bei 16%. Damit ist ein Short die richtige Wahl und die potentiellen Level der Aktie können mit der Statistik vereint werden.
Bei Interesse ist dieses Skript bei uns erhältlich.
Viele Grüße
WirmachenTrader®
CS Signals Lite (read the description)CoinStudio Signals Lite displays long and short entries.
Additionally, the Full version supports custom alerts based on the signals.
To get access to the full version and alerts, please message me for an invite.
The signals work for any asset (crypto, stocks, gold , silver , etc.).
In principle, the signals work for every time-frame but depending on the asset some work better than others.
However, daily and 4hr usually give the best results.

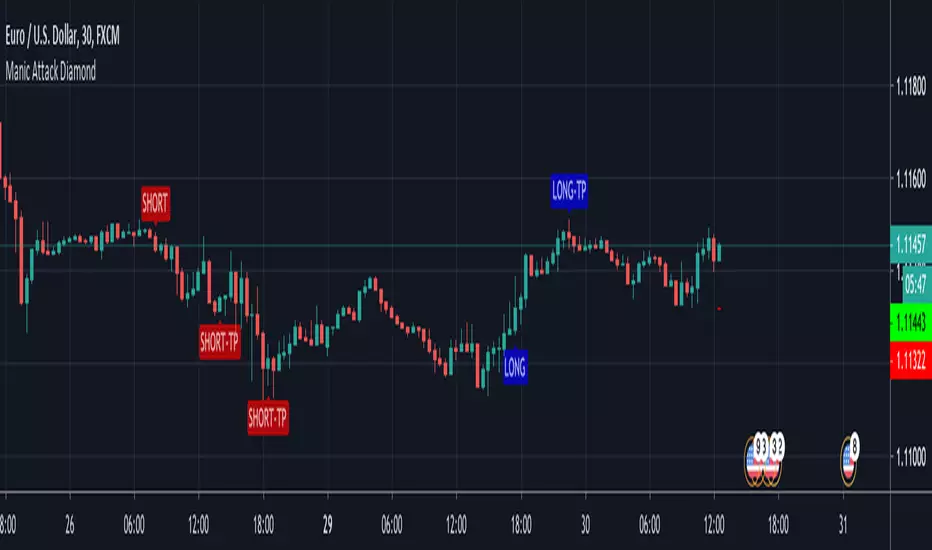
CS Signals Full (read the description)CoinStudio Signals Full displays long and short entries and allows to set custom alerts based on them.
The signals work for any asset (crypto, stocks, gold, silver, etc.).
In principle, the signals work for every time-frame but depending on the asset some work better than others.
However, daily and 4hr usually give the best results.
To enable this script, please head to our Discord and ask for an invite:
discord.gg

Bar RatioBar Ratio is an indicator tool that provides real-time likelihood of the current bar closing up or down (green or red).
Technical status, volatility and time are key elements in this indicator.
From the open of a bar, a ratio of 50% is assumed before changes from factors are considered.
The factors that change the likelihood of a bar closing up or down and their relative weight are listed below.
Micro-Trend observed over the last 20 bars - up to 2.5%
Macro-Trend observed over the last 70 bars - up to 2.5%
Current bar price against beginning of Micro-Trend - up to 2.5%
Combination of significant change above average volatility and move against direction of Micro-Trend - up to 2.5%
Combination of significant change above average volatility and move against direction of Macro-Trend - up to 2.5%
Previous bar direction up to 10 consecutive bars - up to 3.75%
Current status of bar (higher or lower) - up to 3.75%
Significance of change against average volatility - up to 5%
Time until bar close - up to 25%
Total: 100%
If all factors are synchronised, the likelihood of the bar closing up or down can be indicated at a probability of 100%.
While the practical ability for this to be used for trading is limited, the tool can be useful for choosing when it is safe to open a trade.
Time is a key element as the likelihood of the bar remaining at current status by the close of the bar is constantly increasing.
The accuracy of this tool is incredible and should be noted as it's primary trait.
You can find and use this indicator on any time-stamp or security such as Cryptocurrency, Forex, Stocks or Indices.
The Bar Ratio can be located by searching in your public indicator library at the top of your chart and adding it to your screen.

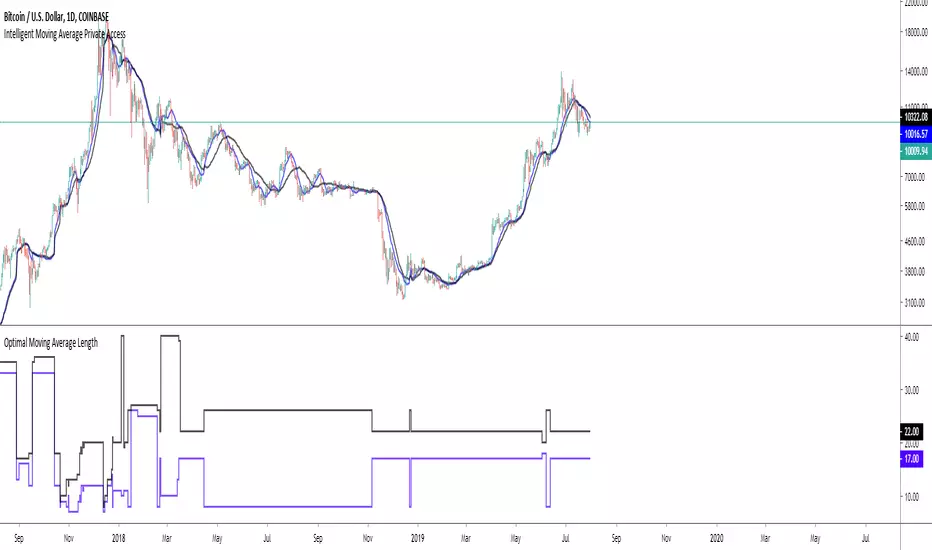
Intelligent Moving Average Private AccessNote: This indicator is intended for those who have been granted private access and may be more frequently updated than the previous versions.
Introduction
This indicator uses machine learning (Artificial Intelligence) to solve a real human problem.
The Moving Average is the most used indicator on the planet, yet no one really knows what pair of moving average lengths works best in combination with each other.
A reason for this is because no two moving averages are always going to be the best on every instrument, time-frame, and at any given point in time.
The " Intelligent Moving Average " solves the moving average problem by adapting the period length to match the most profitable combination of moving averages in real time.
How does the Intelligent Moving Average work?
The artificial intelligence that operates these moving average lengths was created by an algorithm that tests every single combination across the entire chart history of an instrument for maximum profitability in real-time.
No matter what happens, the combination of these moving averages will be the most profitable.
Can we learn from the Intelligent Moving Average?
There are many lessons to be learned from the Intelligent Moving Average. Most will come with time as it is still a new concept.
Adopting the usefulness of this AI will change how we perceive moving averages to work.
Limitations
Ultimately, there are no limiting factors within the range of combinations that has been programmed. The moving averages will operate normally, but may change lengths in unexpected ways - maybe it knows something we don't?
Thresholds
The range of moving average lengths is between 5 to 40.
Additional coverage resulted in TradingView server errors.
Future Updates!
This indicator will be maintained and many updates will come in the near future! Stay tuned.
View the documentation on this indicator here: www.kenzing.com
2nd Day Stats / BACKTESTING TOOL//English version below
## Deutsche Version
Was passiert am 2. Tag, nachdem wir X % am ersten Tag zurückgelegt haben? Genau dies lässt sich sehr gut backtesten und die Erkenntnisse im Markt anwenden. Dieses Tool eignet sich besonders für kleinere Aktien (Small-Caps) oder Aktien, die am Tag der Quartalszahlen große Bewegungen zurückgelegt haben. Backtesting war selten so einfach.
## English version
What happens after a strong day 1 move? Use the custom input to test, what happened after a 10% move on day one. Change the day 1 move % and the number of years to backtest. It's that simple. The tool is especially helpful for small-cap traders and for stocks after earnings.
Mega Trend Plus - S&P 500 Trend Follower / Market GaugeFirstly, 100% of the credit goes to Greg Morris @ Stockcharts.com for the article detailing the concept and most of the settings/components. I've simply implemented his idea. I haven't sought permission from him, but given that he was open with the components of the indicator I'm assuming he's happy for me to go ahead and code this in pinescript. See the article here: stockcharts.com
Okay, so this is part of a system/indicator Greg outlined in the article that he calls Trend Gauge. The idea is fairly simple: take a group of indexes that cover the breadth of the market you want to trade, track their relationship/position to their 200 period Exponential Moving Average (EMA), and assign scores to bull/bear crosses + relative location to the EMA. Once you've normalized and aggregated the scores you finish up with a trend following indicator that works surprisingly well.
This part is called Mega Trend Plus, and tracks whether an index is above or below its 200 period EMA. I'll be releasing the second part ("Trend Strength") soon. Once that's done I'll combine them to form the full "Trend Gauge" indicator.
I decided to provide the base version that people can then experiment with and tweak to their liking, so Greg's version shown in the article is smoother than the one provided here. It's up to you to play with smoothing options, and potentially tweak the weightings of the various components. Please see the script for info on what the various inputs are - I've added notes there.
So, how does it do? Well, as you can see from the chart above it works pretty well overall. The S&P 500 has been fairly trendy over the last few decades, so it's been prime territory for a system like this. It would have kept you out of the big bear markets (particularly GFC & 2015-16), and that's the goal of any trend-based system. They thrive on how little they lose, not necessarily on how much they make.
As you can see, the indicator is pretty choppy. So it's not designed (in the current configuration) to provide accurate buy/hold/sell signals. It currently functions more as a market gauge / strength indicator.
Hopefully you find this concept interesting. It's simple, but the best systems often are.
Please add comments below if you come up with an interesting configuration or variation.
Let me know if you have any queries.
DD

BB - Study - CryptoFoudid.comHi everyone,
A new script transformed on a study from QuantNomad.
Based on the Bollinger Bands to catch the range market.
I filtered the consecutive signals to avoid a "funding" issue.
You can configure it as you want based on inputs.
The best way for crypto is to have about 45 to 55 length and 2 to 3.5 in multiplier but it's your choice :)
ENJOY !

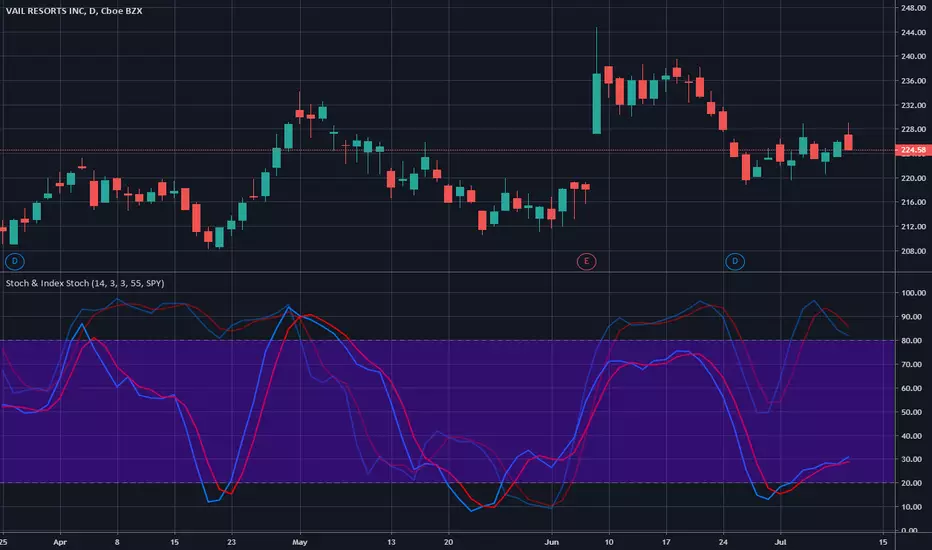
Stochastic & Index StochasticUsing this indicator you will be able to use the standard stochastic of a stock ticker as well as the stochastic of a stock market index simultaneously and without changing charts - both stochastics combined in only one indicator.
The stock market index stochastic can be changed in the indicator settings and is displayed with higher transparency. The degree of transparency and default color settings can also be adjusted.
For special analysis purposes, it is possible to display only the stochastic of the selected stock ticker or only the stochastic of the selected stock market index.
If you would like to test or use this indicator please drop me a line and send a request for it.
Dollar Cost Average [lorencip]This indicator shows the return of a dollar cost average strategy.
The 4 values in the output are:
the amount of the investment
the number of items purchased for that symbol
the total value of the items purchased
the result of the investment in percentage
This first version works with cryptocurrencies and currencies, it's not accurate for stocks (it "purchases" decimals of a share/stock).
Lorenzo Cipriani

PpSignal Spread Between Stock and Reference Index ALARM
this is the overlay PpSignal Spread Between Stock and Reference Index...

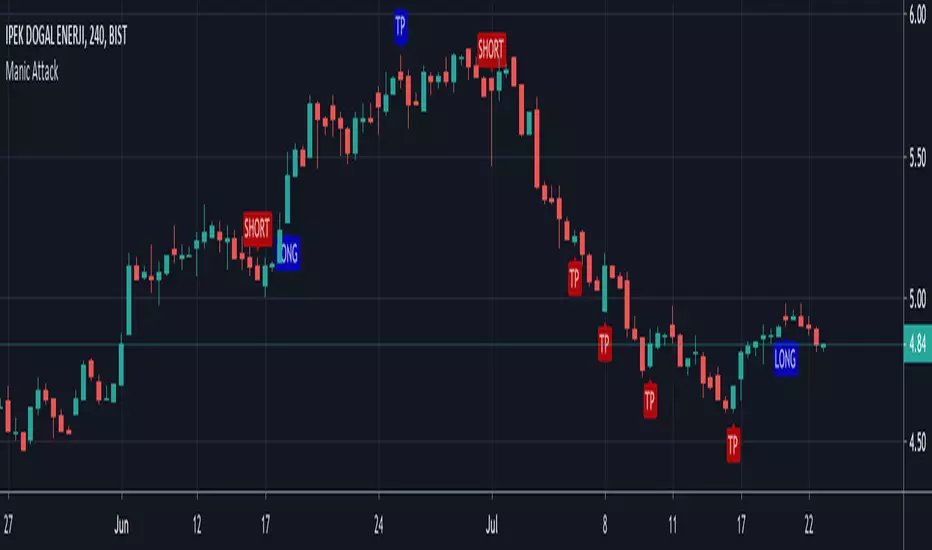
[HTI] Hiubris Trend Indicator 1.4Hiubris Trend Indicator is super easy to use.
The Indicator includes Long and Short signals on chart, based on the current Trend direction - These signals can be also set up as Alerts.
It also includes multiple partial Exit Points (Take Profits) that can be used to lock in the profit you have made - These signals can be also set up as Alerts.
The Take Profits have a custom input that can be adjusted by the user regarding the frequency of the take profits - (The risk involved in each trade)
The indicator has a special Stop Loss feature that activates after a certain custom number of Take Profit points passed, locking down your profits you have made so far - These signals can be also set up as Alerts.
Hiubris Trend Indicator is very profitable on higher timeframes (45min, 2h, 4h) - It can also be used on lower timeframes, together with another HigherTimeframe Trend indicator, acting as a filter for the alerts (Ex: Hiubris Long Term Trend)

PpSignal twiggs_money_flowTwiggs Money Flow is my own derivation, based on the popular Chaikin Money Flow indicator, which is in turn derived from the Accumulation Distribution line. We are all indebted to Marc Chaikin and Larry Williams for the contribution they have made to the field of technical analysis and price-volume oscillators.
for more information visite: www.incrediblecharts.com

PpSignal Variable Move Average V 3.0VMA V 3 www.prorealcode.com
Variable Moving Average (VMA) ... Longer-term moving averages are slow to react to reversals in trend when prices move up and down over a long period of time. A Variable Moving Average regulates its sensitivity and lets it function better in any market conditions by using automatic regulation of the smoothing constant.

BOSS Bullish/Bearish Quantitative Qualitative Estimation (QQE)THE BEST FOREX, BINARY OPTIONS, AND CRYPTO INDICATORS FOR TRADINGVIEW.COM
This indicator is comprised by a smoothed Relative Strength Index and two trailing levels, based on volatility – Fast Trailing Level (Fast TL – the maroon line on the chart above) and Slow Trailing Level (Slow TL – the blue line on the chart above).
The two are determined by calculating the Average True Range (ATR) of the smoothed RSI during a specified number of periods, after which a further ATR smoothing is applied with the use of an additional n-periods Wilders smoothing function.
Ultimately, the RSI’s smoothed ATR is multiplied by the Fast and Slow ATR Multipliers in order to determine the final Fast and Slow Trailing Levels.
Trading the QQE buy and sell signals:
Buy Signal
Bullish crossover happens when Fast ATR TL crosses above Slow ATR TL. When this occurs a blue circle & blue candle will appear and a alert signal to buy is generated.
Sell Signal
Bearish crossover happens when Slow ATR TL crosses above Fast ATR TL. When this occurs a maroon circle & maroon candle will appear and a alert signal to sell is generated.
Bullish/Bearish Divergence Background
Green background indicates Bullish Divergence
Red background indicates Bearish Divergence
Overbought and Oversold Conditions
An overbought condition occurs, when the QQE is at or above its 0.10 level.
An oversold condition occurs, when the QQE is at or below its -.10 level.
