Drawdown strategy indicatorThis indicator uses drawdown and max drawdown to determine good areas to enter or exit the market.
It uses the ratio between those values and two thresholds provided by the user: top and bottom.
These two values will be used to highlight the areas that match the users strategy criteria.
I normally use this indicator on the 4h or higher timeframes.
On BTC using the default parameters it predicts the tops pretty nicely. The areas of accumulation or buy zones are consistent with the ones that follow each halving.
The chart shows:
- Drawdown
- max drawdown
- drawdown average
- drawdown ratio
- buy and sell zones
The study includes alerts for both buy and sell zones.
Strategy!

Strangle MoverStrangle Mover is an indicator especially made for option writer / seller who wants to do strangle and adjust the position based on the market trend / movement. It can be use for iron condor strategy too.
Settings: User must know the settings of the indicator before using .
First one is Option Strike Difference , user need to enter the correct option strike difference of the particular instrument / stock / indices, one can get it from option chain. For example, Nifty having 50 points differences in each option strike and bank nifty having 100 points. So, Nifty user must enter 50 and Bank nifty user must enter 100 in this setting.
Second is strangle distance multiply , user can choose the distance from the trend price. For example, nifty user selects 3, strangle line starts showing (3*50) 150 points away strike from the trend area.
Third is Length, default value is 20 which generally used in vwma, donchian channel and other trend finding indicators. User can change if need.
Note: Option Strike Difference and Strangle Distance Multiply is very important setting to use this indicator.
User must do adjustments based on their own risk and strategy. This indicator is only for education purpose.

[FN] Strategy - Store Level on ConditionThis is a function that you can use in strategies. Not a strategy in and of itself.
Example thumbnail is showing the function applied to a strategy.
Oftentimes, I am asked a question regarding how to hold a variable at a specific, constant level over a conditional period of time. This question is always asked in a very long convoluted way like "I want the strategy to know what the high of the last pivot was while I'm in a long." or some other variation of wanting a script to remember something from prior bars.
This function is designed to store a price or some numeric level on the bar that your conditional (bool) statements determine that it should be stored. In this construct, you would set conditional statement(s) to flip the 'hold condition' to be true on the next bar, then hold that value until either the "hold condition" is no longer true or the initial conditions trigger again, causing an update to the level that you want to capture.
You still have to come up with the logic for the start condition and hold condition on your own, but I've provided an example that should give you an idea of how to accomplish this and customize/deploy the function for your purposes.
The function will return 'na' when neither the start condition nor hold condition are true. There's multiple ways to implement this and variations on how the level is chosen. I've written extensive notes in the script to guide you through the logic behind the function. My hope is that it will be useful to those trying to build strategies or anyone attempting to get their script to remember a level under given conditions.
In the thumbnail example, the take profit level is defined at the beginning of the trade and held until the take profit order executes. The order execution is a separate matter. However, storing the take-profit level at a static value is key to telling the strategy.exit() function what price to execute a limit exit order at.
Example: strategy.exit("Exit Long", from_entry = "long", qty_percent = 100, limit = stored_value)
Let me know how it works out for you and if I can be of any assistance.
Note: Strategy results are mainly derived from the fact that the strategy is long-only, the NQ only goes up, and there is no stop loss in place. So don't ask for the specific strategy, because unless you're trading a single contract with a $500,000 account, you'll probably get liquidated using this strategy as it is presented.

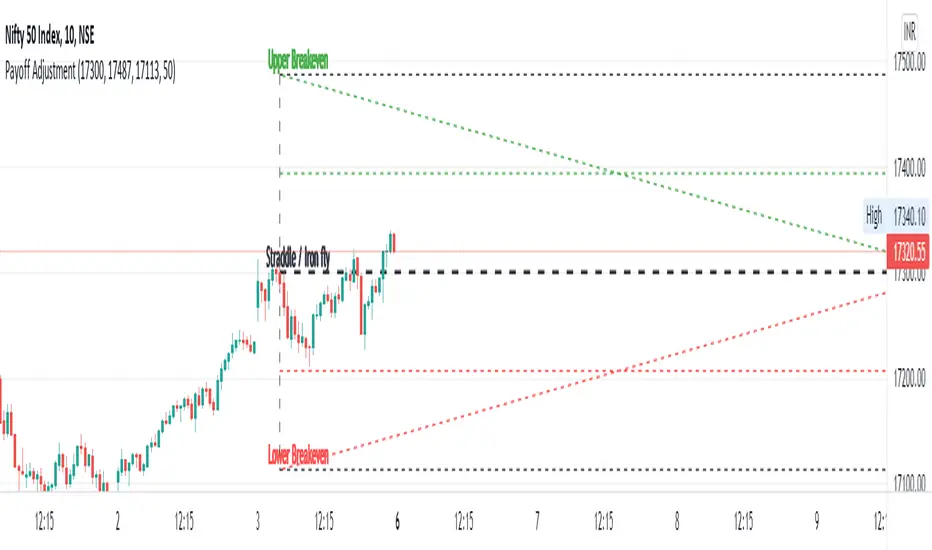
Straddle / Ironfly AdjustmentStraddle / Iron fly Adjustment is an indicator to assist (especially) Nifty / Bank Nifty Option Writers / Sellers (other instrument writers also) to draw their straddle / iron fly payoff diagram in the chart, mainly max profit and breakeven points and do adjustment based on the market movement.
Basic Idea: (My Conclusion for making this Indicator)
1) For Straddle / Iron fly writers need to adjust their position based on the market movement.
2) Here I give two adjustment ideas which one is my favorite method and another one is one of my friends is using.
a) Price Vs Time based Adjustment
I usually wait until price cross the price vs time line to do any adjustment. Generally, price vs time-based adjustment gives you more point to enter any adjustment in initial day/time when you created the straddle / iron fly. But one later it will reduce the range it become narrow.
b) Percentage based Adjustment
This method using by one of my friends which is based percentage between straddle / iron fly line and upper / lower breakeven points. Generally, he using 50 percentage. In this indicator we do have option to change the percentage between 25 to 100.
User must give inputs to see the straddle / iron fly diagram (Max Profit, Breakeven points, Adjustment, Percentage based adjust line and so)
This is not an intraday indicator and also its not suggesting you to take any buy/sell or straddle/iron fly positions. Its just giving an opportunity to draw a payoff diagram of for max profit and breakeven zone. And also helps to identify the adjustment based given scenario.
Happy Trading 😊
Saravanan Ragavan
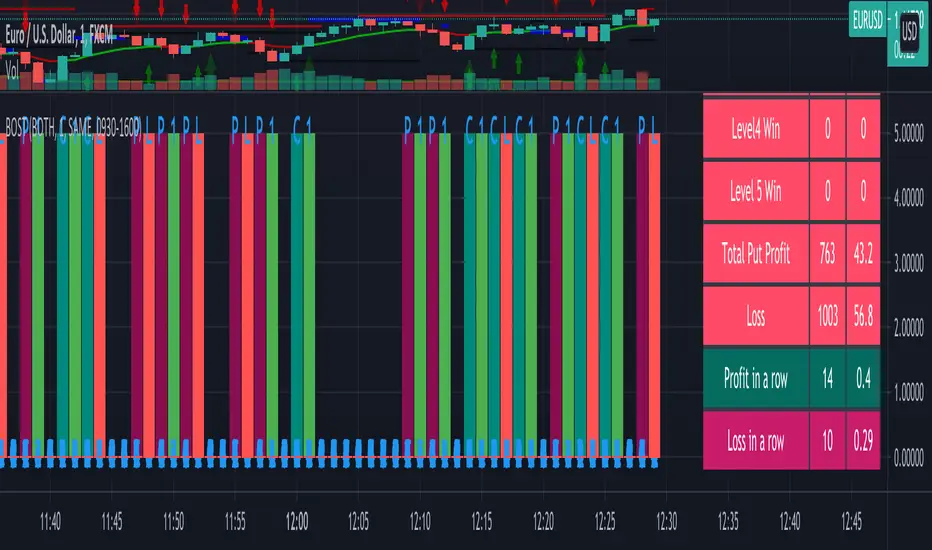
Binary Option Strategy Tester with MartingaleIn Binary options, strategy testing is a bit different. The script is just a try to test Binary options strategies.
Assumption:
We are opening position at next candle after signal come
We are taking the position at opening price
Our call will be profitable if we get a green candle and put will be profitable if we get a red candle
We can open only one trade at a time. So if we are in trade, subsequent signals will be ignored.
The script is not counting your profit or loss, it just counting the winning and losing trades.
Input Options:
Choose long only or short only test. Default is both.
You can continue your trade with Martingale Level, up to 5. Default is 1 (no Martingale)
You can choose Martingale trade type
SAME: if call subsequent trade will be call only and vice versa
OPPOSITE: if call subsequent trade will be put
FOLLOW CANDLE COLOR: Subsequent trade will follow previous candle color
OPPOSITE CANDLE COLOR: Subsequent trade will opposite of previous candle color
You can choose trading session to test. Default is false.
The strategy is taken from Vdub Binary Options SniperVX v1 (by @vdubus) . I have deleted extra parts and kept only the necessary part.
Without Martingale
Result Table
With Martingale
I am very new to Pine script, so waiting for your comments and review.
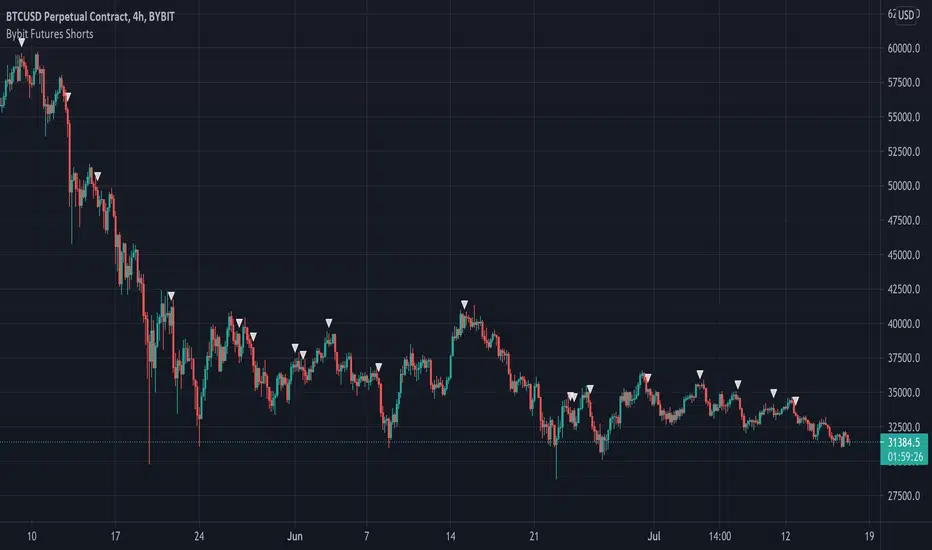
Bybit Futures ShortsThe whales love to short! This indicator emulates a strategy used by institutions to find short entries. It is designed for use on the Bybit exchange 4hr futures contracts but can be used on any timeframe on any Bybit contract. This is a great way to short with the whales. Please note this only works with Bybit.
Below is an example on 4hr chart:
Below is an example on 1hr chart:
Below is an example on Daily chart:
Good Luck!
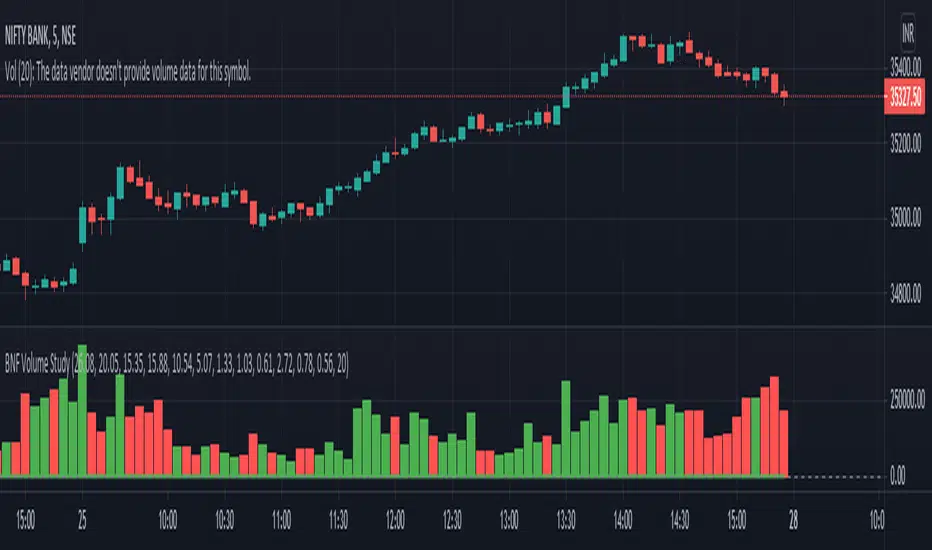
Trade Vertex - Bank Nifty Volume IndicatorNSE:BANKNIFTY
We all know that the value of an Bank Nifty is derived from top banking sector underlying stocks.
The value of Bank Nifty is calculated from free float market capitalization.
Using the same formula, I made an indicator on the bases of weighted volume of each stock.
This indicator will help you to plot Volume on Bank Nifty.
Tolueno StrategyTolueno Strategy is a help tool for the average trader of tradingview. This tool facilitates the interpretation of entries either long or short.
The use of magic trend has been implemented, in addition to different types of ema and fully configurable signals.
Soon the use of more sophisticated support and resist will be added to be used for inputs and outputs. RR will be improved too.
The tool has alerts
The tool has a dashboard that shows current signal (LONG / SHORT), shows a recommended take profit (not mandatory), recommended stop loss (not mandatory) and the profit that the current operation is achieving, all this to help the trader and his emotions do not harm him.
The tool is constantly updated and will be gradually improved over time with feedback from tradingview users.
Any questions ask in the comment box or by pm.
This indicator is not for sale, it is not a commercial publication.

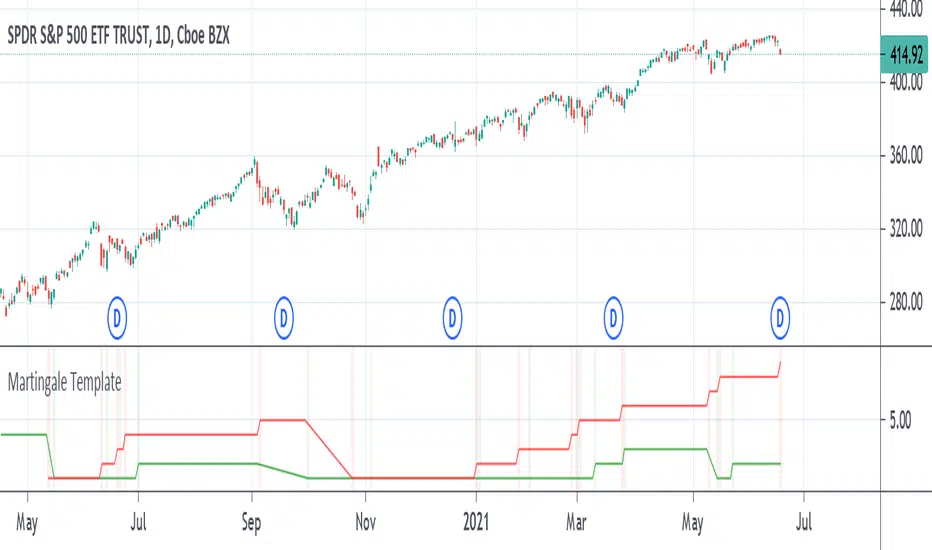
Martingale TemplateA template example on how to apply the famous Martingale gambling strategy. When your strategy gets an exit signal for your long position that leaves you without profit, you re-enter on the next entry long condition with double the capital of the previous amount entered with. You keep doubling the amount of capital entered with until you finally exit with a profit. If the strategy isn't sound enough then it could take several attempts and it can take only as much as a dozen tries to eat away at all your capital as the capital required to double on the next entry increases greatly over time by consecutive products of 2.
The strategy used is just a simple moving average crossover, above the moving average is going long, below the moving average is going short. It can be replaced with whatever strategy that you want. The colored vertical bars show long and short positions and exits. The default option on the tick box under the settings show the number of attempts at entering before finally exiting with a profit, the other option shows the amount of capital it took starting from 1.
Consecutive Color Reversal for Binary Option TradingThis indicator is only for Binary Option trading. It alerts when a specific number of consecutive same color candlesticks are generated and it signals for a reversal. As an example, when it signals "Long", a long trade should be opened for a few of next candlesticks (upto 2 to 3 candles).

[francrypto® strategy] 4 EMAs, P.SAR & Vol.Prof. (by kv4coins)(ENG)
This script consists of my own strategy for cryptocurrency (but can be adapted very well for stocks, forex, etc.)
Is a combination of:
- Four Exponentials Moving Average (EMA), configurables: by defect are 10, 21, 55 and 200 periods in yellow, aqua, orange and blue each of them
- Parabolic SAR System (PSAR), configurable
- Volume Profile (that has been developed by kv4coins - he has already authorized me to use it under the same OSS Licence Terms: MPL 2.0), configurable: with another default values and bilingual support for Spanish (SPA)
How it works
1) It is always better to detect specifics candlesticks or patrons: doji , pinbar or inverted pinbar , engulfing bars , morning star or evening star , harami , twizzer bottom or top , etc.
2) The 10 and 21 periods EMA help to identify the short-term behavior
3) The 55 periods EMA can be used like a support or resistance in medium-term, as 200 periods EMA in very long-term
4) It will convenient search for a double cross (10 & 21) or a triple cross (10, 21 & 55) to determine the medium-term change Downtrend to UpTrend (or viceversa)
5) Confirm the change patron with the Parabolic SAR and then identify potencials purchases or sales
6) Use Volume profile to detect potential supports or resistances areas, in order to set stop limit/loss and take profit orders.
Hope this helps!
Cheers,
FRANCRYPTO®
–––––– 0 ––––––
(ESP)
Este script consiste en mi propia estrategia para criptomonedas (pero puede adaptarse muy bien para acciones, forex, etc.)
Es la combinación de:
1) Cuatro Medias Móviles Exponenciales (EMA), configurables: por defecto son de 10, 21, 55 y 200 períodos en amarillo, turquesa, naranja y azul cada una de ellas
2) Sistema Parabolic SAR (PSAR), configurable
3) Perfil de Volumen (que fuera desarrollado por kv4coins - que ya me ha autorizado a su uso bajo las mismas condiciones de la Licencia OSS: MPL 2.0), configurable: con otros valores por defecto y soporte bilingüe para Español (SPA)
Cómo funciona
1) Siempre va a resultar mejor detectar velas japonesas específicas o patrones: doji , martillos o martillos invertidos , velas envolventes , patrón amanecer o atardecer , harami , velas gemelas , etcétera
2) La EMA de 10 y 21 períodos ayudan a identificar el comportamiento de corto plazo
3) La EMA de 55 períodos puede ser usada como un soporte o resistencia de mediano plazo, como así también, la EMA de 200 períodos en el muy largo plazo
4) Será conveniente buscar un doble cruce (10 & 21) o un triple cruce (10, 21 & 55) para determinar un cambio de la tendencia de mediano plazo de bajista hacia alcista (o viceversa)
5) Confirmá el patrón de cambio con la Parabólica de SAR y entonces identificá potenciales compras o ventas
6) Usá el perfil de volumen para detectar las potenciales zonas de soporte o resistencia, principalmente para establecer ordenes stop limit/loss o take profit.
¡Espero que pueda serles de utilidad!
Saludos,
FRANCRYPTO®

MechaOscillatorWhat is MechaOscillator?
MechaOscillator was created as a companion to our main script MechaAlgo. Using MechaOscillator along with MechaAlgo will allow you to boost your overall understanding of any market, and make more informed decisions as a trader.
Feature List
Built-In Improved WaveTrend Oscillator
Buy & Sell Signals
Bullish and Bearish Divergences
Short and Long Term Trend Indicators
Trend Strength Indicator
Market State Indicator
Real Time Informational Dashboard
Bullish and Bearish Breakout Indicator
Many More Features to Come!
By using this script you acknowledge that MechaOscillator cannot guarantee you profit, and that this product was only created in attempt to benefit traders. You also acknowledge that past performance is not indicative of future results, and that the experience of other users or what you see online may not always be your experience.

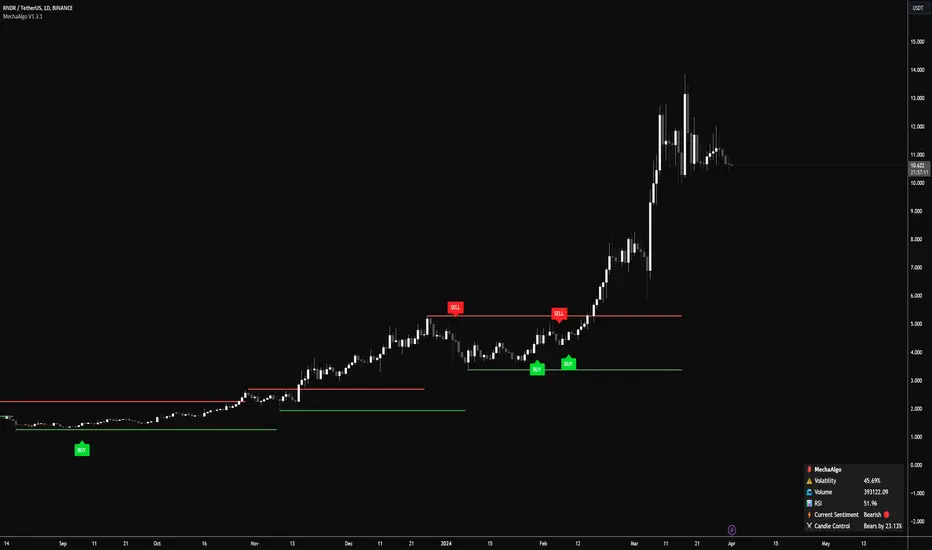
MechaAlgoWhat is MechaAlgo?
MechaAlgo was created to assist any type of trader on a day to day basis. Our intelligent and accurate algorithms turn complex charts into profitable plays, minimizing losses and maximizing profits. We hope that you will find use in the tools and resources we provide, and we will continue to improve on our products in order to take your trading to new heights!
Any Time, Any Market
Our indicators work with real time data on any market. This means that any kind of trader will find our tools useful, regardless of what you are trading.
Feature List
Multiple Signal Modes
Numerous Candle Coloring Modes
Reversal Cloud Overlay
Auto Support & Resistance
Auto Trendlines
Auto Profit Targets
Real Time Informational Dashboard
Multi-Timeframe Trend Panel
Future Trend Projection
Many More Features to Come!
By using this script you acknowledge that MechaAlgo cannot guarantee you profit, and that this product was only created in attempt to benefit traders. You also acknowledge that past performance is not indicative of future results, and that the experience of other users or what you see online may not always be your experience.
[Sidders] MACDEMASAR IndicatorCame across a cool idea for a strategy that couldn't find in the indicator database, so decided to code it up myself for your pleasure.
Indicators consists of 3 indicators: EMA(200) to determine the overall trend, and the MACD & Parabolic SAR to determine entries (and exits).
Long entry contains 4 conditions and is generated when price is above the 200EMA (1), the MACD crosses above the signal line (2), while they are both below 0 line (3) and when the parabolic SAR is below the closing price of the bar (4).
Short entry is build up the same but in reverse: price is below the 200EMA(1), signal line crosses below the MACD line (2), while they are both above the 0 line (3) and when the parabolic SAR is above the closing price of the bar (4).
Place the stoploss on the parabolic SAR dot below/above the candle that created the signal. Profit target 1:1 risk:reward ratio, but can ofcourse be changed according to your risk apetite. Might add automatically drawn SL/TPs in a later update.
Concept behind the strategy should work on all timeframes, but will require proper backtesting. I think with additional filters the strategy can also be way more finetuned and profitable, personally haven't had the time yet to dive into that.
Have also added alerts for your convenience.
Enjoy!

Intrangle - Straddle / StrangleIntrangle is an indicator to assist Nifty / Bank Nifty Option Writers / Sellers to identify the PE / CE legs to Sell for Straddle and Strangle positions for Intraday.
Basic Idea : (My Conclusion for making this Indicator)
1) Last 10 Years data says Nifty / Bank Nifty More than 66% of times Index are sideways or rangebound (within 1% day) .
2) Mostly, First one hour high and low working as good support and resistance.
Once First one hour complete, this indicator will show Strangle High (CE), Strangle Low (PE) and Straddle (CE/PE).
Straddle:
If you want to do straddle strategy, sell at the money strike (CE/PE) when price comes near to the straddle line (black line),
Strangle:
If you want to do Strangle strategy, sell Strangle High (CE) and Strangle Low (PE) when price comes near to the straddle line (black line). Both Strangle High and Low will be out of the money when price near to the straddle line (black line).
Adjustment: option adjustment to be done based on the price movement. Adjustment purely up to the user / trader.
Note1: If price not comes to near straddle line after first hour, better to stay light…
Note2: If first hour not giving wide High / Low, don’t use strangle strike based on this indicator. Straddle can be done any day with require adjustment / hedge. This Indicator is purely for education purpose, user / trader has to be back-tested before their start using it.
This indicator will work in Nifty / Bank Nifty only. Best Time frames are 3/5/15 Mins. This is purely made for Intraday
Happy Trading 😊

Triple EMA Cross with Pivot PointsYou can change various options from the settings, a few things to bear in mind:
Always make sure the EMA timeframe is larger than the chart timeframe for it to be usable.
The timeframe for Pivot Points is still playing up so I'll be looking into that soon!
This indicator doesn't always work, use it in conjunction with other indicators to manage your risk
Trading Strategy
TEMA 2 & 16 Cross
Long Entry
TEMA cross & Higher Low
Close Long
TEMA cross
Short Entry
TEMA cross and Lower High
Close Short
TEMA cross

MATR 4H Strategy - UpTradingEN // MATR 4H Strategy - UpTradin
Use 1:
This script is effective for all assets. Find out how to get the best performance. This indicator offers several possibilities:
- Only in TimeFrame 4H.
- The gray curve shows you the trend. You should not trade against it.
- Once the trend is established you can buy or sell according to the Buy and Sell sign.
- When the orange point (warning) appears you must remain attentive to a continuation of the movement or a reversal.
Use 2:
You can program limit orders using the green or red stripe. These are two bands that anticipate the high or low point of the price.
Legend:
- The gray line is an Ema 20 based on a Daily TimeFrame.
- The orange point means a continuation or a reversal.
- Buy means a buy zone.
- Sell means a sales area.
- The green curve allows you to program a limit order to buy.
- The red curve allows you to program a limited order to sell.
Operation:
This script works from an ATR programmable according to your needs and correlated according to an Ema. It also shows you the trend in a single one thanks to an Ema 20 based on Daily data.
FR // MATR 4H Strategy - UpTrading
Utilisation 1 :
Ce script est efficace pour la totalité des actifs. Découvrez comment obtenir le fonctionnement idéal. Cet indicateur offre plusieurs possibilités :
- Uniquement en TimeFrame 4H.
- La courbe grise vous indique la tendance. Il ne faut pas trader contre celle-ci.
- Une fois la tendance établie vous pouvez acheter ou vendre selon le signe Buy et Sell.
- Lorsque le point orange (warning) apparaît vous devez rester attentif à une continuation du mouvement ou d’un retournement.
Utilisation 2 :
Vous pouvez programmer des ordres limites grâce à la bande verte ou rouge. Il s’agit de deux bandes qui anticipent le point haut ou bas du prix.
Légende:
- La courbe grisée est une Ema 20 basée sur un TimeFrame Daily.
- Le point orange signifie une continuation ou un retournement.
- Buy signifie une zone d’achat.
- Sell signifie une zone de vente.
- La courbe verte vous permet de programmer un ordre limite à l’achat.
- La courbe rouge vous permet de programmer un ordre limité à la vente.
Fonctionnement:
Ce script fonctionne à partir d’un ATR programmable suivant vos besoins et corrélé suivant une Ema. Il vous indique également en une seule la tendance grâce à une Ema 20 basée sur des données en Daily.

EMA Strategy - VaibhavRules are simple:
For CE only
1) Wait until the candle closes above the green line and a cross appears below the candle.
2) Enter on the next candle and keep your Sl at the previous candle low.
3) You can get multiple confirmation by add the pin bars from the settings.

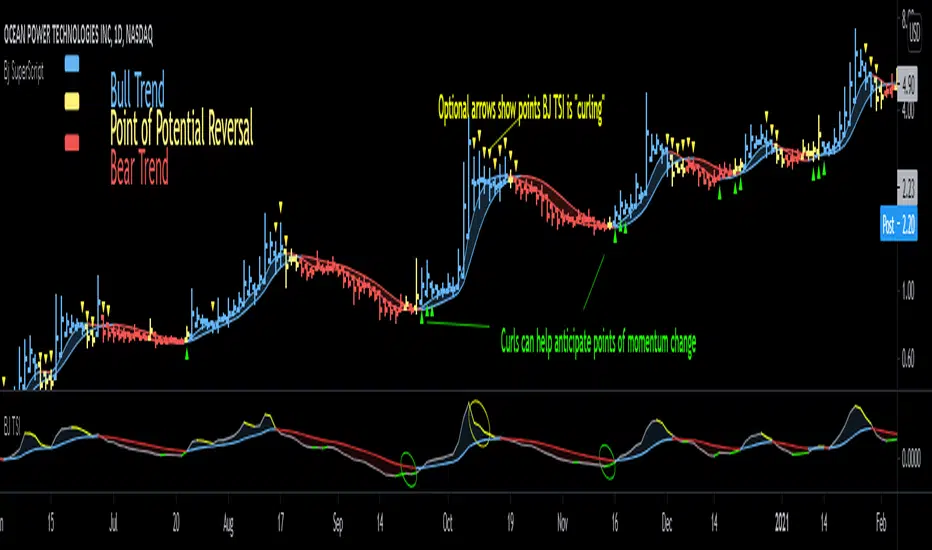
Bjorgum SuperScript
Bjorgum Reversal
Bj Reversal uses Tilson moving averages to identify trend changes
Bars change to yellow as bar close crosses the Tilson moving averages. Blue or red is confirmed as the two Tilson averages themselves cross.
Reversal is great for pinpointing trend change often giving the absolute best entry or exit
Its sensitive nature can mean more false signals on some assets
Be sure to use other indicators from the Bjorgum Collection to confirm signals, or use another strategy that fits the asset or time frame being viewed
Bjorgum HEMA Strategy
Hema uses HA smoothed EMAs to identify trend direction
Default EMA lengths are 5,9, and 21 period
Bar Color will change Malibu or Ruby on a cross of BOTH 5 and 9 EMA
The lengths are customizable to whatever lengths the user desires
Rolando Santos True Relative Movement (TRM)
This underrated momentum strategy conceptualized by Rolando Santos uses 2 indicators to give a 3 color scheme
A leading indicator (RSI) is combined with a lagging indicator (TSI) to produce bar colors based on the condition of each indicator
Both indicators in positive territory produce blue bars
Both indicators in negative bias produce yellow bars
If signals are mixed (one up one down) bars become grey
Speed Selection
The Bjorgum speed selector optimizes the strategy based on the users desires or trading style at the touch of a button
Fast setting is better for swing trades - more timely signals, more whipsaw
Slow setting is better for longer holds or more volatile assets - slower signals, smooths out whipsaw
RSI Bar Color
RSI color changes bar color based on user defined RSI values
Buy/ sell signals are typically given on a cross of the 50 level
Speed selector (fast/Slow) automatically changes lengths between Bj RSI (5 period) and a standard RSI (14 period)
Additional capabilities can be mixed and matched from strategies in the "Strategy Override" section
Add-ons include:
Tilson - The moving average system from Bjorgum Reversal can be toggled to couple with another bar color strategy by clicking this button
PSAR - Parabolic Stop and Reverse indicator can help with trend direction, volatility, and stop losses
HEMA - The 3 moving average system from the HEMA strategy can be coupled with any of the other strategies by clicking "Show HEMA"
Bj Arrows - These arrows plot at the bar level to draw attention to when the BJ TSI is "curling" (See profile for Bjorgum TSI and download today)
-Optional "Plotbar Overlay" plots bars with Heikin-Ashi Inputs when toggled
-This allows for the benefits of price smoothing without sacrificing moving average and indicator performance as real close value is still used
-This can also help on short time frames and improve results with crypto! The user must "mute" the main series candles when in use to avoid candle overlap.
-Optional price line as muting main bars will disable the TradingView default price line. The horizontal plot will track the real closing price while in HA mode!
OptionsMillionaire SPY Moving Averages and Signalsby ColeJustice
OptionsMillionaire's SPY Options trading system is based mainly on these indicators:
- 8 EMA*
- 21 EMA*
- 100 SMA*
- 200 SMA*
- MACD
- RSI
- Squeeze Momentum
(*provided by this indicator)
and follows these rules:
|
| 1) I never fight the trend. If its green, i buy calls. If its red, i buy puts. I will only buy puts on a green day if there is a overall change in market trend. Inversely, calls on a red day
| 2) Price action is my #1 indicator. I wait for it to confirm my thesis before i enter a trade
| 3) I only trade SPY Options
| 4) My baseline is to choose a call/put that has a DTE (Date To Expiration) 6-7 days out, with a strike $2-$3 away. I adjust that to fit my current appetite for volatility. i virtually never play same day DTE's.
| 5) I set a 10% stop, but usually exit at 8% before my stop triggers depending on current situation
| 6) I utilize about 10-20% of my Portfolio for one trade. Sometimes more. Rarely less.
| 7) I never hold overnight in these market conditions.
| 8) I shoot for 10-20% for gains. Depending on market conditions.
| 9) Always look for confirmations in your indicators.
| 10) I never force a trade. No trade is a good trade too if the entry just isn't there.
| 11) Patience always pays off. A great set-up can form in minutes or seconds. I never regret being patient to enter. I nearly always regret rushing into a trade.
|
This indicator combines the moving averages into a single unit to simplify one part of the indicator usage rules: the 8 EMA / 21 EMA Cross. . The 8 crossing over the 21 is a Bullish signal, while the 8 crossing under the 21 is a Bearish signal. This indicator places flags at these crossover/under points, as well as shading the area between the 8 and 21 EMAs to help visualize the strength of the trend; green during a Bullish cross, and red during a Bearish cross.
A new addition to this strategy is the Hull Moving Average, or HMA. This script defaults to an HMA of 20 and shows alerts when candles close above or below the plot in the form of green and red candle backgrounds. This alert is best used in conjunction with the main crossovers and should be considered an addition level of confidence rather than providing trade entry/exits directly. This indicator is more flexible and you should feel free to adjust the period if you find a different value works better within your own personal trading style.
Each individual element of this indicator can be modified or toggled, providing maximum customization. While you should strive to become comfortable with the default settings, these options are provided in case you feel the need to adjust for your own style (or if testing on tickers other than SPY, for example).
Goodluch, and happy trading!
MA Strategy Emperor insiliconotThe Script offers 9 different EMAs with 14 different MA types.
The make use of the script is to find the entry on the 1-4 hour altcoins while using the in-built 13/21 crossover strategy to be used in sync with Heikin Ashi cross-over with Fib levels of 0.236 Fib level.
How to use it.
Entry is to be made when the
1. Cross over gives a P(Positive Sign) and the candle completely closes above the cross-over
2. When the Heikin Ashi turns green and the next green HA candle goes above the previous green HA candle.
3. The price should be at-least above the 0.236 Level from the Swing high.
All the Best.
EmperorBTC

Alert// Short+long: SAR+HMA+Bollinger+support/resistanceHello, dear friends.
This script can be used for various strategies. Whether it's a scalp like now or more positional purchases. To determine the minimum and maximum, SAR ,resistance points, support points+HMA+ Bollinger channel are used. The entry occurs when the SAR intersects with the HMA , if it is above or below the support/ resistance levels.
In the settings there is a "back" how many bars to use back to search for these conditions.Also the standard setting is SAR+ multiplier.
The strategy based on these alerts is the same, but the conditions stipulate that the entry into the deal does not occur (while you are in the deal) if the purchase is more expensive than the previous one.

Trading Con Propositomy scrip intention is to make easier and simpler my analisis, having everything toghether helps me take desicions when to enter the market, the estrategy is based in moving averages, pivot points and structure, and the bollinger bands and the sthochastic are just another tool of confirmation when i'm goin to execute the trade.
the market for this strategy is more focused on futures and us stocks but it can be use in any other market. the way to use this strategy is simple, every time a candle goes thru a MA and pull's back to it is a sign of a possible trade, samething when it cuts thru a pivot point and the perfect condition is when the bollinger bands and the sthocasthic are in oversold and overbuy areas.
