Multi Market Structure TrendOVERVIEW
Multi Market Structure Trend is a multi-layered market structure analyzer that detects trend shifts across five independent pivot-based structures . Each pivot uses a different lookback length, offering a comprehensive view of structural momentum from short-term to long-term.
The indicator visually displays the net trend direction using colored candlesticks and a dynamic gauge that tracks how many of the 5 market structure layers are currently bullish or bearish.
⯁ STRUCTURE TRACKING SYSTEM
The indicator tracks five separate market structure layers in parallel using pivot-based breakouts. Each one can be individually enabled or disabled.
Each structure works as follows:
A bullish MSB (Market Structure Break) occurs when price breaks above the most recent swing high.
A bearish MSB occurs when price breaks below the most recent swing low.
Structure breaks are plotted as horizontal lines and labeled with the number (1 to 5) corresponding to their pivot layer.
⯁ CANDLE COLOR GRADIENT SYSTEM
The indicator calculates the average directional bias from all enabled market structures to determine the current trend score.
Each structure contributes a score of +1 for bullish and -1 for bearish.
The total score ranges from -5 (all bearish) to +5 (all bullish) .
Candlesticks are colored using a smooth gradient:
Bright Green: Strong bullish trend (e.g., +5).
Orange: Neutral mixed trend (e.g., 0).
Red: Strong bearish trend (e.g., -5).
⯁ TREND GAUGE PANEL
Displayed at the middle-right side of the chart, the gauge shows the current trend strength in real time.
The bar consists of up to 10 gradient cells (5 up, 5 down).
Each active market structure pushes the score in one direction.
The central cell displays a numeric trend score:
+5 = All 5 market structures bullish
0 = Mixed/neutral trend
-5 = All 5 market structures bearish
Colors of the gauge bars match the candle gradient system.
⯁ USAGE
This indicator is highly effective for traders who want to:
Monitor short- and long-term structure shifts simultaneously on a single chart.
Use structure alignment as a trend confirmation tool — for example, waiting for at least 2 out of 5 structures to align before entering a trade.
Visually filter noise from different time horizons using the gauge and candle gradient.
Track CHoCH (Change of Character) transitions clearly and across multiple scales.
⯁ CONCLUSION
Multi Market Structure Trend offers a unique and powerful way to assess trend direction using stacked market structure logic. With five independently calculated structure layers, colored candle feedback, and a real-time trend gauge, traders can better time entries, filter noise, and confirm multi-timeframe alignment — all within a single chart overlay.
Structuretrading

Price Swing Detection - Smart Money ConceptSince my own style is Smart Money Concept and these days I have seen a lot of my friends who are having trouble identifying structures for their indicators and strategies. I wrote this code so they could use it in their strategy . In fact, this type of structure, as one of the strongest technical structures, can increase the success of your strategy according to your personalization.
The script detects swings (i.e. significant highs and lows) in a financial instrument's price action over a specified period. The user can set the lookback period (number of candles to consider) and the colors of the lines representing bullish and bearish trends.
The script has two functions: detectSwing and pivot high. The detectSwing function calculates the swing highs and lows for the specified number of candles. The function uses the ta.highest and ta.lowest functions to find the highest and lowest prices, respectively, over the lookback period. The function also determines the swing state (high or low) of the current candle and returns the calculated swing values.
The pivot high function calculates the pivot high, which is an important step in detecting bullish structures in the market. If a new top (i.e. swing high) is found, the script updates the pivot high values and creates a line from the recent top to the last bar. The script also updates the trailing maximum values, which are used to extend the top extension line.
For Strategy :
The variable "trendDirection" in the code is used to keep track of the trend state, either bullish (up trend) or bearish (down trend), in the market. The variable is initialized to 0 which represents a downtrend. The value of this variable is updated later in the code based on the calculations of swing highs and lows, pivot crosses, and the trailing maximum. If a bullish structure is detected, the value of "trendDirection" is set to 1, indicating an uptrend.

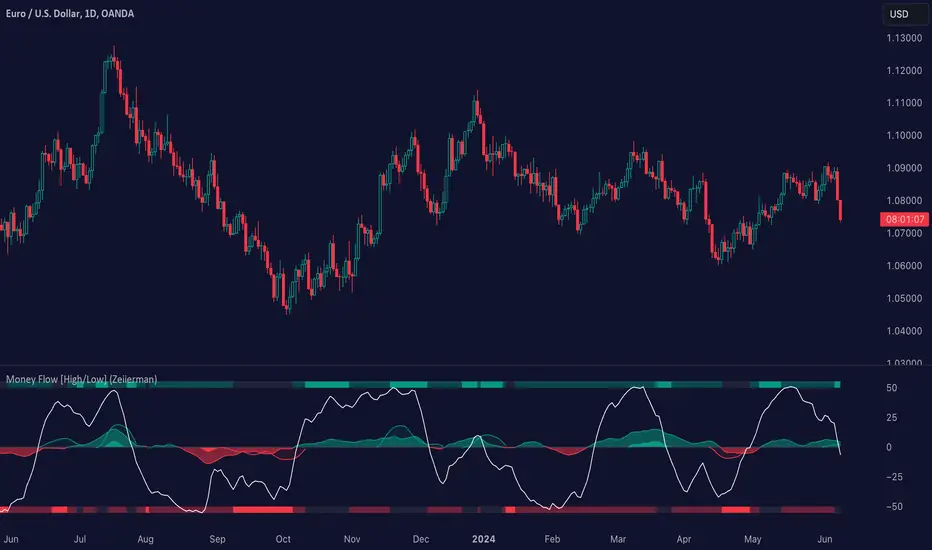
High – Low Trend Indicator Signal (Expo)High - Low Trend Indicator Signal - (Expo)
DESCRIPTION
This indicator is derived from my previous one called High – Low Trend Indicator (Expo) , but the difference is that this one generates Long signals and detects market changes. These two indicators are intended to be used in the same chart for better accuracy and validation of signals. The indicator is perfectly used to identify pullbacks in positive trends!
HOW TO USE
When a signal appears, consider enter long, or look for confirmation patterns. Such confirmation could be seen in the High – Low Trend Indicator (Expo) when the red cloud disappears or when the black price line crosses out from the red cloud, or when the black price line crosses up over the blue midline.
So,
1. Use the indicator to identify Long signals.
2. Use the indicator to find Entry points in positive trends.
3. Use the indicator to detect market changes.
4. Combine it with High – Low Trend Indicator (Expo).
INDICATOR IN ACTION
The indicator is best presented live, the graphs below are a good guide.
EURUSD
DAX
WALL STREET
GOLD
I hope you find this indicator useful , and please comment or contact me if you like the script or have any questions/suggestions for future improvements. Thanks!
I will continue to work on this indicator, so please share your experience and feedback with me so that I can continuously improve it. Thanks to everyone that have contacted me regarding my scripts. Your feedback is valuable for future developments!
ACCESS THE INDICATOR
• Contact me on TradingView or use the links below
-----------------
Disclaimer
Copyright by Zeiierman.
The information contained in my scripts/indicators/ideas does not constitute financial advice or a solicitation to buy or sell any securities of any type. I will not accept liability for any loss or damage, including without limitation any loss of profit, which may arise directly or indirectly from use of or reliance on such information.
All investments involve risk, and the past performance of a security, industry, sector, market, financial product, trading strategy, or individual’s trading does not guarantee future results or returns. Investors are fully responsible for any investment decisions they make. Such decisions should be based solely on an evaluation of their financial circumstances, investment objectives, risk tolerance, and liquidity needs.
My scripts/indicators/ideas are only for educational purposes!