LuxAlgo® - Price Action Concepts™Price Action Concepts™ is a first of it's kind all-in-one indicator toolkit which includes various features specifically based on pure price action.
Order Blocks w/ volume data, real-time market structure (BOS, CHoCH, EQH/L) w/ 'CHoCH+' being a more confirmed reversal signal, a MTF dashboard, Trend Line Liquidity Zones (real-time), Chart Pattern Liquidity Zones, Liquidity Grabs, and much more detailed customization to get an edge trading price action automatically.
Many traders argue that trading price action is better than using technical indicators due to lag, complexity, and noisy charts. Popular ideas within the trading space that cater towards price action trading include "trading like the banks" or "Smart Money Concepts trading" (SMC), most prominently known within the forex community.
What differentiates price action trading from others forms of technical analysis is that it's main focus is on raw price data opposed to creating values or plots derived from price history.
Mostly all of the features within this script are generated purely from price action, more specifically; swing highs, swing lows, and market structure... which allows users to automate their analysis of price action for any market / timeframe.
🔶 FEATURES
This script includes many features based on Price Action; these are highlighted below:
Market structure (BOS, CHoCH, CHoCH+, EQH/L) (Internal & Swing) multi-timeframe
Volumetric Order Blocks & mitigation methods (bullish & bearish)
Liquidity Concepts
Trend Line Liquidity Zones
Chart Pattern Liquidity
Liquidity Grabs Feature
Imbalance Concepts MTF w/ multiple mitigation methods
Fair Value Gaps
Balanced Price Range
Activity Asymmetry
Strong/Weak Highs & Lows w/ volume percentages
Premium & Discount Zones included
Candle Coloring based on market structure
Previous Highs/Lows (Daily, Monday's, Weekly, Monthly, Quarterly)
Multi-Timeframe Dashboard (15m, 1h, 4h, 1d)
Built-in alert conditions & Any Alert() Function Call Conditions
Advanced Alerts Creator to create step-by-step alerts with various conditions
+ more (see changelog below for current features)
🔶 BASIC DEMONSTRATION
In the image above we can see a demonstration of the market structure labeling within this indicator. The automatic BOS & CHoCH labels on top of dashed lines give clear indications of breakouts & reversals within the internal market structure (short term price action). The "CHoCH+" label is also demonstrated as it triggers only if price has already made a new higher low, or lower high.
We can also see a solid line with a larger BOS label in the middle of the chart. This label demonstrates a break of structure taking into account the swing market structure (longer term price action). All of these labels are generated in real-time.
🔶 USAGE & EXAMPLES
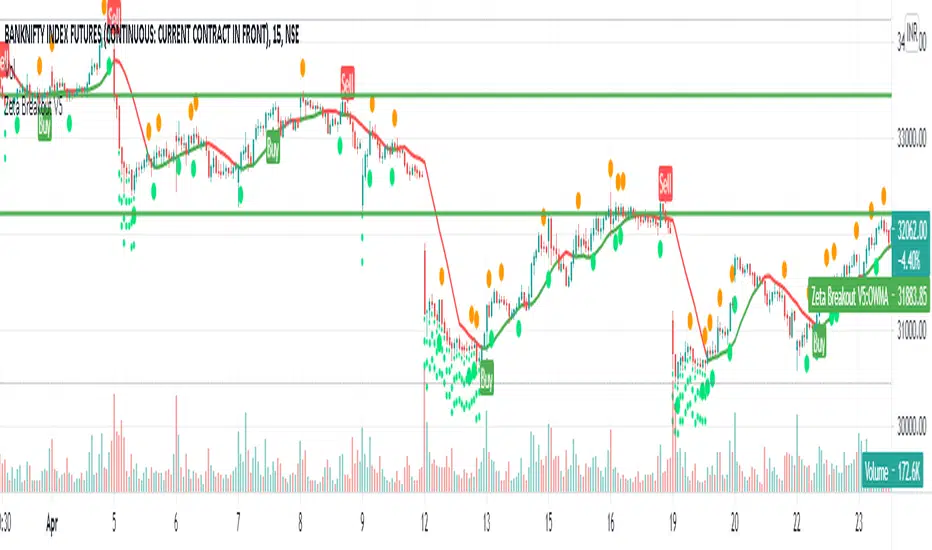
In the image below we can see how a trade setup could be created using Order Blocks w/ volume metrics to find points of interest in the market, swing / internal market structure to get indications of longer & shorter term reversals, and trend line liquidity zones to find more likely impulses & breakouts within trends.
We can see in the next image below that price came down to the highest volume order block marked out previously as our point of interest for an entry used in confluence with the overall market structure being bullish (swing CHoCH). Due to price closing below the middle Order Block at (24.77%), we saw it was mitigated, and then price revisited liquidity above the Trend Line zone above, leading us to the first Order Block as a target.
You will notice the % values adjust as Order Blocks are touched & mitigated, aligning with the correct volume detected when the Order Block was established.
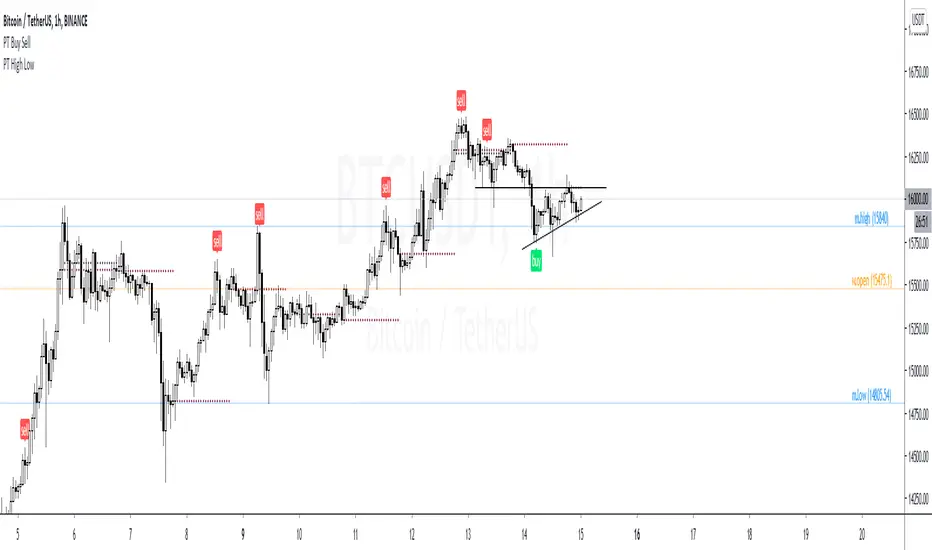
In the image below we can see more features from within Price Action Concepts™ indicator, including Chart Pattern Liquidity, Fair Value Gaps (one of many Imbalance Concepts), Liquidity Grabs, as well as the primary market structures & OBs.
By using multiple features as such, users can develop a greater interpretation of where liquidity rests in the market, which allows them to develop trading plans a lot easier. Liquidity Grabs are highlighted as blue/red boxes on the wicks during specific price action that indicates the market has made an impulse specifically to take out resting buy or sell side orders.
We can notice in the trade demonstrated below (hindsight example) how price often moves to the areas of the most liquidity, even if unexpected according to classical technical analysis performed by retail traders such as chart patterns. Wicks to take out orders above & potentially trap traders are much more noticeable with features such as these.
The Chart Patterns which can be detected include:
Ascending/Descending Wedges (Asc/Desc Wedge)
Ascending/Descending Broadening Wedges (Asc/Desc BW)
Ascending/Descending/Symmetrical Triangles (Asc/Desc/Sym Triangle)
Double Tops/Bottoms (Double Top/Double BTM)
Head & Shoulders (H&S)
Inverted Head & Shoulders (IH&S)
General support & resistance during undetected patterns
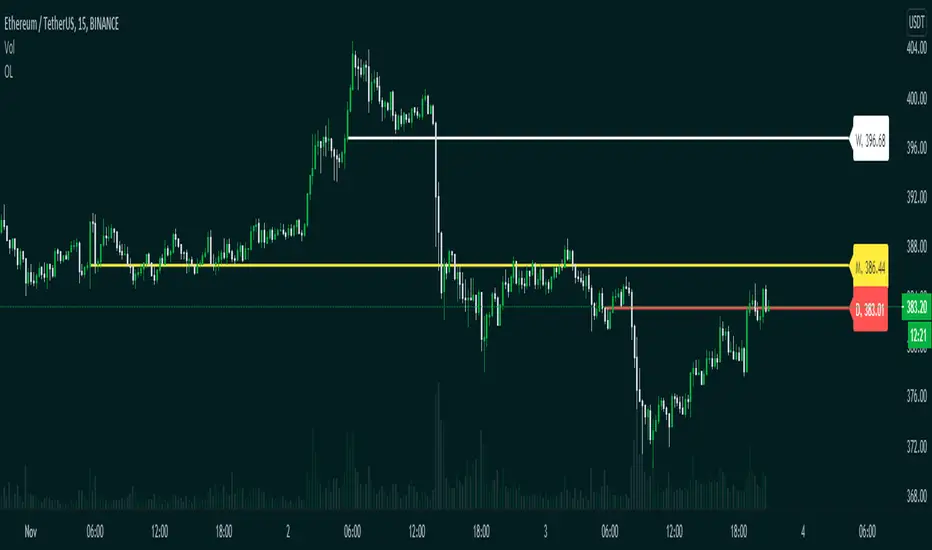
In the image below we can see more features from within the indicator, including Balanced Price Range (another imbalance method similar to FVG), Market Structure Candle Coloring, Accumulation & Distribution zones, Premium & Discount zones w/ a percentage on each zone, the MTF dashboard, as well as the Previous Daily Highs & Lows (one of many highs/lows) displayed on the chart automatically.
The colored candles use more specific market structure analysis, specifically allowing users to visualize when trends are considered "normal" or "strong". By utilizing other features alongside this market structure analysis, such as noticing price retesting the PDL level + the Equilibrium as resistance, a Balanced Price Range below price, the discount with a high 72% metric, and the MTF dashboard displaying an overall bearish structure...
...users can instantly gain a deeper interpretation of price action, make highly confluent trading plans while avoiding classical technical indicators, and use traditional retail trading concepts such as chart patterns / trend lines to their advantage in finding logical areas of liquidity & points of interest in the market.
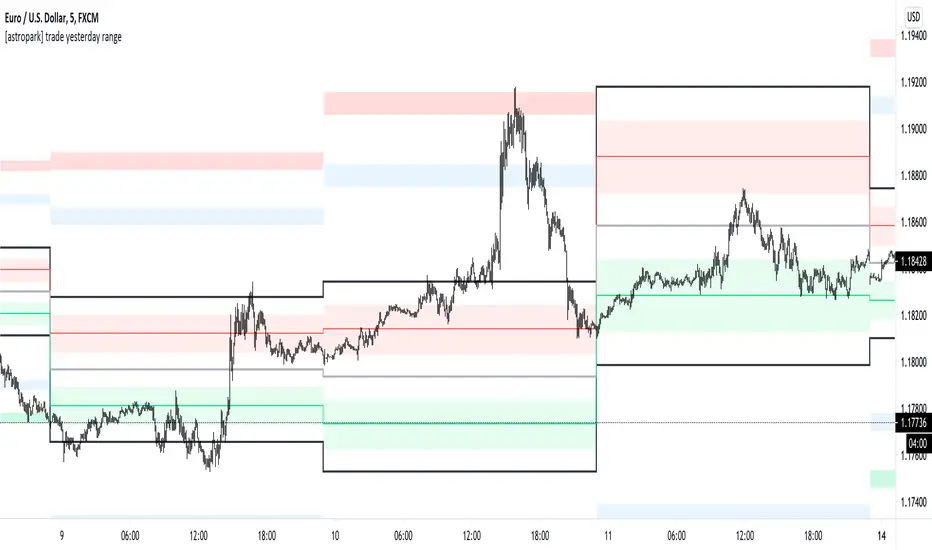
The image below shows the previous chart zoomed in with 2 liquidity concepts re-enabled & used alongside a new range targeting the same Discount zone.
🔶 SETTINGS
Market Structure Internal: Allows the user to select which internal structures to display (BOS, CHoCH, or None).
Market Structure Swing: Allows the user to select which swing structures to display (BOS, CHoCH, or None).
MTF Scanner: See market structure on various timeframes & how many labels are active consecutively.
Equal Highs & Lows: Displays EQH / EQL labels on chart for detecting equal highs & lows.
Color Candles: Plots candles based on the internal & swing structures from within the indicator on the chart.
Order Blocks Internal: Enables Internal Order Blocks & allows the user to select how many most recent Internal Order Blocks appear on the chart as well as select a color.
Order Blocks Swing: Enables Swing Order Blocks & allows the user to select how many most recent Swing Order Blocks appear on the chart as well as select a color.
Mitigation Method: Allows the user to select how the script mitigates an Order Block (close, wick, or average).
Internal Buy/Sell Activity: Allows the user to display buy/sell activity within Order Blocks & decide their color.
Show Metrics: Allows the user to display volume % metrics within the Order Blocks.
Trend Line Liquidity Zones: Allows the user to display Trend Line Zones on the chart, select the number of Trend Lines visible, & their colors.
Chart Pattern Liquidity: Allows the user to display Chart Patterns on the chart, select the significance of the pattern detection, & their colors.
Liquidity Grabs: Allows the user to display Liquidity Grabs on the chart.
Imbalance Concepts: Allows the user to select the type of imbalances to display on the chart as well as the styling, mitigation method, & timeframe.
Auto FVG Threshold: Filter out non-significant fair value gaps.
Premium/ Discount Zones: Allows the user to display Premium, Discount , and Equilibrium zones on the chart
Accumulation / Distribution: Allows the user to display accumulation & distribution consolidation zones with an optional Consolidation Zig-Zag setting included.
Highs/Lows MTF: Displays previous highs & lows as levels on the chart for the previous Day, Monday, Week, Month, or quarter (3M).
General Styling: Provides styling options for market structure labels, market structure theme, and dashboard customization.
Any Alert() Function Call Conditions: Allows the user to select multiple conditions to use within 1 alert.
🔶 CONCLUSION
Price action trading is a widely respected method for its simplicity & realistic approach to understanding the market itself. Price Action Concepts™ is an extremely comprehensive product that opens the possibilities for any trader to automatically display useful metrics for trading price action with enhanced details in each. While this script is useful, it's critical to understand that past performance is not necessarily indicative of future results and there are many more factors that go into being a profitable trader.
🔶 HOW TO GET ACCESS
You can see the Author's instructions below to get instant access to this indicator & our premium suite.
Indicateur Pine Script®