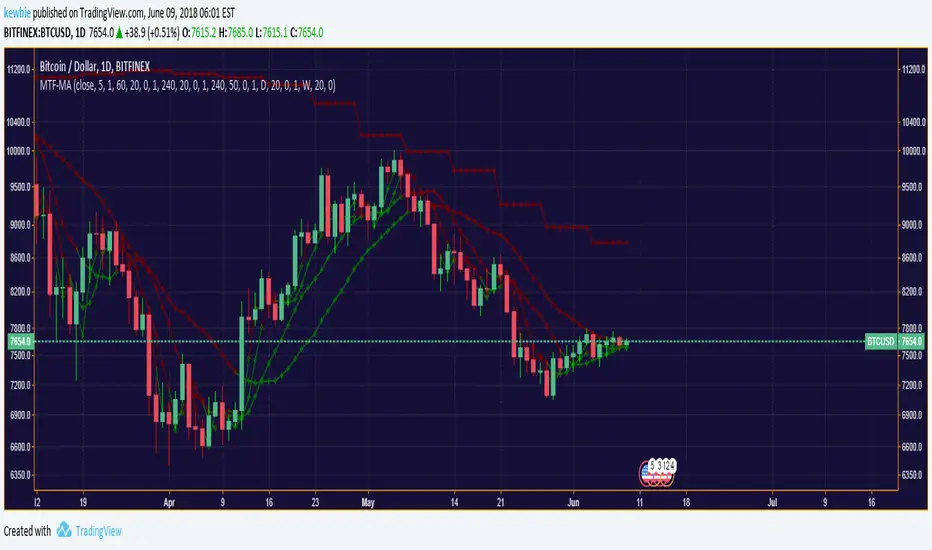
NimhFX Multi TF PivotsNimhfx Multi TF Pivots
Written by NickThomas
----------------------------------
Multiple Timeframe EMA based pivot points
The Indicator was developed to keep track of EMA based levels across multiple timeframes, without the need for switching back and forth and marking out levels.
You are allowed to use '3 Sets' of objects - each can be configured to display the Pivot based on the input variables you set.
Example (Setup as default settings)
Visibility Inputs
Show Pivot Set # Titles - Displays the Text Labels above the pivot points - ON/OFF
Show Pivot Set # Levels - Displays the Levels set by the configuration - ON/OFF
Pivot Set #1
Pivot Set #1 Timeframe - 60 - Additional Timeframes can be configured using the standards setout in Pinescript (1, 5, 8, 15, 30, 45, 60, 120, 240, D, W, M)
Pivot Set #1 - EMA #1 Period - 100 (100 Period EMA)
Pivot Set #1 - EMA #2 Period - 200 (200 Period EMA)
Pivot Set #1 - EMA #3 Period - 500 (500 Period EMA)
This configuration will draw pivot points at the following locations:
60 Minute Timeframe 100 Period EMA
60 Minute Timeframe 200 Period EMA
60 Minute Timeframe 500 Period EMA
The Indicator can work across whichever timeframe and whichever EMA period you desire for your setup.
Pivot Set #2 and Pivot Set #3 are additional instances of Pivot Set #1 for use with different settings but operates in the same manner.
Timeframe

Relative Strength Index Multi Time frame RSII am always checking RSI on 1hr, 4Hr and Day RSI.
Having to switch is annoying so wrote this little script to show RSI on upto 5 time frames.
The green bold line is the current time frame, and you can change the other 4 to what you prefer.
If one time frame is over sold or overbought you can change the back to indicated a buy or sell etc.
Anyway thought I would share it.
If you like it, please click the like button.

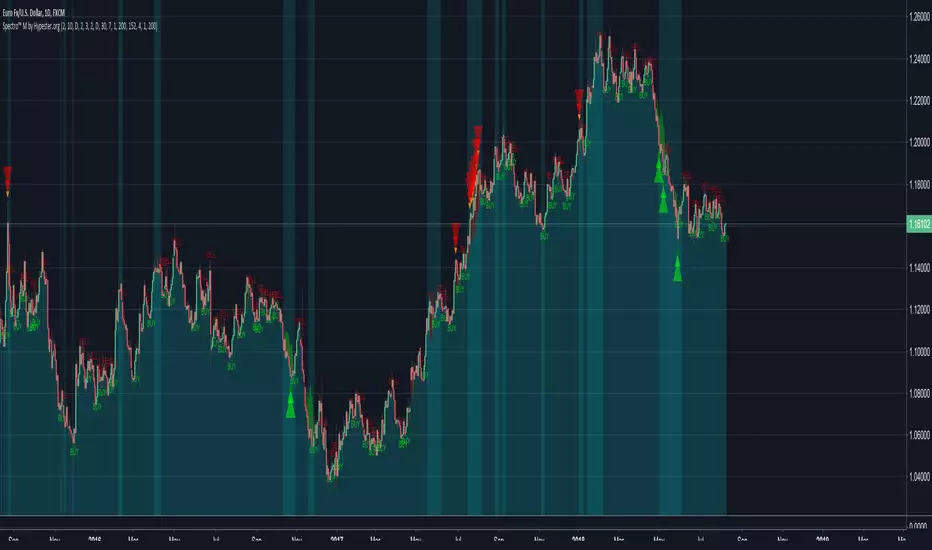
Spectro™ ScreenerNow Spectro™ technology helps you find and trade several assets with one look.
08/08/18 - Beta test v1 is published
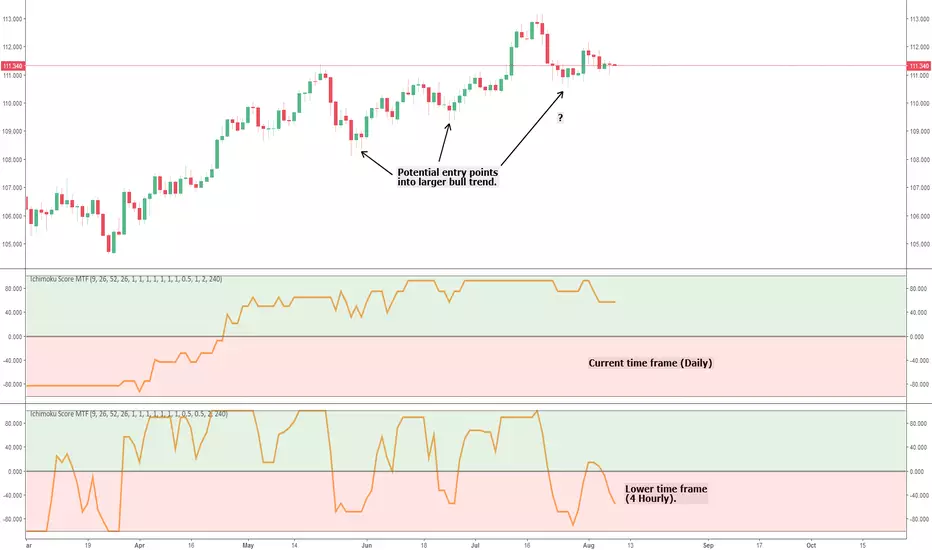
Ichimoku Cloud Score MTFThis is a simple multi time frame (MTF) conversion of the Ichimoku Cloud Score indicator.
All credit goes to the following users for the initial implementations:
- User @dashed :
- User @sjb933 :
This script calculates the Cloud Score based on the sjb933 version; all I've done is convert the script to Pinescript version 3 (to ensure the security function works as intended) and add MTF capability.
I'm a big fan of MTF analysis when using indicators (particularly oscillators). Using a higher time frame runs into the issue of the indicator repainting until the relevant higher time frame candle closes (this is inevitable and logical - so don't comment saying it repaints!). However, for lagging indicators such as this one, adding a lower time frame provides potential entry and exit signals into the larger trend, and also provides early warning of large trend shifts before the current time frame will. This can give you more control over your trades, and in my experience helps lagging indicators such as Ichimoku stay relevant in high volatility markets that are vastly different from when the indicators were conceived.
Any queries please let me know.
Cheers,
RJR
Multi Time Frame 3x EMA 5min 15min and 60minThanks to Jurij for his coding on single MTF EMA I added 2 more, but changed the time frame to 5min, 15min and 60min

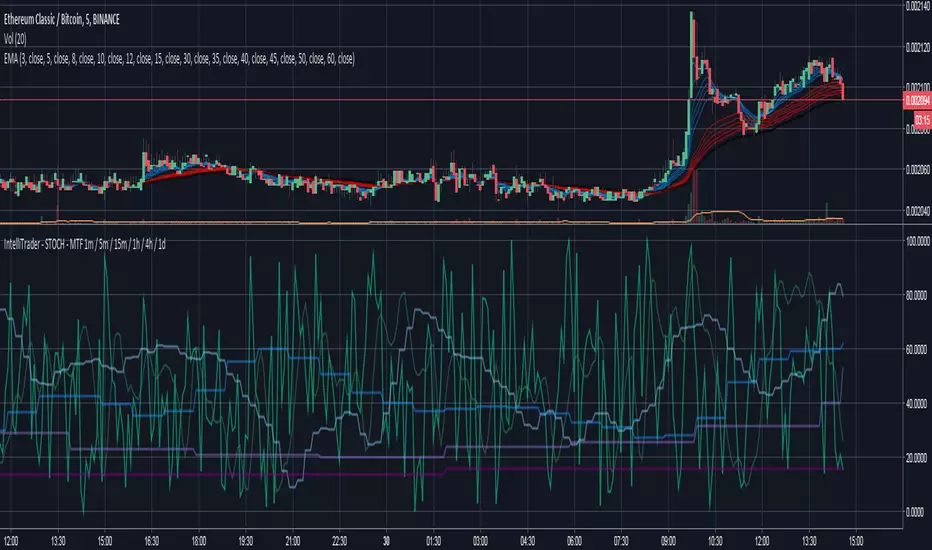
IntelliTrader - STOCH - MTF 1m / 5m / 15m / 1h / 4h / 1dlight green = 1m
green = 5m
light blue = 15m
blue = 1h
light purple = 4h
purple = 1d
P-Signal v2.0Description.
-------------
P-Signal v.2.0 is a modified and improved version of an earlier published P-Signal. This version allows to observe
the signal image for a multi frame - a specific set of periods. In this version it is {T, 2T, 4T, 8T, 16T},
where T equals the “working” time i.e. period for which a chart is observed. For example, if T=5m, one can observe
P-Signal not only for 5m period (ocher curve) but also an average image of P-Signal for 5m, 10m, 20m, 40m, 80m
periods (grey curve) without switching over frames.
Moreover p-Signal v2.0 allows to catch "winning" combinations with help of alerts. When alert is active, you'll receive
a notification if combination exists after working frame was closed. There are two combinations in this version:
“High” and “Straight”. The terminology is borrowed from poker game to more easily present trading ideas.
For example: " EUR.USD Straight SHORT on 4h " and so on.
The “High” alert corresponds to absolute value of Gauss error function of working frame (T) not less the value which
is defined by Alert on “High” parameter. The “Straight” combination is registered if same sign signals (poker “flush”)
are observed simultaneously over set of periods. The rank of “Straight” combination is defined by T and Alert on “Straight”
parameter. This combination is less frequent, but stronger the previous one if parameters are chosen reasonably.
Value of parameters depend on T. The lower T the closer parameters to 1. By default “High” equals to 0.98 and
“Straight” equals to 0.85. Both for T=1m. The other parameters correspond to the first version.
Important ! For correct operation T should not exceed the values of hourly time frames!
Good luck!

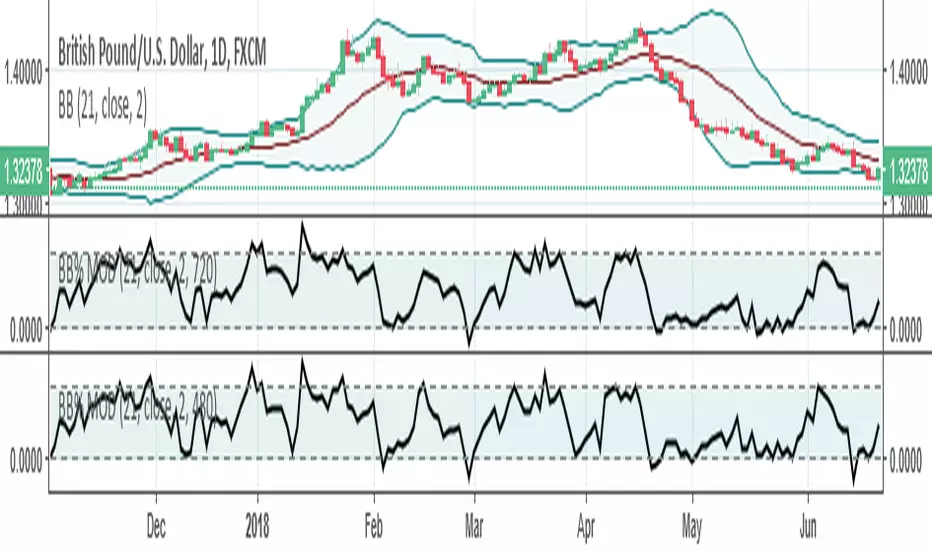
BB% MODHELLO EVERYONE !
I created this indicator to simplify my life in the study of the bollinger bands on a multi-time frame optics.
It works exactly like the bollinger bands %B you have of defaul inside tradingwiew;
BUT you can choose via an integrated button that I integrated if you see the indicator on the chart timeframe or a custom time frame, which can be changed via a window
Timeframe that you can choose from the window: 1M, 3M, 15M, 30M, 45M, 1H, 2H, 4H, 8H, 12H, D, 3D, W
For more info contact me in PM
I usually answer in 1/3 Day
BB% MODHELLO EVERYONE !
I created this indicator to simplify my life in the study of the bollinger bands on a multi-time frame optics.
It works exactly like the bollinger bands %B you have of defaul inside tradingwiew;
BUT you can choose via an integrated button that I integrated if you see the indicator on the chart timeframe or a custom time frame, which can be changed via a window
Timeframe that you can choose from the window: 1M, 3M, 15M, 30M, 45M, 1H, 2H, 4H, 8H, 12H, D, 3D, W .
For more info write me in PM.
I answer in 24/48 H

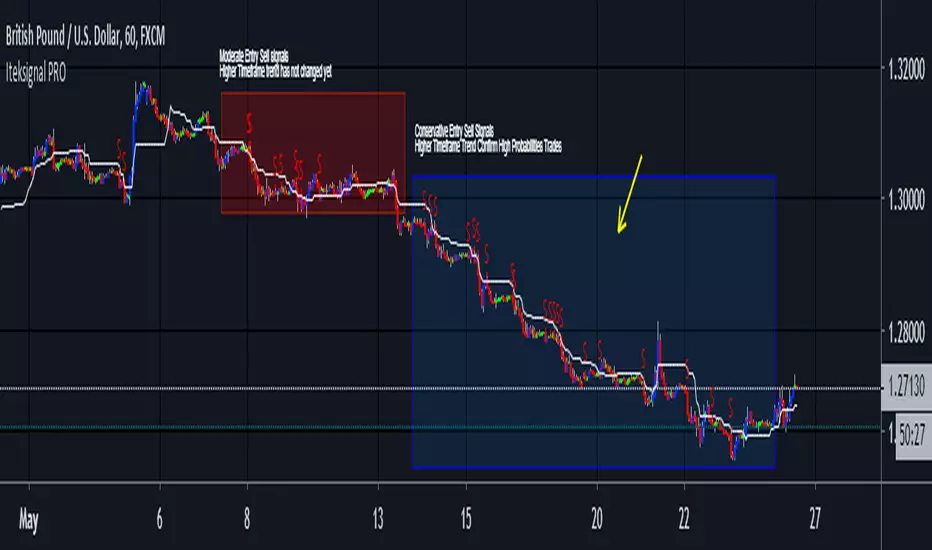
Iteksignal PRO V1.0Iteksignal PRO V1.0 include more price action patterns that add more Trend Continuation signals and less invalid Reversal signals.
Same sutup rules of Iteksignal Full apply.
A Short Term Trend Line indicator is plotted, Very useful for Trailing Stop.
FofT - 1h, 4h, and Daily RSI in any time intervalView multiple-timeframe RSIs in a single interval. All RSI lines stay the same no matter your preference to trade in 15m, 1h, 3h…. etc.
Default RSI length is 7 (can be changed in the format settings)
All RSIs are smoothed out in default (can be changed in the format settings)
Line colors
5m RSI - white (disabled in default)
15m RSI - Lime (disabled in default)
1h RSI - Yellow
4h RSI - Red
D RSI - Blue
Overbought and Oversold threshold colors
>70 (grey) - overbought
>80 (orange) - highly overbought
>90 (pink) - extremely overbought
=50 (black dotted lines) - equilibrium
<30 (grey) - oversold
<20 (orange) - highly oversold
<10 (pink) - extremely oversold
How to add to chart
* Click on "Add to Favorite scripts" in the bottom right
* While in chart view click on "/" button on your keyboard or click on the Indicators button on the top tool bar
* Go to Favorites Tab and click on this indicator
Other interval RSIs will be added based on request. Feel free to leave any questions or requests in the comment section below.
If you find this script useful, please like and share.

FofT - 1h, 4h, and D multi-timeframe EMAs in any time intervalView multiple-timeframe EMAs in a single interval. All EMA lines stay the same no matter your preference to trade in 15m, 1h, 3h…. etc.
Default EMA length is 10 (can be changed in the format settings)
Line colors
1h EMA - Yellow
4h EMA - Red
D EMA - Blue
How to add to chart
Click on "Add to Favorite scripts" in the bottom right
While in chart view click on "/" button on your keyboard or click on the Indicators button on the top tool bar
Go to Favorites Tab and click on this indicator
Other interval EMAs will be added based on request. Feel free to leave any questions or requests in the comment section below.
If you find this script useful, please like and share.

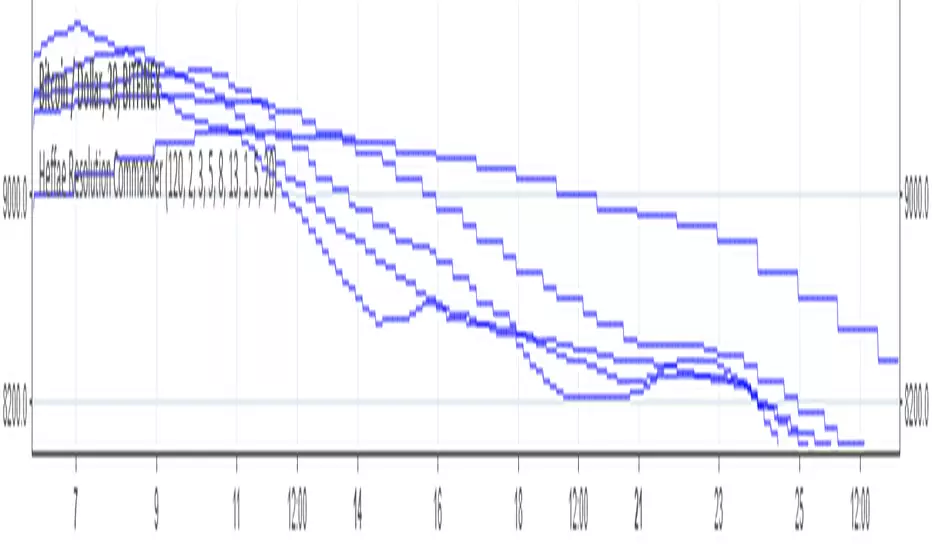
Heffae Resolution Commander (RAW)This is a script to call resolutions with some math on top of your base resolution.
Using the modulo operator to quantize integer values, it works by converting the modified resolution integer to a 4 digit string value.
Use the function within your own scripts to call funny resolutions otherwise difficult to calculate.
You cannot add series expressions to the resolution value since pine does not allow "series" as a resolution for a security call
However, you could easily stack a crapload of these together and use an expression to switch the referenced security function for your purposes.
This is the raw timeframe output as integer, not string.
To go back to string outputs (for use in security calls etc) unslash line 52 //resvalue
For those interested in the verbose version of the timeframe mod function, showing all the steps, here is a pastebin:
pastebin.com
Cheers! Drop a line / comment if you enjoy or have any questions on how to integrate this into your script@!
The Modulo operator is so much fun!
Heffae Resolution CommanderThis is a script to call resolutions with some math on top of your base resolution.
THIS IS NOT AN INDICATOR TO USE ON A CHART!!! The resolution call function is really useful for your own scripting ideas!
Using the modulo operator to quantize integer values, it works by converting the modified resolution integer to a 4 digit string value.
The function within this script is what is valuable, use it within your own scripts to call funny resolutions otherwise difficult to calculate.
You cannot add series expressions to the resolution value since pine does not allow "series " as a resolution for a security call
However, you could easily stack a crapload of these together and use
an expression to switch the referenced security function for your purposes.
The SMA and plot overlay are just there to show a visual example of how the function works.
You can view the raw timeframe output integer by getting rid of tostring(x) and // out the security calls,
plotting the raw function outputs.
For those interested in the verbose version of the timeframe mod function, showing all the steps, here is a pastebin:
pastebin.com
Cheers! Drop a line / comment if you enjoy or have any questions on how to integrate this into your script@!
The Modulo operator is so much fun!
Heikin Ashi Historical TF Developmental BarsAn improvement to the built-in security(heikinashi()...) method, this indicator plots Heikin Ashi (HA) candles for an input timeframe (TF) on an underlying regular candlestick chart of a shorter TF. The improvement is that it plots the value of each in-development HA bar as it would have appeared while still repainting, for each underlying chart bar. The last chart bar of each TF matches the value available from security() calls and from HA charts directly.
For best results, be sure to use a HA TF greater than chart TF (I prefer 1 minute unless longer history is required).
1 hour HA on 1 minute underlying price chart
4 hour HA on 1 minute underlying price chart
V3: Release.

[AGHYAD]EMA-CROSS+CCI_BASED_ON_RENKO////////////////////////////////////////////
// 4 HOURS
// -------------------------- BUY --------------------------
// 1. MUST: Set Time_Frame To 1D
// 2. STRONG: Any Green Signal!!
////////////////////////////////////////////
EMA-CROSS + CCI SIGNALS BASED ON RENKO WITH CUSTOM TIME-FRAME

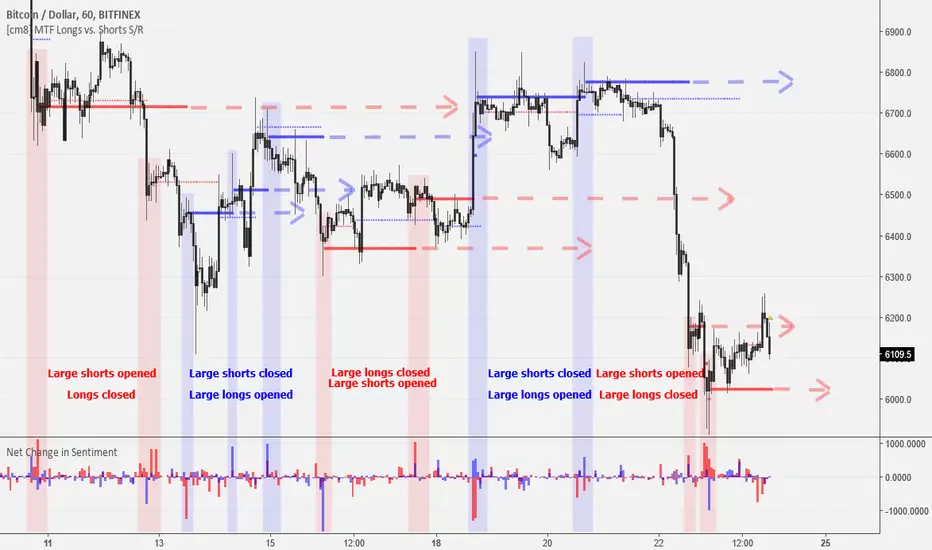
MTF Bitfinex Longs vs. Shorts Support/Resistance [checkm8]Hello and welcome to my multi-timeframe support and resistance indicator based on margin longs and shorts on Bitfinex :D
The premise of the script is simple. It draws support and resistance levels based on large margin movements ( effectively showing the break-even points of those positions ), where:
Longs opening and shorts closing is bullish pressure
Longs closing and shorts opening is bearish pressure
You can select your desired timeframe for the script to show the levels on. The script draws two sets of lines, one based on medium-sized movements and another based on large movements, where you can also manually input the size of the movements for it to track. By default, the script is optimized for 1-hour timeframes on BTCUSD, where the medium sized movements are set to bullish/bearish pressures of over 500 BTC, and large movements based on pressures of over 1000 BTC.
If you choose to use a different currency pair (ex. LTCUSD, ETCUSD, EOSUSD, etc..) you must adjust the volume that the script tracks , as tracking something like a 500 margin long in XRPUSD is useless. This also applies to timeframes , as timeframes lower than 1 hour may require smaller input values, while larger timeframes will require larger movements.
In addition, there is an input for the source. I recommend leaving this setting at hlc3 , because this will capture a more appropriate break-even points for the S/R levels.
A few tips:
If the current price is under a bullish support/resistance level , this implies that the bullish margin positions are underwater (the price is below their long break-evens), ie. shorts closed at the top or longs were entered at the top
If the current price is above a bullish support/resistance level , this implies that the bullish margin positions are in profit and will act as support (they will support their long break-even points)
If the current price is under a bearish support/resistance level , this implies that the bearish margin positions are in profit and will act as resistance (the price is below their short break-evens)
If the current price is above a bearish support/resistance level , this implies that the bearish margin positions are underwater (the price is above their short break-evens), ie. shorts entered at the bottom or longs were closed at the bottom
Happy trading and feel free to reach out with feedback and suggestions! :D
Special thanks goes to oh92 for his input and feedback on the idea. Check out his profile and his vast selection of indicators in the links below!
www.tradingview.com
depthhouse.com
Forex-Sessions-for FXCM 00:00-24:00 Sessione Asiatica, Europea ed Americana settate secondo i seguenti parametri:
ASIAN SESSION: 01.00 - 08.00 GMT+1
EUROPEAN SESSION: 08:00 - 14:00 GMT+1
NY SESSION: 14:00 - 21.30 GMT+1

Multiple-Timeframe Keltner ChannelKeltner Channels are volatility-based envelopes set above and below a moving average first devised by Chester W. Keltner then later revised by Linda Bradford Raschke.
This script allows for the overlay of the Keltner Channel across multiple-timeframes.
Additionally allows for the selection of the true range average type with a user defined lookback period.
Default settings is the traditional type of KC seen on TV.
Note: When inputting the MA-Basis strings it is case sensitive; enter only lowercase or all uppercase. If a typo is made it will by default revert to an EMA base.
yutas_MovingAveragesMaster_and_Bollinger Band TouchSMA × 4 (26.52.104.200)
EMA × 4 (26.52.104.200)
Bollinger Bands ±2σ & ±3σ.
With on-off switch,
Display Bollinger Bands signal sign...
SMAを4本
EMAを4本
ボリンジャーバンドを偏差2偏差3の表示
それぞれに表示の【ON】【OFF】可能。
チャート上にボリンジャーバンドのシグナルサインを表示します。

Ultimate 'Multi-Timeframe' Multi-AveragesPlots different kinds of averages (EMA, SMA, SMMA, WMA, VWMA) referred to a fixed timeframe/period indipendent from the one that you are watching (example: plot daily EMA on the 4h chart).
Highlights the crossing of averages.
Heikin-Ashi VWMA Smoothed Trend Ribbon with Custom time framesThis is a Heikin - Ashi Smoothed Trend Ribbon.
I'm using the VWMA for its smoothing calculation.
The Ribbon is based on the open and close of the Heikin - Ashi candles and doesn't show the wicks.
I have also allowed the viewing of different time frames to the current chart layout.
If you have any comments and feedback please comment below.
Multiple Timeframe Moving Average SystemModified code from ChrisMoody, RicardoSantos & Ricardo M Arjona.
Allows for multiple moving average types across custom time-frames.