Dual Bayesian For Loop [QuantAlgo]Discover the power of probabilistic investing and trading with Dual Bayesian For Loop by QuantAlgo , a cutting-edge technical indicator that brings statistical rigor to trend analysis. By merging advanced Bayesian statistics with adaptive market scanning, this tool transforms complex probability calculations into clear, actionable signals—perfect for both data-driven traders seeking statistical edge and investors who value probability-based confirmation!
🟢 Core Architecture
At its heart, this indicator employs an adaptive dual-timeframe Bayesian framework with flexible scanning capabilities. It utilizes a configurable loop start parameter that lets you fine-tune how recent price action influences probability calculations. By combining adaptive scanning with short-term and long-term Bayesian probabilities, the indicator creates a sophisticated yet clear framework for trend identification that dynamically adjusts to market conditions.
🟢 Technical Foundation
The indicator builds on three innovative components:
Adaptive Loop Scanner: Dynamically evaluates price relationships with adjustable start points for precise control over historical analysis
Bayesian Probability Engine: Transforms market movements into probability scores through statistical modeling
Dual Timeframe Integration: Merges immediate market reactions with broader probability trends through custom smoothing
🟢 Key Features & Signals
The Adaptive Dual Bayesian For Loop transforms complex calculations into clear visual signals:
Binary probability signal displaying definitive trend direction
Dynamic color-coding system for instant trend recognition
Strategic L/S markers at key probability reversals
Customizable bar coloring based on probability trends
Comprehensive alert system for probability-based shifts
🟢 Practical Usage Tips
Here's how you can get the most out of the Dual Bayesian For Loop :
1/ Setup:
Add the indicator to your TradingView chart by clicking on the star icon to add it to your favorites ⭐️
Start with default source for balanced price representation
Use standard length for probability calculations
Begin with Loop Start at 1 for complete price analysis
Start with default Loop Lookback at 70 for reliable sampling size
2/ Signal Interpretation:
Monitor probability transitions across the 50% threshold (0 line)
Watch for convergence of short and long-term probabilities
Use L/S markers for potential trade signals
Monitor bar colors for additional trend confirmation
Configure alerts for significant trend crossovers and reversals, ensuring you can act on market movements promptly, even when you’re not actively monitoring the charts
🟢 Pro Tips
Fine-tune loop parameters for optimal sensitivity:
→ Lower Loop Start (1-5) for more reactive analysis
→ Higher Loop Start (5-10) to filter out noise
Adjust probability calculation period:
→ Shorter lengths (5-10) for aggressive signals
→ Longer lengths (15-30) for trend confirmation
Strategy Enhancement:
→ Compare signals across multiple timeframes
→ Combine with volume for trade validation
→ Use with support/resistance levels for entry timing
→ Integrate other technical tools for even more comprehensive analysis
Trading!

Range Channel by Atilla YurtsevenThis script creates a dynamic channel around a user-selected moving average (MA). It calculates the relative difference between price and the MA, then finds the average of the positive differences and the negative differences separately. Using these averages, it plots upper and lower bands around the MA as well as a histogram-like oscillator to show when price moves above or below the average thresholds.
How It Works
Moving Average Selection
The indicator allows you to choose among multiple MA types (SMA, EMA, WMA, Linear Regression, etc.). Depending on your preference, it calculates the chosen MA for the selected lookback period.
Relative Difference Calculation
It then computes the percentage difference between the source (typically the closing price) and the MA. (diff = (src / ma - 1) * 100)
Positive & Negative Averages
- Positive differences are averaged and represent how far the price typically moves above the MA.
- Negative differences are similarly averaged for when price moves below the MA.
Range Channel & Oscillator
- The channel is plotted around the MA using the average positive and negative differences (Upper Edge and Lower Edge).
- The “Untrended” histogram plots the difference (diff). Green bars occur when price is above the MA on average, and red bars when below. Two additional lines mark the upper and lower average thresholds on this histogram.
How to Use
Identify Overbought/Oversold Zones: The upper edge can serve as a dynamic overbought level, while the lower edge can suggest potential oversold conditions. When the histogram approaches or crosses these levels, it may signal price extremes relative to its average movement.
Trend Confirmation: Compare price action relative to the channel. If price and the histogram consistently remain above the MA and upper threshold, it could indicate a stronger bullish trend. If they remain below, it might signal a prolonged bearish trend.
Entry/Exit Timings:
- Entry: Traders can look for moments when price breaks back inside the channel from an extreme, anticipating a mean reversion.
- Exit: Watching how price interacts with these dynamic edges can help define stop-loss or take-profit points.
Because these thresholds adapt over time based on actual price behavior, they can be more responsive than fixed-percentage bands. However, like all indicators, it’s most effective when used in conjunction with other technical and fundamental tools.
Disclaimer
This script is provided for educational and informational purposes only. It does not guarantee any specific outcome or profit. Use it at your own discretion and risk.
Trade smart, stay safe.
Atilla Yurtseven

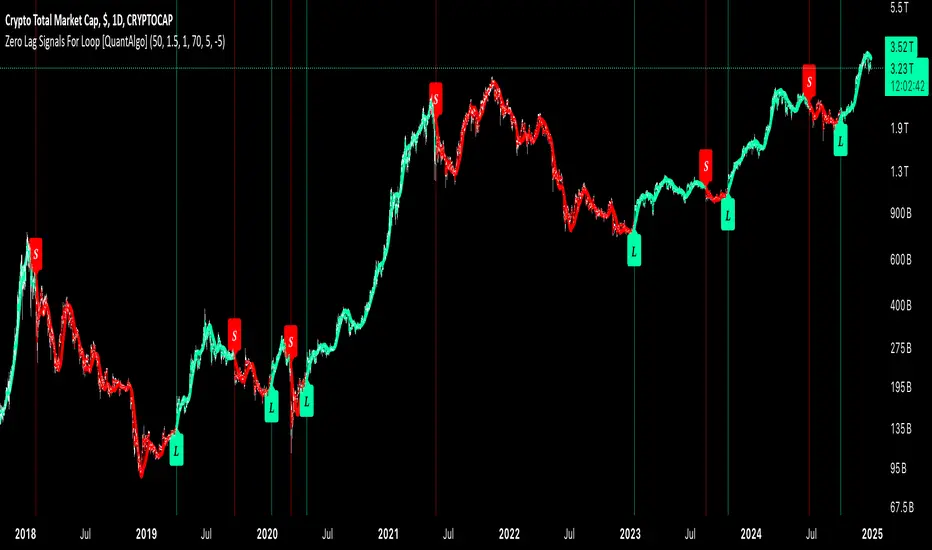
Zero Lag Signals For Loop [QuantAlgo]Elevate your trend-following investing and trading strategy with Zero Lag Signals For Loop by QuantAlgo , a simple yet effective technical indicator that merges advanced zero-lag mechanism with adaptive trend analysis to bring you a fresh take on market momentum tracking. Its aim is to support both medium- to long-term investors monitoring broader market shifts and precision-focused traders seeking quality entries through its dual-focused analysis approach!
🟢 Core Architecture
The foundation of this indicator rests on its zero-lag implementation and dynamic trend assessment. By utilizing a loop-driven scoring system alongside volatility-based filtering, each market movement is evaluated through multiple historical lenses while accounting for current market conditions. This multi-layered approach helps differentiate between genuine trend movements and market noise across timeframe and asset classes.
🟢 Technical Foundation
Three distinct components of this indicator are:
Zero Lag EMA : An enhanced moving average calculation designed to minimize traditional lag effects
For Loop Scoring System : A comprehensive scoring mechanism that weighs current price action against historical contexts
Dynamic Volatility Analysis : A sophisticated ATR-based filter that adjusts signal sensitivity to market conditions
🟢 Key Features & Signals
The Zero Lag Signals For Loop provides market insights through:
Color-coded Zero Lag line that adapts to trend direction
Dynamic fills between price and Zero Lag basis for enhanced visualization
Trend change markers (L/S) that highlight potential reversal points
Smart bar coloring that helps visualize market momentum
Background color changes with vertical lines at significant trend shifts
Customizable alerts for both bullish and bearish reversals
🟢 Practical Usage Tips
Here's how you can get the most out of the Zero Lag Signals For Loop :
1/ Setup:
Add the indicator to your TradingView chart by clicking on the star icon to add it to your favorites ⭐️
Start with the default Zero Lag length for balanced sensitivity
Use the standard volatility multiplier for proper filtering
Keep the default loop range for comprehensive trend analysis
Adjust threshold levels based on your investing and/or trading style
2/ Reading Signals:
Watch for L/S markers - they indicate validated trend reversals
Pay attention to Zero Lag line color changes - they confirm trend direction
Monitor bar colors for additional trend confirmation
Configure alerts for trend changes in both bullish and bearish directions, ensuring you can act on significant technical developments promptly.
🟢 Pro Tips
Fine-tune the Zero Lag length based on your timeframe:
→ Lower values (20-40) for more responsive signals
→ Higher values (60-100) for stronger trend confirmation
Adjust volatility multiplier based on market conditions:
→ Increase multiplier in volatile markets
→ Decrease multiplier in stable trending markets
Combine with:
→ Volume analysis for trade validation
→ Multiple timeframe analysis for broader context
→ Other technical tools for comprehensive analysis
Adaptive Trend Flow [QuantAlgo]Adaptive Trend Flow 📈🌊
The Adaptive Trend Flow by QuantAlgo is a sophisticated technical indicator that harnesses the power of volatility-adjusted EMAs to navigate market trends with precision. By seamlessly integrating a dynamic dual-EMA system with adaptive volatility bands, this premium tool enables traders and investors to identify and capitalize on sustained market moves while effectively filtering out noise. The indicator's unique approach to trend detection combines classical technical analysis with modern adaptive techniques, providing traders and investors with clear, actionable signals across various market conditions and asset class.
💫 Indicator Architecture
The Adaptive Trend Flow provides a sophisticated framework for assessing market trends through a harmonious blend of EMA dynamics and volatility-based boundary calculations. Unlike traditional moving average systems that use fixed parameters, this indicator incorporates smart volatility measurements to automatically adjust its sensitivity to market conditions. The core algorithm employs a dual EMA system combined with standard deviation-based volatility bands, creating a self-adjusting mechanism that expands and contracts based on market volatility. This adaptive approach allows the indicator to maintain its effectiveness across different market phases - from ranging to trending conditions. The volatility-adjusted bands act as dynamic support and resistance levels, while the gradient visualization system provides instant visual feedback on trend strength and duration.
📊 Technical Composition and Calculation
The Adaptive Trend Flow is composed of several technical components that create a dynamic trending system:
Dual EMA System: Utilizes fast and slow EMAs for primary trend detection
Volatility Integration: Computes and smooths volatility for adaptive band calculation
Dynamic Band Generation: Creates volatility-adjusted boundaries for trend validation
Gradient Visualization: Provides progressive visual feedback on trend strength
📈 Key Indicators and Features
The Adaptive Trend Flow utilizes customizable length parameters for both EMAs and volatility calculations to adapt to different trading styles. The trend detection component evaluates price action relative to the dynamic bands to validate signals and identify potential reversals.
The indicator incorporates multi-layered visualization with:
Color-coded basis and trend lines (bullish/bearish)
Adaptive volatility-based bands
Progressive gradient background for trend duration
Clear trend reversal signals (𝑳/𝑺)
Smooth fills between key levels
Programmable alerts for trend changes
⚡️ Practical Applications and Examples
✅ Add the Indicator: Add the indicator to your TradingView chart by clicking on the star icon to add it to your favorites ⭐️
👀 Monitor Trends: Watch the basis line and trend band interactions to identify trend direction and strength. The gradient background intensity indicates trend duration and conviction.
🎯 Track Signals: Pay attention to the trend reversal markers that appear on the chart:
→ Long signals (𝑳) appear when price action confirms a bullish trend reversal
→ Short signals (𝑺) indicate validated bearish trend reversals
🔔 Set Alerts: Configure alerts for trend changes in both bullish and bearish directions, ensuring you never miss significant technical developments.
🌟 Summary and Tips
The Adaptive Trend Flow by QuantAlgo is a sophisticated technical tool designed to support trend-following strategies across different market environments and asset class. By combining dual EMA analysis with volatility-adjusted bands, it helps traders and investors identify significant trend changes while filtering out market noise, providing validated signals. The tool's adaptability through customizable EMA lengths, volatility smoothing, and sensitivity settings makes it suitable for various trading timeframes and styles, allowing users to capture trending opportunities while maintaining protection against false signals.
Key parameters to optimize for your trading and/or investing style:
Main Length: Adjust for more or less sensitivity to trend changes (default: 10)
Smoothing Length: Fine-tune volatility calculations for signal stability (default: 14)
Sensitivity: Balance band width for trend validation (default: 2.0)
Visual Settings: Customize appearance with color and display options
The Adaptive Trend Flow is particularly effective for:
Identifying sustained market trends
Detecting trend reversals with confirmation
Measuring trend strength and duration
Filtering out market noise and false signals
Remember to:
Allow the indicator to validate trend changes before taking action
Use the gradient background to gauge trend strength
Combine with volume analysis for additional confirmation
Consider multiple timeframes for a complete market view
Adjust sensitivity based on market volatility conditions

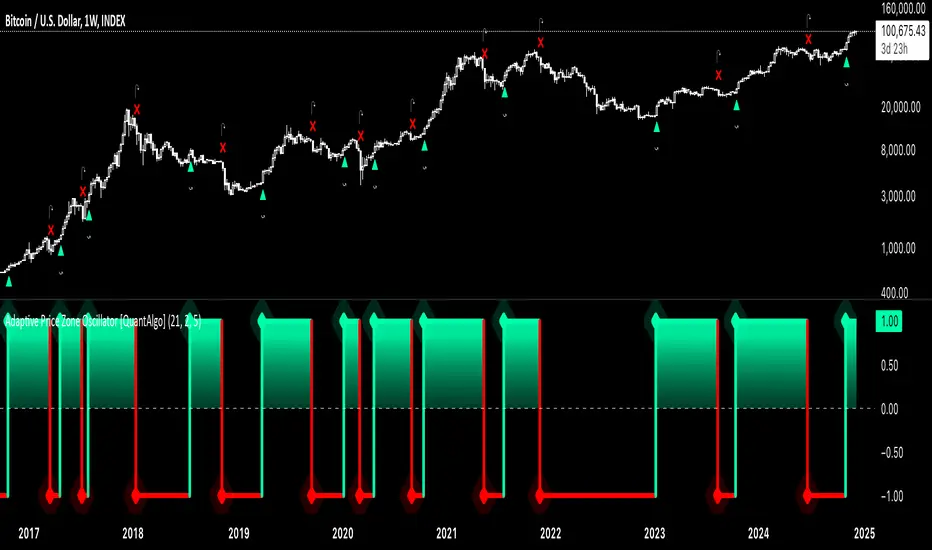
Adaptive Price Zone Oscillator [QuantAlgo]Adaptive Price Zone Oscillator 🎯📊
The Adaptive Price Zone (APZ) Oscillator by QuantAlgo is an advanced technical indicator designed to identify market trends and reversals through adaptive price zones based on volatility-adjusted bands. This sophisticated system combines typical price analysis with dynamic volatility measurements to help traders and investors identify trend direction, potential reversals, and market volatility conditions. By evaluating both price action and volatility together, this tool enables users to make informed trading decisions while adapting to changing market conditions.
💫 Dynamic Zone Architecture
The APZ Oscillator provides a unique framework for assessing market trends through a blend of smoothed typical prices and volatility-based calculations. Unlike traditional oscillators that use fixed parameters, this system incorporates dynamic volatility measurements to adjust sensitivity automatically, helping users determine whether price movements are significant relative to current market conditions. By combining smoothed price trends with adaptive volatility zones, it evaluates both directional movement and market volatility, while the smoothing parameters ensure stable yet responsive signals. This adaptive approach allows users to identify trending conditions while remaining aware of volatility expansions and contractions, enhancing both trend-following and mean-reversion strategies.
📊 Indicator Components & Mechanics
The APZ Oscillator is composed of several technical components that create a dynamic trending system:
Typical Price: Utilizes HLC3 (High, Low, Close average) as a balanced price representation
Volatility Measurement: Computes exponential moving average of price changes to determine dynamic zones
Smoothed Calculations: Applies additional smoothing to reduce noise while maintaining responsiveness
Trend Detection: Evaluates price position relative to adaptive zones to determine market direction
📈 Key Indicators and Features
The APZ Oscillator utilizes typical price with customizable length and threshold parameters to adapt to different trading styles. Volatility calculations are applied to determine zone boundaries, providing context-aware levels for trend identification. The trend detection component evaluates price action relative to the adaptive zones, helping validate trends and identify potential reversals.
The indicator also incorporates multi-layered visualization with:
Color-coded trend representation (bullish/bearish)
Clear trend state indicators (+1/-1)
Mean reversion signals with distinct markers
Gradient fills for better visual clarity
Programmable alerts for trend changes
⚡️ Practical Applications and Examples
✅ Add the Indicator : Add the indicator to your TradingView chart by clicking on the star icon to add it to your favorites ⭐️
👀 Monitor Trend State : Watch the oscillator's position relative to the zero line to identify trend direction and potential reversals. The step-line visualization with diamonds makes trend changes clearly visible.
🎯 Track Signals : Pay attention to the mean reversion markers that appear above and below the price chart:
→ Upward triangles (⤻) signal potential bullish reversals
→ X crosses (↷) indicate potential bearish reversals
🔔 Set Alerts : Configure alerts for trend changes in both bullish and bearish directions, ensuring you can act on significant technical developments promptly.
🌟 Summary and Tips
The Adaptive Price Zone Oscillator by QuantAlgo is a versatile technical tool, designed to support both trend following and mean reversion strategies across different market environments. By combining smoothed typical price analysis with dynamic volatility-based zones, it helps traders and investors identify significant trend changes while measuring market volatility, providing reliable technical signals. The tool's adaptability through customizable length, threshold, and smoothing parameters makes it suitable for various trading timeframes and styles, allowing users to capture opportunities while maintaining awareness of changing market conditions.
Key parameters to optimize for your trading style:
APZ Length: Adjust for more or less sensitivity to price changes
Threshold: Fine-tune the volatility multiplier for wider or narrower zones
Smoothing: Balance noise reduction with signal responsiveness
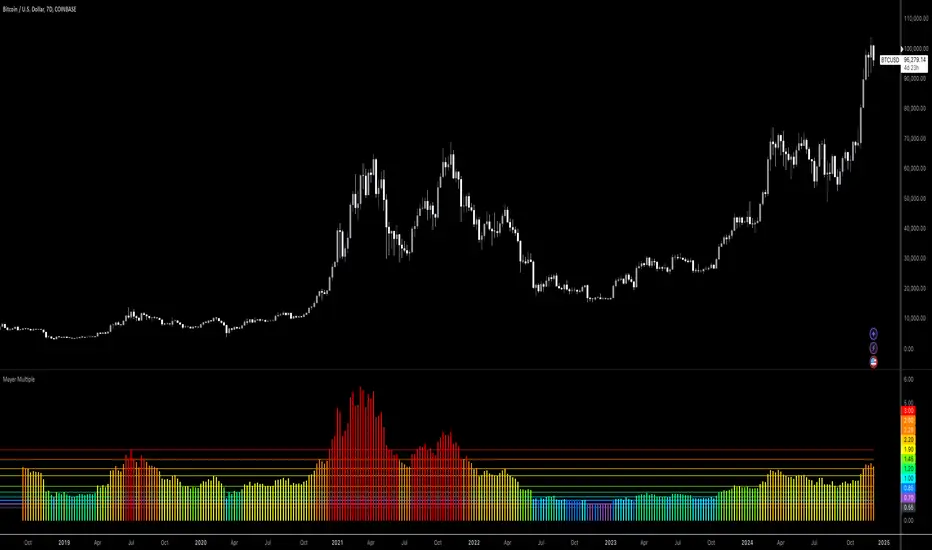
Bitcoin: Mayer MultipleMayer Multiple Indicator
The Mayer Multiple is a powerful tool designed to help traders assess market conditions and identify optimal buying or selling opportunities. It calculates the ratio between the current price and its 200-day simple moving average (SMA), visualizing key thresholds that indicate value zones, caution areas, and overheated markets.
Key Features:
Dynamic Market Zones: Clearly marked levels like "Smash Buy," "Boost DCA," and "Extreme Euphoria" to guide your trading decisions.
Customizable Input: Adjust the SMA length to fit your strategy.
Color-Coded Signals: Intuitive visualization of market sentiment for quick analysis.
Comprehensive Thresholds: Historical insights into price behavior with plotted reference levels based on probabilities.
This indicator is ideal for traders aiming to enhance their long-term strategies and improve decision-making in volatile markets. Use it to gain an edge in identifying potential turning points and managing risk effectively.
EMA Volatility Channel [QuantAlgo]EMA Volatility Channel 🌊📈
The EMA Volatility Channel by QuantAlgo is an advanced technical indicator designed to capture price volatility and trend dynamics through adaptive channels based on exponential moving averages. This sophisticated system combines EMA-based trend analysis with dynamic volatility-adjusted bands to help traders and investors identify trend direction, potential reversals, and market volatility conditions. By evaluating both price momentum and volatility together, this tool enables users to make informed trading decisions while adapting to changing market conditions.
💫 Dynamic Channel Architecture
The EMA Volatility Channel provides a unique framework for assessing market trends through a blend of exponential moving averages and volatility-based channel calculations. Unlike traditional channel indicators that use fixed-width bands, this system incorporates dynamic volatility measurements to adjust channel width automatically, helping users determine whether price movements are significant relative to current market conditions. By combining smooth EMA trends with adaptive volatility bands, it evaluates both directional movement and market volatility, while the smoothing parameters ensure stable yet responsive channel adjustments. This adaptive approach allows users to identify trending conditions while remaining aware of volatility expansions and contractions, enhancing both trend-following and reversal strategies.
📊 Indicator Components & Mechanics
The EMA Volatility Channel is composed of several technical components that create a dynamic channel system:
EMA Midline: Calculates a smoothed exponential moving average that serves as the channel's centerline, providing a clear reference for trend direction.
Volatility Measurement: Computes average price movement to determine dynamic channel width, adapting to changing market conditions automatically.
Smooth Band Calculation: Applies additional smoothing to the channel bands, reducing noise while maintaining responsiveness to significant price movements.
📈 Key Indicators and Features
The EMA Volatility Channel combines various technical tools to deliver a comprehensive analysis of market conditions.
The indicator utilizes exponential moving averages with customizable length and smoothing parameters to adapt to different trading styles. Volatility calculations are applied to determine channel width, providing context-aware boundaries for price movement. The trend detection component evaluates price action relative to the channel bands, helping validate trends and identify potential reversals.
The indicator incorporates multi-layered visualization with color-coded channels and bars to signal both trend direction and market position. These adaptive visual cues, combined with programmable alerts for channel breakouts, help traders and investors track both trend changes and volatility conditions, supporting both trend-following and mean-reversion strategies.
⚡️ Practical Applications and Examples
✅ Add the Indicator: Add the indicator to your TradingView chart by clicking on the star icon to add it to your favorites ⭐️
👀 Monitor Channel Position: Watch the price position relative to the channel bands to identify trend direction and potential reversals. When price moves outside the channel, consider potential trend changes or extreme conditions.
🔔 Set Alerts: Configure alerts for channel breakouts and trend changes, ensuring you can act on significant technical developments promptly.
🌟 Summary and Tips
The EMA Volatility Channel by QuantAlgo is a versatile technical tool, designed to support both trend following and volatility analysis across different market environments. By combining smooth EMA trends with dynamic volatility-based channels, it helps traders and investors identify significant price movements while measuring market volatility, providing reliable technical signals. The tool's adaptability across timeframes makes it suitable for both trend-following and reversal strategies, allowing users to capture opportunities while maintaining awareness of changing market conditions.

Adapted RSI w/ Multi-Asset Regime Detection v1.1The relative strength index (RSI) is a momentum indicator used in technical analysis. RSI measures the speed and magnitude of an asset's recent price changes to detect overbought or oversold conditions in the price of said asset.
In addition to identifying overbought and oversold assets, the RSI can also indicate whether your desired asset may be primed for a trend reversal or a corrective pullback in price. It can signal when to buy and sell.
The RSI will oscillate between 0 and 100. Traditionally, an RSI reading of 70 or above indicates an overbought condition. A reading of 30 or below indicates an oversold condition.
The RSI is one of the most popular technical indicators. I intend to offer a fresh spin.
Adapted RSI w/ Multi-Asset Regime Detection
Our Adapted RSI makes necessary improvements to the original Relative Strength Index (RSI) by combining multi-timeframe analysis with multi-asset monitoring and providing traders with an efficient way to analyse market-wide conditions across different timeframes and assets simultaneously. The indicator automatically detects market regimes and generates clear signals based on RSI levels, presenting this data in an organised, easy-to-read format through two dynamic tables. Simplicity is key, and having access to more RSI data at any given time, allows traders to prepare more effectively, especially when trading markets that "move" together.
How we calculate the RSI
First, the RSI identifies price changes between periods, calculating gains and losses from one look-back period to the next. This look-back period averages gains and losses over 14 periods, which in this case would be 14 days, and those gains/losses are calculated based on the daily closing price. For example:
Average Gain = Sum of Gains over the past 14 days / 14
Average Loss = Sum of Losses over the past 14 days / 14
Then we calculate the Relative Strength (RS):
RS = Average Gain / Average Loss
Finally, this is converted to the RSI value:
RSI = 100 - (100 / (1 + RS))
Key Features
Our multi-timeframe RSI indicator enhances traditional technical analysis by offering synchronised Daily, Weekly, and Monthly RSI readings with automatic regime detection. The multi-asset monitoring system allows tracking of up to 10 different assets simultaneously, with pre-configured major pairs that can be customised to any asset selection. The signal generation system provides clear market guidance through automatic regime detection and a five-level signal system, all presented through a sophisticated visual interface with dynamic RSI line colouring and customisable display options.
Quick Guide to Use it
Begin by adding the indicator to your chart and configuring your preferred assets in the "Asset Comparison" settings.
Position the two information tables according to your preference.
The main table displays RSI analysis across three timeframes for your current asset, while the asset table shows a comparative analysis of all monitored assets.
Signals are colour-coded for instant recognition, with green indicating bullish conditions and red for bearish conditions. Pay special attention to regime changes and signal transitions, using multi-timeframe confluence to identify stronger signals.
How it Works (Regime Detection & Signals)
When we say 'Regime', a regime is determined by a persistent trend or in this case momentum and by leveraging this for RSI, which is a momentum oscillator, our indicator employs a relatively simple regime detection system that classifies market conditions as either Bullish (RSI > 50) or Bearish (RSI < 50). Our benchmark between a trending bullish or bearish market is equal to 50. By leveraging a simple classification system helps determine the probability of trend continuation and the weight given to various signals. Whilst we could determine a Neutral regime for consolidating markets, we have employed a 'neutral' signal generation which will be further discussed below...
Signal generation occurs across five distinct levels:
Strong Buy (RSI < 15)
Buy (RSI < 30)
Neutral (RSI 30-70)
Sell (RSI > 70)
Strong Sell (RSI > 85)
Each level represents different market conditions and probability scenarios. For instance, extreme readings (Strong Buy/Sell) indicate the highest probability of mean reversion, while neutral readings suggest equilibrium conditions where traders should focus on the overall regime bias (Bullish/Bearish momentum).
This approach offers traders a new and fresh spin on a popular and well-known tool in technical analysis, allowing traders to make better and more informed decisions from the well presented information across multiple assets and timeframes. Experienced and beginner traders alike, I hope you enjoy this adaptation.

simple swing indicator-KTRNSE:NIFTY
1. Pivot High/Low as Lines:
Purpose: Identifies local peaks (pivot highs) and troughs (pivot lows) in price and draws horizontal lines at these levels.
How it Works:
A pivot high occurs when the price is higher than the surrounding bars (based on the pivotLength parameter).
A pivot low occurs when the price is lower than the surrounding bars.
These pivots are drawn as horizontal lines at the price level of the pivot.
Visualization:
Pivot High: A red horizontal line is drawn at the price level of the pivot high.
Pivot Low: A green horizontal line is drawn at the price level of the pivot low.
Example:
Imagine the price is trending up, and at some point, it forms a peak. The script identifies this peak as a pivot high and draws a red line at the price of that peak. Similarly, if the price forms a trough, the script will draw a green line at the low point.
2. Moving Averages (20-day and 50-day):
Purpose: Plots the 20-day and 50-day simple moving averages (SMA) on the chart.
How it Works:
The 20-day SMA smooths the closing price over the last 20 days.
The 50-day SMA smooths the closing price over the last 50 days.
These lines provide an overview of short-term and long-term price trends.
Visualization:
20-day SMA: A blue line showing the 20-day moving average.
50-day SMA: An orange line showing the 50-day moving average.
Example:
When the price is above both moving averages, it indicates an uptrend. If the price crosses below these averages, it might signal a downtrend.
3. Supertrend:
Purpose: The Supertrend is an indicator based on the Average True Range (ATR) and is used to track the market trend.
How it Works:
When the market is in an uptrend, the Supertrend line will be green.
When the market is in a downtrend, the Supertrend line will be red.
Visualization:
Uptrend: The Supertrend line will be plotted in green.
Downtrend: The Supertrend line will be plotted in red.
Example:
If the price is above the Supertrend, the market is considered to be in an uptrend, and if the price is below the Supertrend, the market is in a downtrend.
4. Momentum (Rate of Change):
Purpose: Measures the rate at which the price changes over a set period, showing if the momentum is positive or negative.
How it Works:
The Rate of Change (ROC) measures how much the price has changed over a certain number of periods (e.g., 14).
Positive ROC indicates upward momentum, and negative ROC indicates downward momentum.
Visualization:
Positive ROC: A purple line is plotted above the zero line.
Negative ROC: A purple line is plotted below the zero line.
Example:
If the ROC line is above zero, it means the price is increasing, suggesting bullish momentum. If the ROC is below zero, it indicates bearish momentum.
5. Volume:
Purpose: Displays the volume of traded assets, giving insight into the strength of price movements.
How it Works:
The script will color the volume bars based on whether the price closed higher or lower than the previous bar.
Green bars indicate bullish volume (closing price higher than the previous bar), and red bars indicate bearish volume (closing price lower than the previous bar).
Visualization:
Bullish Volume: Green volume bars when the price closes higher.
Bearish Volume: Red volume bars when the price closes lower.
Example:
If you see a green volume bar, it suggests that the market is participating in an uptrend, and the price has closed higher than the previous period. Red bars indicate a downtrend or selling pressure.
6. MACD (Moving Average Convergence Divergence):
Purpose: The MACD is a trend-following momentum indicator that shows the relationship between two moving averages of the price.
How it Works:
The MACD Line is the difference between the 12-period EMA (Exponential Moving Average) and the 26-period EMA.
The Signal Line is the 9-period EMA of the MACD Line.
The MACD Histogram shows the difference between the MACD line and the Signal line.
Visualization:
MACD Line: A blue line representing the difference between the 12-period and 26-period EMAs.
Signal Line: An orange line representing the 9-period EMA of the MACD line.
MACD Histogram: A red or green histogram that shows the difference between the MACD line and the Signal line.
Example:
When the MACD line crosses above the Signal line, it’s considered a bullish signal. When the MACD line crosses below the Signal line, it’s considered a bearish signal.
Full Chart Example:
Imagine you're looking at a price chart with all the indicators:
Pivot High/Low Lines are drawn as red and green horizontal lines.
20-day and 50-day SMAs are plotted as blue and orange lines, respectively.
Supertrend shows a green or red line indicating the trend.
Momentum (ROC) is shown as a purple line oscillating around zero.
Volume bars are green or red based on whether the close is higher or lower.
MACD appears as a blue line and orange line, with a red or green histogram showing the MACD vs. Signal line difference.
How the Indicators Work Together:
Trend Confirmation: If the price is above the Supertrend line and both SMAs are trending up, it indicates a strong bullish trend.
Momentum: If the ROC is positive and the MACD line is above the Signal line, it further confirms bullish momentum.
Volume: Increasing volume, especially with green bars, suggests that the trend is being supported by active participation.
By using these combined indicators, you can get a comprehensive view of the market's trend, momentum, and potential reversal points (via pivot highs and lows).

Simple Moving Average with Regime Detection by iGrey.TradingThis indicator helps traders identify market regimes using the powerful combination of 50 and 200 SMAs. It provides clear visual signals and detailed metrics for trend-following strategies.
Key Features:
- Dual SMA System (50/200) for regime identification
- Colour-coded candles for easy trend visualisation
- Metrics dashboard
Core Signals:
- Bullish Regime: Price < 200 SMA
- Bearish Regime: Price > 200 SMA
- Additional confirmation: 50 SMA Cross-over or Cross-under (golden cross or death cross)
Metrics Dashboard:
- Current Regime Status (Bull/Bear)
- SMA Distance (% from price to 50 SMA)
- Regime Distance (% from price to 200 SMA)
- Regime Duration (bars in current regime)
Usage Instructions:
1. Apply the indicator to your chart
2. Configure the SMA lengths if desired (default: 50/200)
3. Monitor the color-coded candles:
- Green: Bullish regime
- Red: Bearish regime
4. Use the metrics dashboard for detailed analysis
Settings Guide:
- Length: Short-term SMA period (default: 50)
- Source: Price calculation source (default: close)
- Regime Filter Length: Long-term SMA period (default: 200)
- Regime Filter Source: Price source for regime calculation (default: close)
Trading Tips:
- Use bullish regimes for long positions
- Use bearish regimes for capital preservation or short positions
- Consider regime duration for trend strength
- Monitor distance metrics for potential reversals
- Combine with other systems for confluence
#trend-following #moving average #regime #sma #momentum
Risk Management:
- Not a standalone trading system
- Should be used with proper position sizing
- Consider market conditions and volatility
- Always use stop losses
Best Practices:
- Monitor multiple timeframes
- Use with other confirmation tools
- Consider fundamental factors
Version: 1.0
Created by: iGREY.Trading
Release Notes
// v1.1 Allows table overlay customisation
// v1.2 Update to v6 pinescript

GP - SRSI ChannelGP - SRSI Channel Indicator
The GP - SRSI Channel is a channel indicator derived from the Stochastic RSI (SRSI) oscillator. It combines SRSI data from multiple timeframes to analyze minimum, maximum, and closing values, forming a channel based on these calculations. The goal is to identify overbought and oversold zones with color coding and highlight potential trading opportunities by indicating trend reversal points.
How It Works
SRSI Calculation: The indicator calculates the Stochastic RSI values using open, high, low, and close prices from the selected timeframes.
Channel Creation: Minimum and maximum values derived from these calculations are combined across multiple timeframes. The midpoint is calculated as the average of these values.
Color Coding: Zones within the channel are color-coded with a gradient from red to green based on the ratios. Green zones typically indicate selling opportunities, while red zones suggest buying opportunities.
Visual Elements:
The channel boundaries (min/max) are displayed as lines.
Overbought/oversold regions (95-100 and 0-5) are highlighted with shaded areas.
Additional explanatory labels are placed on key levels to guide users.
How to Use
Trading Strategy: This indicator can be used for both trend following and identifying reversal points. Selling opportunities can be evaluated when the channel reaches the upper green zone, while buying opportunities can be considered in the lower red zone.
Timeframe Selection: Users can analyze multiple timeframes simultaneously to gain a broader perspective.
Customization: RSI and Stochastic RSI parameters are adjustable, allowing users to tailor the indicator to their trading strategies.
Important Note
This indicator is for informational purposes only and should not be used as a sole basis for trading decisions. Please validate the results of the indicator with your own analysis.

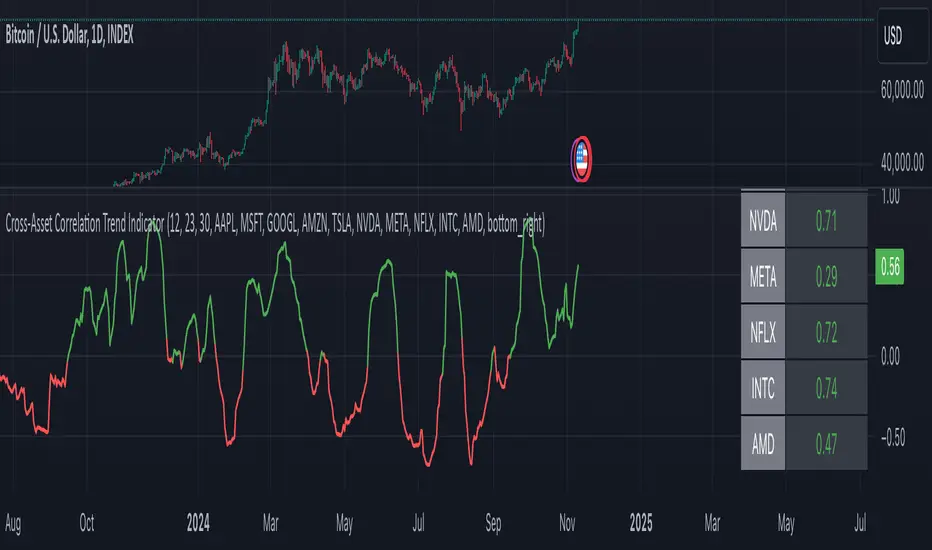
Cross-Asset Correlation Trend IndicatorCross-Asset Correlation Trend Indicator
This indicator uses correlations between the charted asset and ten others to calculate an overall trend prediction. Each ticker is configurable, and by analyzing the trend of each asset, the indicator predicts an average trend for the main asset on the chart. The strength of each asset's trend is weighted by its correlation to the charted asset, resulting in a single average trend signal. This can be a rather robust and effective signal, though it is often slow.
Functionality Overview :
The Cross-Asset Correlation Trend Indicator calculates the average trend of a charted asset based on the correlation and trend of up to ten other assets. Each asset is assigned a trend signal using a simple EMA crossover method (two customizable EMAs). If the shorter EMA crosses above the longer one, the asset trend is marked as positive; if it crosses below, the trend is negative. Each trend is then weighted by the correlation coefficient between that asset’s closing price and the charted asset’s closing price. The final output is an average weighted trend signal, which combines each trend with its respective correlation weight.
Input Parameters :
EMA 1 Length : Sets the period of the shorter EMA used to determine trends.
EMA 2 Length : Sets the period of the longer EMA used to determine trends.
Correlation Length : Defines the lookback period used for calculating the correlation between the charted asset and each of the other selected assets.
Asset Tickers : Each of the ten tickers is configurable, allowing you to set specific assets to analyze correlations with the charted asset.
Show Trend Table : Toggle to show or hide a table with each asset’s weighted trend. The table displays green, red, or white text for each weighted trend, indicating positive, negative, or neutral trends, respectively.
Table Position : Choose the position of the trend table on the chart.
Recommended Use :
As always, it’s essential to backtest the indicator thoroughly on your chosen asset and timeframe to ensure it aligns with your strategy. Feel free to modify the input parameters as needed—while the defaults work well for me, they may need adjustment to better suit your assets, timeframes, and trading style.
As always, I wish you the best of luck and immense fortune as you develop your systems. May this indicator help you make well-informed, profitable decisions!
Dynamic Score SMA [QuantAlgo]Dynamic Score SMA 📈🌊
The Dynamic Score SMA by QuantAlgo offers a powerful trend-following approach that combines the simplicity of the Simple Moving Average (SMA) with an innovative dynamic trend scoring technique . By continuously evaluating price movement relative to the SMA over a customizable window, this indicator adapts to varying market conditions, providing traders and investors with clearer, more adaptable trend signals. With this dynamic scoring approach, the Dynamic Score SMA helps identify trend shifts, allowing for more strategic decision-making.
🌟 Conceptual Foundation and Innovation
At the core of the Dynamic Score SMA is its dynamic trend score system , which assesses price movements by comparing them to the SMA over a series of historical data points. This technique goes beyond traditional SMA indicators by offering a dynamic, probabilistic evaluation of trend strength, delivering a more responsive and nuanced view of market direction. The integration of this scoring system enables traders and investors to navigate both trending and sideway markets with greater confidence and precision.
⚙️ Technical Composition and Calculation
The Dynamic Score SMA leverages the Simple Moving Average to establish a baseline trend, with customizable SMA length to control the indicator’s sensitivity. The dynamic trend scoring technique then evaluates price behavior relative to the SMA over a specified window, generating a trend score that reflects the current market bias.
When the score crosses the designated uptrend or downtrend thresholds, the indicator signals a potential trend shift. By adjusting the SMA length, window duration, and thresholds, users can refine the indicator’s responsiveness to match their preferred trading or investing strategy, making it suitable for both volatile and steady markets.
📈 Features and Practical Applications
Customizable SMA Length: Set the length of the SMA to control how sensitive the trend is to price changes. Longer lengths produce smoother trends, while shorter lengths increase responsiveness.
Window Length for Dynamic Scoring: Adjust the window length to determine how many data points are considered in the dynamic trend score calculation, allowing for more tailored analysis of recent versus long-term trends.
Uptrend/Downtrend Thresholds: Define thresholds for triggering trend signals. Higher thresholds reduce sensitivity, providing clearer signals in volatile markets, while lower thresholds capture shorter-term movements.
Bar and Background Coloring: Visual cues, including bar coloring and background fills, provide a quick reference for current trend direction, making it easier to monitor market conditions.
Trend Confirmation: The dynamic trend scoring system verifies trend strength, offering more reliable entry and exit points by filtering out potential false signals.
⚡️ How to Use
✅ Add the Indicator: Add the Dynamic Score SMA to your favourites, then apply it to your chart. Customize the SMA length, window size, and thresholds to match your trading or investing preferences.
👀 Monitor Trend Shifts: Observe the trend in relation to the SMA and watch for signals when the score crosses key thresholds. Bar and/or background coloring will help identify the current trend direction and any shifts in momentum.
🔔 Set Alerts: Configure alerts for significant trend crossovers and reversals, enabling you to act on market changes in real-time without needing constant chart observation.
💫 Summary and Usage Tips
The Dynamic Score SMA by QuantAlgo is a sophisticated trend-following indicator that combines the familiarity of the SMA with a dynamic trend scoring system, providing a more adaptable and probabilistic approach to trend analysis. By tailoring the SMA length, scoring window, and thresholds, traders and investors can fine-tune the indicator for both short-term adjustments and long-term trend following. For optimal use, adjust sensitivity based on market volatility, and rely on the visual cues for clear trend confirmation. Whether you’re navigating choppy markets or stable trends, the Dynamic Score SMA offers a refined approach to capturing market direction with enhanced precision.

Dynamic Score Supertrend [QuantAlgo]Dynamic Score Supertrend 📈🚀
The Dynamic Score Supertrend by QuantAlgo introduces a sophisticated trend-following tool that combines the well-known Supertrend indicator with an innovative dynamic trend scoring technique . By tracking market momentum through a scoring system that evaluates price behavior over a customizable window, this indicator adapts to changing market conditions. The result is a clearer, more adaptive tool that helps traders and investors detect and capitalize on trend shifts with greater precision.
💫 Conceptual Foundation and Innovation
At the core of the Dynamic Score Supertrend is the dynamic trend score system , which measures price movements relative to the Supertrend’s upper and lower bands. This scoring technique adds a layer of trend validation, assessing the strength of price trends over time. Unlike traditional Supertrend indicators that rely solely on ATR calculations, this system incorporates a scoring mechanism that provides more insight into trend direction, allowing traders and investors to navigate both trending and choppy markets with greater confidence.
✨ Technical Composition and Calculation
The Dynamic Score Supertrend utilizes the Average True Range (ATR) to calculate the upper and lower Supertrend bands. The dynamic trend scoring technique then compares the price to these bands over a customizable window, generating a trend score that reflects the current market direction.
When the score exceeds the uptrend or downtrend thresholds, it signals a possible shift in market direction. By adjusting the ATR settings and window length, the indicator becomes more adaptable to different market conditions, from steady trends to periods of higher volatility. This customization allows users to refine the Supertrend’s sensitivity and responsiveness based on their trading or investing style.
📈 Features and Practical Applications
Customizable ATR Settings: Adjust the ATR length and multiplier to control the sensitivity of the Supertrend bands. This allows the indicator to smooth out noise or react more quickly to price shifts, depending on market conditions.
Window Length for Dynamic Scoring: Modify the window length to adjust how many data points the scoring system considers, allowing you to tailor the indicator’s responsiveness to short-term or long-term trends.
Uptrend/Downtrend Thresholds: Set thresholds for identifying trend signals. Increase these thresholds for more reliable signals in choppy markets, or lower them for more aggressive entry points in trending markets.
Bar and Background Coloring: Visual cues such as bar coloring and background fills highlight the direction of the current trend, making it easier to spot potential reversals and trend shifts.
Trend Confirmation: The dynamic trend score system provides a clearer confirmation of trend strength, helping you identify strong, sustained movements while filtering out false signals.
⚡️ How to Use
✅ Add the Indicator: Add the Dynamic Score Supertrend to your favourites, then apply it to your chart. Adjust the ATR length, multiplier, and dynamic score settings to suit your trading or investing strategy.
👀 Monitor Trend Shifts: Track price movements relative to the Supertrend bands and use the dynamic trend score to confirm the strength of a trend. Bar and background colors make it easy to visualize key trend shifts.
🔔 Set Alerts: Configure alerts when the dynamic trend score crosses key thresholds, so you can act on significant trend changes without constantly monitoring the charts.
🌟 Summary and Usage Tips
The Dynamic Score Supertrend by QuantAlgo is a robust trend-following tool that combines the power of the Supertrend with an advanced dynamic scoring system. This approach provides more adaptable and reliable trend signals, helping traders and investors make informed decisions in trending markets. The customizable ATR settings and scoring thresholds make it versatile across various market conditions, allowing you to fine-tune the indicator for both short-term momentum and long-term trend following. To maximize its effectiveness, adjust the settings based on current market volatility and use the visual cues to confirm trend shifts. The Dynamic Score Supertrend offers a refined, probabilistic approach to trading and investing, making it a valuable addition to your toolkit.

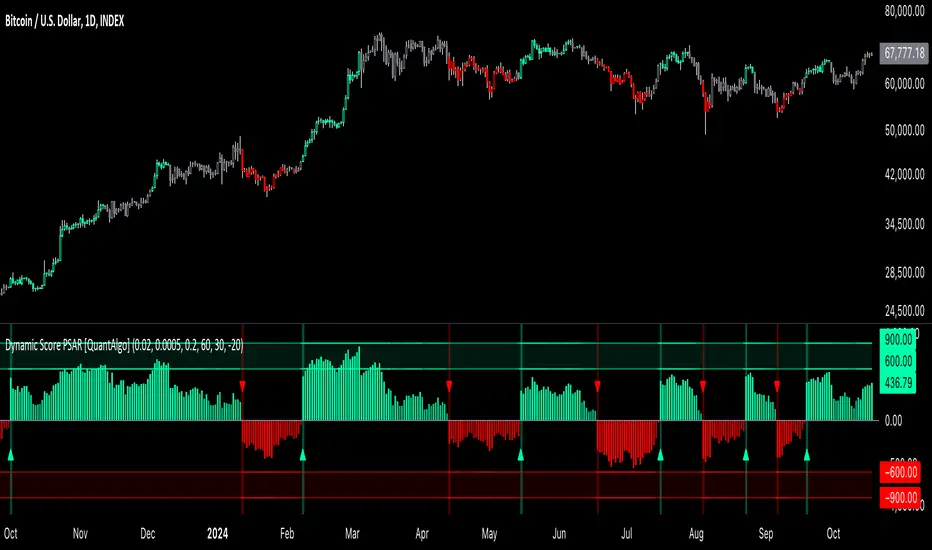
Dynamic Score PSAR [QuantAlgo]Dynamic Score PSAR 📈🧬
The Dynamic Score PSAR by QuantAlgo introduces an innovative approach to trend detection by utilizing a dynamic trend scoring technique in combination with the Parabolic SAR. This method goes beyond traditional trend-following indicators by evaluating market momentum through a scoring system that analyzes price behavior over a customizable window. By dynamically adjusting to evolving market conditions, this indicator provides clearer, more adaptive trend signals that help traders and investors anticipate market reversals and capitalize on momentum shifts with greater precision.
💫 Conceptual Foundation and Innovation
At the core of the Dynamic Score PSAR is the dynamic trend score system, which assesses price movements by comparing normalized PSAR values across a range of historical data points. This dynamic trend scoring technique offers a unique, probabilistic approach to trend analysis by evaluating how the current market compares to past price movements. Unlike traditional PSAR indicators that rely on static parameters, this scoring mechanism allows the indicator to adjust in real time to market fluctuations, offering traders and investors a more responsive and insightful view of trends. This innovation makes the Dynamic Score PSAR particularly effective in detecting shifts in momentum and potential reversals, even in volatile or complex market environments.
✨ Technical Composition and Calculation
The Dynamic Score PSAR is composed of several advanced components designed to provide a higher probability of detecting accurate trend shifts. The key innovation lies in the dynamic trend scoring technique, which iterates over historical PSAR values and evaluates price momentum through a dynamic scoring system. By comparing the current normalized PSAR value with previous data points over a user-defined window, the system generates a score that reflects the strength and direction of the trend. This allows for a more refined and responsive detection of trends compared to static, traditional indicators.
To enhance clarity, the PSAR values are normalized against an Exponential Moving Average (EMA), providing a standardized framework for comparison. This normalization ensures that the indicator adapts dynamically to market conditions, making it more effective in volatile markets. The smoothing process reduces noise, helping traders and investors focus on significant trend signals.
Additionally, users can adjust the length of the data window and the sensitivity thresholds for detecting uptrends and downtrends, providing flexibility for different trading and investing environments.
📈 Features and Practical Applications
Customizable Window Length: Adjust the window length to control the indicator’s sensitivity to recent price movements. This provides flexibility for short-term or long-term trend analysis.
Uptrend/Downtrend Thresholds: Set customizable thresholds for identifying uptrends and downtrends. These thresholds define when trend signals are triggered, offering adaptability to different market conditions.
Bar Coloring and Gradient Visualization: Visual cues, including color-coded bars and gradient fills, make it easier to interpret market trends and identify key moments for potential trend reversals.
Momentum Confirmation: The dynamic trend scoring system evaluates price action over time, providing a probabilistic measure of market momentum to confirm the strength and direction of a trend.
⚡️ How to Use
✅ Add the Indicator: Add the Dynamic Score PSAR to your favourites, then to your chart and adjust the PSAR settings, window length, and trend thresholds to match your preferences. Customize the sensitivity to price movements by tweaking the window length and thresholds for different market conditions.
👀 Monitor Trend Shifts: Watch for trend changes as the normalized PSAR values cross key thresholds, and use the dynamic score to confirm the strength and direction of trends. Bar coloring and background fills visually highlight key moments for trend shifts, making it easier to spot reversals.
🔔 Set Alerts: Configure alerts for significant trend crossovers and reversals, ensuring you can act on market movements promptly, even when you’re not actively monitoring the charts.
🌟 Summary and Usage Tips
The Dynamic Score PSAR by QuantAlgo is a powerful tool that combines traditional trend-following techniques with the flexibility of a dynamic trend scoring system. This innovative approach provides clearer, more adaptive trend signals, reducing the risk of false entries and exits while helping traders and investors capture significant market moves. The ability to adjust the indicator’s sensitivity and thresholds makes it versatile across different trading and investing environments, whether you’re focused on short-term pivots or long-term trend reversals. To maximize its effectiveness, fine-tune the sensitivity settings based on current market conditions and use the visual cues to confirm trend shifts.
Unlock the Power of Seasonality: Monthly Performance StrategyThe Monthly Performance Strategy leverages the power of seasonality—those cyclical patterns that emerge in financial markets at specific times of the year. From tax deadlines to industry-specific events and global holidays, historical data shows that certain months can offer strong opportunities for trading. This strategy was designed to help traders capture those opportunities and take advantage of recurring market patterns through an automated and highly customizable approach.
The Inspiration Behind the Strategy:
This strategy began with the idea that market performance is often influenced by seasonal factors. Historically, certain months outperform others due to a variety of reasons, like earnings reports, holiday shopping, or fiscal year-end events. By identifying these periods, traders can better time their market entries and exits, giving them an advantage over those who solely rely on technical indicators or news events.
The Monthly Performance Strategy was built to take this concept and automate it. Instead of manually analyzing market data for each month, this strategy enables you to select which months you want to focus on and then executes trades based on predefined rules, saving you time and optimizing the performance of your trades.
Key Features:
Customizable Month Selection: The strategy allows traders to choose specific months to test or trade on. You can select any combination of months—for example, January, July, and December—to focus on based on historical trends. Whether you’re targeting the historically strong months like December (often driven by the 'Santa Rally') or analyzing quieter months for low volatility trades, this strategy gives you full control.
Automated Monthly Entries and Exits: The strategy automatically enters a long position on the first day of your selected month(s) and exits the trade at the beginning of the next month. This makes it perfect for traders who want to benefit from seasonal patterns without manually monitoring the market. It ensures precision in entering and exiting trades based on pre-set timeframes.
Re-entry on Stop Loss or Take Profit: One of the standout features of this strategy is its ability to re-enter a trade if a position hits the stop loss (SL) or take profit (TP) level during the selected month. If your trade reaches either a SL or TP before the month ends, the strategy will automatically re-enter a new trade the next trading day. This feature ensures that you capture multiple trading opportunities within the same month, instead of exiting entirely after a successful or unsuccessful trade. Essentially, it keeps your capital working for you throughout the entire month, not just when conditions align perfectly at the beginning.
Built-in Risk Management: Risk management is a vital part of this strategy. It incorporates an Average True Range (ATR)-based stop loss and take profit system. The ATR helps set dynamic levels based on the market’s volatility, ensuring that your stops and targets adjust to changing market conditions. This not only helps limit potential losses but also maximizes profit potential by adapting to market behavior.
Historical Performance Testing: You can backtest this strategy on any period by setting the start year. This allows traders to analyze past market data and optimize their strategy based on historical performance. You can fine-tune which months to trade based on years of data, helping you identify trends and patterns that provide the best trading results.
Versatility Across Asset Classes: While this strategy can be particularly effective for stock market indices and sector rotation, it’s versatile enough to apply to other asset classes like forex, commodities, and even cryptocurrencies. Each asset class may exhibit different seasonal behaviors, allowing you to explore opportunities across various markets with this strategy.
How It Works:
The trader selects which months to test or trade, for example, January, April, and October.
The strategy will automatically open a long position on the first trading day of each selected month.
If the trade hits either the take profit or stop loss within the month, the strategy will close the current position and re-enter a new trade on the next trading day, provided the month has not yet ended. This ensures that the strategy continues to capture any potential gains throughout the month, rather than stopping after one successful trade.
At the start of the next month, the position is closed, and if the next month is also selected, a new trade is initiated following the same process.
Risk Management and Dynamic Adjustments:
Incorporating risk management with this strategy is as easy as turning on the ATR-based system. The strategy will automatically calculate stop loss and take profit levels based on the market’s current volatility, adjusting dynamically to the conditions. This ensures that the risk is controlled while allowing for flexibility in capturing profits during both high and low volatility periods.
Maximizing the Seasonal Edge:
By automating entries and exits based on specific months and combining that with dynamic risk management, the Ultimate Monthly Performance Strategy takes advantage of seasonal patterns without requiring constant monitoring. The added re-entry feature after hitting a stop loss or take profit ensures that you are always in the game, maximizing your chances to capture profitable trades during favorable seasonal periods.
Who Can Benefit from This Strategy?
This strategy is perfect for traders who:
Want to exploit the predictable, recurring patterns that occur during specific months of the year.
Prefer a hands-off, automated trading approach that allows them to focus on other aspects of their portfolio or life.
Seek to manage risk effectively with ATR-based stop losses and take profits that adjust to market conditions.
Appreciate the ability to re-enter trades when a take profit or stop loss is hit within the month, ensuring that they don't miss out on multiple opportunities during a favorable period.
In summary, the Ultimate Monthly Performance Strategy provides traders with a comprehensive tool to capitalize on seasonal trends, optimize their trading opportunities throughout the year, and manage risk effectively. The built-in re-entry system ensures you continue to benefit from the market even after hitting targets within the same month, making it a robust strategy for traders looking to maximize their edge in any market.
Risk Disclaimer:
Trading financial markets involves significant risk and may not be suitable for all investors. The Monthly Performance Strategy is designed to help traders identify seasonal trends, but past performance does not guarantee future results. It is important to carefully consider your risk tolerance, financial situation, and trading goals before using any strategy. Always use appropriate risk management and consult with a professional financial advisor if necessary. The use of this strategy does not eliminate the risk of losses, and traders should be prepared for the possibility of losing their entire investment. Be sure to test the strategy on a demo account before applying it in live markets.

Adaptive Volatility-Controlled LSMA [QuantAlgo]Adaptive Volatility-Controlled LSMA by QuantAlgo 📈💫
Introducing the Adaptive Volatility-Controlled LSMA (Least Squares Moving Average) , a powerful trend-following indicator that combines trend detection with dynamic volatility adjustments. This indicator is designed to help traders and investors identify market trends while accounting for price volatility, making it suitable for a wide range of assets and timeframes. By integrating LSMA for trend analysis and Average True Range (ATR) for volatility control, this tool provides clearer signals during both trending and volatile market conditions.
💡 Core Concept and Innovation
The Adaptive Volatility-Controlled LSMA leverages the precision of the LSMA to track market trends and combines it with the sensitivity of the ATR to account for market volatility. LSMA fits a linear regression line to price data, providing a smoothed trend line that is less reactive to short-term noise. The ATR, on the other hand, dynamically adjusts the volatility bands around the LSMA, allowing the indicator to filter out false signals and respond to significant price moves. This combination provides traders with a reliable tool to identify trend shifts while managing risk in volatile markets.
📊 Technical Breakdown and Calculations
The indicator consists of the following components:
1. Least Squares Moving Average (LSMA): The LSMA calculates a linear regression line over a defined period to smooth out price fluctuations and reveal the underlying trend. It is more reactive to recent data than traditional moving averages, allowing for quicker trend detection.
2. ATR-Based Volatility Bands: The Average True Range (ATR) measures market volatility and creates upper and lower bands around the LSMA. These bands expand and contract based on market conditions, helping traders identify when price movements are significant enough to indicate a new trend.
3. Volatility Extensions: To further account for rapid market changes, the bands are extended using additional volatility measures. This ensures that trend signals are generated when price movements exceed both the standard volatility range and the extended volatility range.
⚙️ Step-by-Step Calculation:
1. LSMA Calculation: The LSMA is computed using a least squares regression method over a user-defined length. This provides a trend line that adapts to recent price movements while smoothing out noise.
2. ATR and Volatility Bands: ATR is calculated over a user-defined length and is multiplied by a factor to create upper and lower bands around the LSMA. These bands help detect when price movements are substantial enough to signal a new trend.
3. Trend Detection: The price’s relationship to the LSMA and the volatility bands is used to determine trend direction. If the price crosses above the upper volatility band, a bullish trend is detected. Conversely, a cross below the lower band indicates a bearish trend.
✅ Customizable Inputs and Features:
The Adaptive Volatility-Controlled LSMA offers a variety of customizable options to suit different trading or investing styles:
📈 Trend Settings:
1. LSMA Length: Adjust the length of the LSMA to control its sensitivity to price changes. A shorter length reacts quickly to new data, while a longer length smooths the trend line.
2. Price Source: Choose the type of price (e.g., close, high, low) that the LSMA uses to calculate trends, allowing for different interpretations of price data.
🌊 Volatility Controls:
ATR Length and Multiplier: Adjust the length and sensitivity of the ATR to control how volatility is measured. A higher ATR multiplier widens the bands, making the trend detection less sensitive, while a lower multiplier tightens the bands, increasing sensitivity.
🎨 Visualization and Alerts:
1. Bar Coloring: Customize bar colors to visually distinguish between uptrends and downtrends.
2. Volatility Bands: Enable or disable the display of volatility bands on the chart. The bands provide visual cues about trend strength and volatility thresholds.
3. Alerts: Set alerts for when the price crosses the upper or lower volatility bands, signaling potential trend changes.
📈 Practical Applications
The Adaptive Volatility-Controlled LSMA is ideal for traders and investors looking to follow trends while accounting for market volatility. Its key use cases include:
Identifying Trend Reversals: The indicator detects when price movements break through volatility bands, signaling potential trend reversals.
Filtering Market Noise: By applying ATR-based volatility filtering, the indicator helps reduce false signals caused by short-term price fluctuations.
Managing Risk: The volatility bands adjust dynamically to account for market conditions, helping traders manage risk and improve the accuracy of their trend-following strategies.
⭐️ Summary
The Adaptive Volatility-Controlled LSMA by QuantAlgo offers a robust and flexible approach to trend detection and volatility management. Its combination of LSMA and ATR creates clearer, more reliable signals, making it a valuable tool for navigating trending and volatile markets. Whether you're detecting trend shifts or filtering market noise, this indicator provides the tools you need to enhance your trading and investing strategy.
Note: The Adaptive Volatility-Controlled LSMA is a tool to enhance market analysis. It should be used in conjunction with other analytical tools and should not be relied upon as the sole basis for trading or investment decisions. No signals or indicators constitute financial advice, and past performance is not indicative of future results.

Adaptive EMA with ATR and Standard Deviation [QuantAlgo]Adaptive EMA with ATR and Standard Deviation by QuantAlgo 📈✨
Introducing the Adaptive EMA with ATR and Standard Deviation , a comprehensive trend-following indicator designed to combine the smoothness of an Exponential Moving Average (EMA) with the volatility adjustments of Average True Range (ATR) and Standard Deviation. This synergy allows traders and investors to better identify market trends while accounting for volatility, delivering clearer signals in both trending and volatile market conditions. This indicator is suitable for traders and investors seeking to balance trend detection and volatility management, offering a robust and adaptable approach across various asset classes and timeframes.
💫 Core Concept and Innovation
The Adaptive EMA with ATR and Standard Deviation brings together the trend-smoothing properties of the EMA and the volatility sensitivity of ATR and Standard Deviation. By using the EMA to track price movements over time, the indicator smooths out minor fluctuations while still providing valuable insights into overall market direction. However, market volatility can sometimes distort simple moving averages, so the ATR and Standard Deviation components dynamically adjust the trend signals, offering more nuanced insights into trend strength and reversals. This combination equips traders with a powerful tool to navigate unpredictable markets while minimizing false signals.
📊 Technical Breakdown and Calculations
The Adaptive EMA with ATR and Standard Deviation relies on three key technical components:
1. Exponential Moving Average (EMA): The EMA forms the base of the trend detection. Unlike a Simple Moving Average (SMA), the EMA gives more weight to recent price changes, allowing it to react more quickly to new data. Users can adjust the length of the EMA to make it more or less responsive to price movements.
2. Standard Deviation Bands: These bands are calculated from the standard deviation of the EMA and represent dynamic volatility thresholds. The upper and lower bands expand or contract based on recent price volatility, providing more accurate signals in both calm and volatile markets.
3. ATR-Based Volatility Filter: The Average True Range (ATR) is used to measure market volatility over a user-defined period. It helps refine the trend signals by filtering out false positives caused by minor price swings. The ATR filter ensures that the indicator only signals significant market movements.
⚙️ Step-by-Step Calculation:
1. EMA Calculation: First, the indicator calculates the EMA over a specified period based on the chosen price source (e.g., close, high, low).
2. Standard Deviation Bands: Then, it computes the standard deviation of the EMA and applies a multiplier to create upper and lower bands around the EMA. These bands adjust dynamically with the level of market volatility.
3. ATR Filtering: In addition to the standard deviation bands, the ATR is applied as a secondary filter to help refine the trend signals. This step helps eliminate signals generated by short-term price spikes or corrections, ensuring that the signals are more reliable.
4. Trend Detection: When the price crosses above the upper band, a bullish trend is identified, while a move below the lower band signals a bearish trend. The system accounts for both the standard deviation and ATR bands to generate these signals.
✅ Customizable Inputs and Features
The Adaptive EMA with ATR and Standard Deviation provides a range of customizable options to fit various trading/investing styles:
📈 Trend Settings:
1. Price Source: Choose the price type (e.g., close, high, low) to base the EMA calculation on, influencing how the trend is tracked.
2. EMA Length: Adjust the length to control how quickly the EMA reacts to price changes. A shorter length provides a more responsive EMA, while a longer period smooths out short-term fluctuations.
🌊 Volatility Controls:
1. Standard Deviation Multiplier: This parameter controls the sensitivity of the trend detection by adjusting the distance between the upper and lower bands from the EMA.
2. TR Length and Multiplier: Fine-tune the ATR settings to control how volatility is filtered, adjusting the indicator’s responsiveness during high or low volatility phases.
🎨 Visualization and Alerts:
1. Bar Coloring: Select different colors for uptrends and downtrends, providing a clear visual cue when trends change.
2. Alerts: Set up alerts to notify you when the price crosses the upper or lower bands, signaling a potential long or short trend shift. Alerts can help you stay informed without constant chart monitoring.
📈 Practical Applications
The Adaptive EMA with ATR and Standard Deviation is ideal for traders and investors looking to balance trend-following strategies with volatility management. Key uses include:
Detecting Trend Reversals: The dynamic bands help identify when the market shifts direction, providing clear signals when a trend reversal is likely.
Filtering Market Noise: By applying both Standard Deviation and ATR filtering, the indicator helps reduce false signals during periods of heightened volatility.
Volatility-Based Risk Management: The adaptability of the bands ensures that traders can manage risk more effectively by responding to shifts in volatility while keeping focus on long-term trends.
⭐️ Comprehensive Summary
The Adaptive EMA with ATR and Standard Deviation is a highly customizable indicator that provides traders with clearer signals for trend detection and volatility management. By dynamically adjusting its calculations based on market conditions, it offers a powerful tool for navigating both trending and volatile markets. Whether you're looking to detect early trend reversals or avoid false signals during periods of high volatility, this indicator gives you the flexibility and accuracy to improve your trading and investing strategies.
Note: The Adaptive EMA with ATR and Standard Deviation is designed to enhance your market analysis but should not be relied upon as the sole basis for trading or investing decisions. Always combine it with other analytical tools and practices. No statements or signals from this indicator constitute financial advice. Past performance is not indicative of future results.

Momentum Cloud.V33🌟 Introducing MomentumCloud.V33 🌟
MomentumCloud.V33 is a cutting-edge indicator designed to help traders capture market momentum with clarity and precision. This versatile tool combines moving averages, directional movement indexes (DMI), and volume analysis to provide real-time insights into trend direction and strength. Whether you’re a scalper, day trader, or swing trader, MomentumCloud.V33 adapts to your trading style and timeframe, making it an essential addition to your trading toolkit. 📈💡
🔧 Customizable Parameters:
• Moving Averages: Adjust the periods of the fast (MA1) and slow (MA2) moving averages to fine-tune your trend analysis.
• DMI & ADX: Customize the DMI length and ADX smoothing to focus on strong, actionable trends.
• Volume Multiplier: Modify the cloud thickness based on trading volume, emphasizing trends with significant market participation.
📊 Trend Detection:
• Color-Coded Clouds:
• Green Cloud: Indicates a strong uptrend, suggesting buying opportunities.
• Red Cloud: Indicates a strong downtrend, signaling potential short trades.
• Gray Cloud: Reflects a range-bound market, helping you avoid low-momentum periods.
• Dynamic Volume Integration: The cloud thickness adjusts dynamically with trading volume, highlighting strong trends supported by high market activity.
📈 Strength & Momentum Analysis:
• Strength Filtering: The ADX component ensures that only strong trends are highlighted, filtering out market noise and reducing false signals.
• Visual Momentum Gauge: The cloud color and thickness provide a quick visual representation of market momentum, enabling faster decision-making.
🔔 Alerts:
• Custom Alerts: Set up alerts for when the trend shifts or reaches critical levels, keeping you informed without needing to constantly monitor the chart.
🎨 Visual Enhancements:
• Gradient Cloud & Shadows: The indicator features a gradient-filled cloud with shadowed moving averages, enhancing both aesthetics and clarity on your charts.
• Adaptive Visual Cues: MomentumCloud.V33’s color transitions and dynamic thickness provide an intuitive feel for the market’s rhythm.
🚀 Quick Guide to Using MomentumCloud.V33
1. Add the Indicator: Start by adding MomentumCloud.V33 to your chart. Customize the settings such as MA periods, DMI length, and volume multiplier to match your trading style.
2. Analyze the Market: Observe the color-coded cloud and its thickness to gauge market momentum and trend direction. The thicker the cloud, the stronger the trend.
3. Set Alerts: Activate alerts for trend changes or key levels to capture trading opportunities without needing to watch the screen continuously.
⚙️ How It Works:
MomentumCloud.V33 calculates market momentum by combining moving averages, DMI, and volume. The cloud color changes based on the trend direction, while its thickness reflects the strength of the trend as influenced by trading volume. This integrated approach ensures you can quickly identify robust market movements, making it easier to enter and exit trades at optimal points.
Settings Overview:
• Moving Averages: Define the lengths for the fast and slow moving averages.
• DMI & ADX: Adjust the DMI length and ADX smoothing to focus on significant trends.
• Volume Multiplier: Customize the multiplier to control cloud thickness, highlighting volume-driven trends.
📚 How to Use MomentumCloud.V33:
• Trend Identification: The direction and color of the cloud indicate the prevailing trend, while the cloud’s thickness suggests the trend’s strength.
• Trade Execution: Use the green cloud to look for long entries and the red cloud for short positions. The gray cloud advises caution, as it represents a range-bound market.
• Alerts: Leverage the custom alerts to stay on top of market movements and avoid missing critical trading opportunities.
Unleash the power of trend and momentum analysis with MomentumCloud.V33! Happy trading! 📈🚀✨

H-Infinity Volatility Filter [QuantAlgo]Introducing the H-Infinity Volatility Filter by QuantAlgo 📈💫
Enhance your trading/investing strategy with the H-Infinity Volatility Filter , a powerful tool designed to filter out market noise and identify clear trend signals in volatile conditions. By applying an advanced H∞ filtering process, this indicator assists traders and investors in navigating uncertain market conditions with improved clarity and precision.
🌟 Key Features:
🛠 Customizable Noise Parameters: Adjust worst-case noise and disturbance settings to tailor the filter to various market conditions. This flexibility helps you adapt the indicator to handle different levels of market volatility and disruptions.
⚡️ Dynamic Trend Detection: The filter identifies uptrends and downtrends based on the filtered price data, allowing you to quickly spot potential shifts in the market direction.
🎨 Color-Coded Visuals: Easily differentiate between bullish and bearish trends with customizable color settings. The indicator colors the chart’s candles according to the detected trend for immediate clarity.
🔔 Custom Alerts: Set alerts for trend changes, so you’re instantly informed when the market transitions from bullish to bearish or vice versa. Stay updated without constantly monitoring the charts.
📈 How to Use:
✅ Add the Indicator: Add the H-Infinity Volatility Filter to your favourites and apply it to your chart. Customize the noise and disturbance parameters to match the volatility of the asset you are trading/investing. This allows you to optimize the filter for your specific strategy.
👀 Monitor Trend Shifts: Watch for clear visual signals as the filter detects uptrends or downtrends. The color-coded candles and line plots help you quickly assess market conditions and potential reversals.
🔔 Set Alerts: Configure alerts to notify you when the trend changes, allowing you to react quickly to potential market shifts without needing to manually track price movements.
🌟 How It Works and Academic Background:
The H-Infinity Volatility Filter is built on the foundations of H∞ (H-infinity) control theory , a mathematical framework originating from the field of engineering and control systems. Developed in the 1980s by notable engineers such as George Zames and John C. Doyle , this theory was designed to help systems perform optimally under uncertain and noisy conditions. H∞ control focuses on minimizing the worst-case effects of disturbances and noise, making it a powerful tool for managing uncertainty in complex environments.
In financial markets, where unpredictable price fluctuations and noise often obscure meaningful trends, this same concept can be applied to price data to filter out short-term volatility. The H-Infinity Volatility Filter adopts this approach, allowing traders and investors to better identify potential trends by reducing the impact of random price movements. Instead of focusing on precise market predictions, the filter increases the probability of highlighting significant trends by smoothing out market noise.
This indicator works by processing historical price data through an H∞ filter that continuously adjusts based on worst-case noise levels and disturbances. By considering several past states, it estimates the current price trend while accounting for potential external disruptions that might influence price behavior. Parameters like "worst-case noise" and "disturbance" are user-configurable, allowing traders to adapt the filter to different market conditions. For example, in highly volatile markets, these parameters can be adjusted to manage larger price swings, while in more stable markets, they can be fine-tuned for smoother trend detection.
The H-Infinity Volatility Filter also incorporates a dynamic trend detection system that classifies price movements as bullish or bearish. It uses color-coded candles and plots—green for bullish trends and red for bearish trends—to provide clear visual cues for market direction. This helps traders and investors quickly interpret the trend and act on potential signals. While the indicator doesn’t guarantee accuracy in trend prediction, it significantly reduces the likelihood of false signals by focusing on meaningful price changes rather than random fluctuations.
How It Can Be Applied to Trading/Investing:
By applying the principles of H∞ control theory to financial markets, the H-Infinity Volatility Filter provides traders and investors with a sophisticated tool that manages uncertainty more effectively. Its design makes it suitable for use in a wide range of markets—whether in fast-moving, volatile environments or calmer conditions.
The indicator is versatile and can be used in both short-term trading and medium to long-term investing strategies. Traders can tune the filter to align with their specific risk tolerance, asset class, and market conditions, making it an ideal tool for reducing the effects of market noise while increasing the probability of detecting reliable trend signals.
For investors, the filter can help in identifying medium to long-term trends by filtering out short-term price swings and focusing on the broader market direction. Whether applied to stocks, forex, commodities, or cryptocurrencies, the H-Infinity Volatility Filter helps traders and investors interpret market behavior with more confidence by offering a more refined view of price movements through its noise reduction techniques.
Disclaimer:
The H-Infinity Volatility Filter is designed to assist in market analysis by filtering out noise and volatility. It should not be used as the sole tool for making trading or investment decisions. Always incorporate other forms of analysis and risk management strategies. No statements or signals from this indicator or us should be considered financial advice. Past performance is not indicative of future results.

Adaptive VWAP [QuantAlgo]Introducing the Adaptive VWAP by QuantAlgo 📈🧬
Enhance your trading and investing strategies with the Adaptive VWAP , a versatile tool designed to provide dynamic insights into market trends and price behavior. This indicator offers a flexible approach to VWAP calculations by allowing users to adapt it based on lookback periods or fixed timeframes, making it suitable for a wide range of market conditions.
🌟 Key Features:
🛠 Customizable VWAP Settings: Choose between an adaptive VWAP that adjusts based on a rolling lookback period, or switch to a fixed timeframe (e.g., daily, weekly, monthly) for a more structured approach. Adjust the VWAP to suit your trading or investing style.
💫 Dynamic Bands and ATR Filter: Configurable deviation bands with multipliers allow you to visualize price movement around VWAP, while an ATR-based noise filter helps reduce false signals during periods of market fluctuation.
🎨 Trend Visualization: Color-coded trend identification helps you easily spot uptrends and downtrends based on VWAP positioning. The indicator fills the areas between the bands for clearer visual representation of price volatility and trend strength.
🔔 Custom Alerts: Set up alerts for when price crosses above or below the VWAP, signaling potential uptrend or downtrend opportunities. Stay informed without needing to monitor the charts constantly.
✍️ How to Use:
✅ Add the Indicator: Add the Adaptive VWAP to your favourites and apply to your chart. Choose between adaptive or timeframe-based VWAP calculation, adjust the lookback period, and configure the deviation bands to your preferred settings.
👀 Monitor Bands and Trends: Watch for price interaction with the VWAP and its deviation bands. The color-coded signals and band fills help identify potential trend shifts or price extremes.
🔔 Set Alerts: Configure alerts for uptrend and downtrend signals based on price crossing the VWAP, so you’re always informed of significant market movements.
⚙️ How It Works:
The Adaptive VWAP adjusts its calculation based on the user’s chosen configuration, allowing for a flexible approach to market analysis. The adaptive setting uses a rolling lookback period to continuously adjust the VWAP, while the fixed timeframe option anchors VWAP to key timeframes like daily, weekly, or monthly periods. This flexibility enables traders and investors to use the tool in various market environments.
Deviation bands, calculated with customizable multipliers, provide a clear visual of how far the price has moved from the VWAP, helping you gauge potential overbought or oversold conditions. To reduce false signals, an ATR-based filter can be applied, ensuring that only significant price movements trigger trend confirmations.
The tool also includes a fast exponential smoothing function for the VWAP, helping smooth out price fluctuations without sacrificing responsiveness. Trend confirmation is reinforced by the number of bars that price stays above or below the VWAP, ensuring a more consistent trend identification process.
Disclaimer:
The Adaptive VWAP is designed to enhance your market analysis but should not be relied upon as the sole basis for trading or investing decisions. Always combine it with other analytical tools and practices. No statements or signals from this indicator constitute financial advice. Past performance is not indicative of future results.

Volatility-Adjusted DEMA Supertrend [QuantAlgo]Introducing the Volatility-Adjusted DEMA Supertrend by QuantAlgo 📈💫
Take your trading and investing strategies to the next level with the Volatility-Adjusted DEMA Supertrend , a dynamic tool designed to adapt to market volatility and provide clear, actionable trend signals. This innovative indicator is ideal for both traders and investors looking for a more responsive approach to market trends, helping you capture potential shifts with greater precision.
🌟 Key Features:
🛠 Customizable Trend Settings: Adjust the period for trend calculation and fine-tune the sensitivity to price movements. This flexibility allows you to tailor the Supertrend to your unique trading or investing strategy, whether you're focusing on shorter or longer timeframes.
📊 Volatility-Responsive Multiplier: The Supertrend dynamically adjusts its sensitivity based on real-time market volatility. This could help filter out noise in calmer markets and provide more accurate signals during periods of heightened volatility.
✨ Trend-Based Color-Coding: Visualize bullish and bearish trends with ease. The indicator paints candles and plots trend lines with distinct colors based on the current market direction, offering quick, clear insights into potential opportunities.
🔔 Custom Alerts: Set up alerts for key trend shifts to ensure you're notified of significant market changes. These alerts would allow you to act swiftly, potentially capturing opportunities without needing to constantly monitor the charts.
📈 How to Use:
✅ Add the Indicator: Add the Volatility-Adjusted DEMA Supertrend to your chart. Customize the trend period, volatility settings, and price source to match your trading or investing style. This ensures the indicator aligns with your market strategy.
👀 Monitor Trend Shifts: Watch the color-coded trend lines and candles as they dynamically shift based on real-time market conditions. These visual cues help you spot potential trend reversals and confirm your entries and exits with greater confidence.
🔔 Set Alerts: Configure alerts for key trend shifts, allowing you to stay informed of potential market reversals or continuation patterns, even when you're not actively watching the market.
⚙️ How It Works:
The Volatility-Adjusted DEMA Supertrend is designed to adapt to changes in market conditions, making it highly responsive to price volatility. The indicator calculates a trend line based on price and volatility, dynamically adjusting it to reflect recent market behavior. When the market experiences higher volatility, the trend line becomes more flexible, potentially allowing for greater sensitivity to rapid price movements. Conversely, during periods of low volatility, the indicator tightens its range, helping to reduce noise and avoid false signals.
The indicator includes a volatility-responsive multiplier, which further enhances its adaptability to market conditions. This means the trend direction would always be based on the latest market data, potentially helping you stay ahead of shifts or continuation trends. The Supertrend's visual color-coding simplifies the process of identifying bullish or bearish trends, while customizable alerts ensure you can stay on top of significant changes in market direction.
This tool is versatile and could be applied across various markets and timeframes, making it a valuable addition for both traders and investors. Whether you’re trading in fast-moving markets or focusing on longer-term investments, the Volatility-Adjusted DEMA Supertrend could help you remain aligned with the current market environment.
Disclaimer:
This indicator is designed to enhance your analysis by providing trend information, but it should not be used as the sole basis for making trading or investing decisions. Always combine it with other forms of analysis and risk management practices. No statements or claims aim to be financial advice, and no signals from us or our indicators should be interpreted as such. Past performance is not indicative of future results.

Dynamic Volume RSI (DVRSI) [QuantAlgo]Introducing the Dynamic Volume RSI (DVRSI) by QuantAlgo 📈✨
Elevate your trading and investing strategies with the Dynamic Volume RSI (DVRSI) , a powerful tool designed to provide clear insights into market momentum and trend shifts. This indicator is ideal for traders and investors who want to stay ahead of the curve by using volume-responsive calculations and adaptive smoothing techniques to enhance signal clarity and reliability.
🌟 Key Features:
🛠 Customizable RSI Settings: Tailor the indicator to your strategy by adjusting the RSI length and price source. Whether you’re focused on short-term trades or long-term investments, DVRSI adapts to your needs.
🌊 Adaptive Smoothing: Enable adaptive smoothing to filter out market noise and ensure cleaner signals in volatile or choppy market conditions.
🎨 Dynamic Color-Coding: Easily identify bullish and bearish trends with color-coded candles and RSI plots, offering clear visual cues to track market direction.
⚖️ Volume-Responsive Adjustments: The DVRSI reacts to volume changes, giving greater significance to high-volume price moves and improving the accuracy of trend detection.
🔔 Custom Alerts: Stay informed with alerts for key RSI crossovers and trend changes, allowing you to act quickly on emerging opportunities.
📈 How to Use:
✅ Add the Indicator: Set up the DVRSI by adding it to your chart and customizing the RSI length, price source, and smoothing options to fit your specific strategy.
👀 Monitor Visual Cues: Watch for trend shifts through the color-coded plot and candles, signaling changes in momentum as the RSI crosses key levels.
🔔 Set Alerts: Configure alerts for critical RSI crossovers, such as the 50 line, ensuring you stay on top of potential market reversals and opportunities.
🔍 How It Works:
The Dynamic Volume RSI (DVRSI) is a unique indicator designed to provide more accurate and responsive signals by incorporating both price movement and volume sensitivity into the RSI framework. It begins by calculating the traditional RSI values based on a user-defined length and price source, but unlike standard RSI tools, the DVRSI applies volume-weighted adjustments to reflect the strength of market participation.
The indicator dynamically adjusts its sensitivity by factoring in volume to the RSI calculation, which means that price moves backed by higher volumes carry more weight, making the signal more reliable. This method helps identify stronger trends and reduces the risk of false signals in low-volume environments. To further enhance accuracy, the DVRSI offers an adaptive smoothing option that allows users to reduce noise during periods of market volatility. This adaptive smoothing function responds to market conditions, providing a cleaner signal by reducing erratic movements or price spikes that could lead to misleading signals.
Additionally, the DVRSI uses dynamic color-coding to visually represent the strength of bullish or bearish trends. The candles and RSI plots change color based on the RSI values crossing critical thresholds, such as the 50 level, offering an intuitive way to recognize trend shifts. Traders can also configure alerts for specific RSI crossovers (e.g., above 50 or below 40), ensuring that they stay informed of potential trend reversals and significant market shifts in real-time.
The combination of volume sensitivity, adaptive smoothing, and dynamic trend visualization makes the DVRSI a robust and versatile tool for traders and investors looking to fine-tune their market analysis. By incorporating both price and volume data, this indicator delivers more precise signals, helping users make informed decisions with greater confidence.
Disclaimer:
The Dynamic Volume RSI is designed to enhance your market analysis but should not be used as a sole decision-making tool. Always consider multiple factors before making any trading or investment decisions. Past performance is not indicative of future results.
