TrendlinesTrendline S&R
This indicator is an automated technical analysis tool designed to identify the most relevant Support and Resistance (S&R) zones based on market pivots. Unlike standard pivot indicators that clutter the chart with historic lines, this script uses a "Closest-to-Price" algorithm to display only the single most relevant Support (Green) and Resistance (Red) zone currently interacting with price action.
It solves common frustrations with automated trendlines—specifically the issue of lines disappearing immediately upon a breakout—by introducing a Stability Buffer.
Key Features & Importance
The script scans hundreds of potential trendlines but only draws the one geographically closest to the current price.
Importance: This ensures you are looking at the zone that matters right now. It filters out distant or irrelevant historic lines, keeping your chart clean and focused on immediate price action.
🛡️ 5-Bar Stability Buffer (Anti-Flicker)
Feature: A hardcoded 5-bar "memory" prevents the zone from disappearing the moment price touches or breaks it.
Importance: This is critical for trading breakouts. It allows you to see the zone persist while price breaches it, helping you distinguish between a true breakout, a fakeout, or a retest, without the reference level vanishing from your screen.
🔍 Dynamic Pivot Filtering
Feature: Uses a restricted Pivot Strength (5-15) and Minimum Confirmation (2-8 touches).
Importance: By enforcing these limits, the indicator ignores insignificant market noise and micro-swings, ensuring that drawn zones represent structural market levels with genuine liquidity.
🔔 Integrated Alert System
Feature: Built-in alerts for "Zone Breakout" (candle close crossing the zone) and "Zone Touch" (wick entering the zone).
Importance: Allows you to set the indicator and walk away. You will be notified instantly when price interacts with these key levels, removing the need to stare at the chart.
📉 Adaptive Tolerance (Fixed ATR)
Feature: Uses a fixed ATR multiplier internally to determine the width of the zone.
Importance: This automatically adjusts the thickness of the support/resistance zone based on the asset's volatility.
Settings Guide
Bars to Apply: How far back in history the script looks for pivots (Default: 300).
Pivot Source: Choose between calculating from "High/Low" (wicks) or "Close" (bodies).
Pivot Strength: The number of bars required on each side to define a swing point (Range: 5–15).
Min Pivot Confirmation: The minimum number of touches required to validate a trendline (Range: 2–8).
How to Use
Add the indicator to your chart.
Adjust Pivot Strength if you want to catch smaller swings (lower number) or major structures (higher number).
Set an alert in TradingView by clicking the "Clock" icon, selecting this indicator, and choosing "Zone Breakout" or "Zone Touch".
Trendlinestrategy

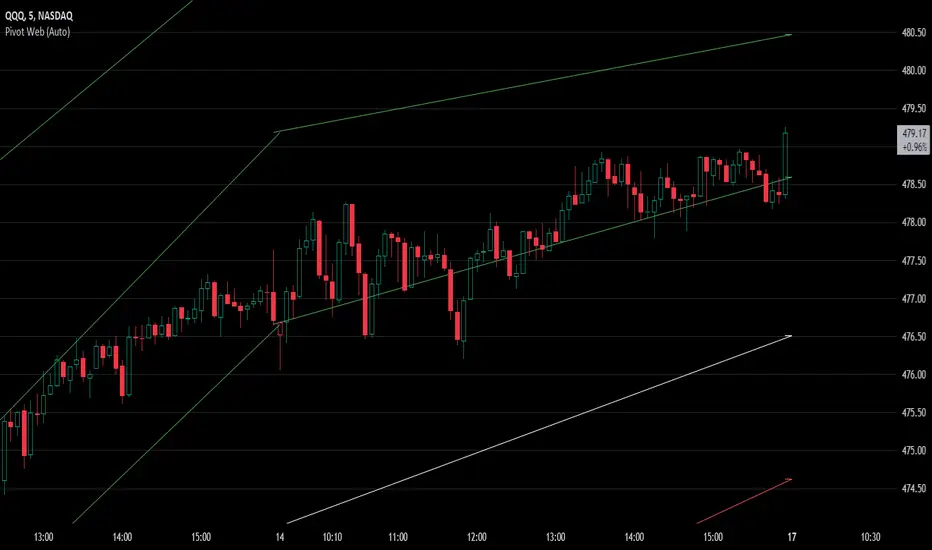
Pivot WebThe Pivot Web is a prototype with its base derived from TradingView's standard pivot point indicator plus inspiration from LuxAlgo's trendline work alongside my own observations/experiences.
The theory is that there's legitimacy, from a technical standpoint, pivot point calculations are an adequate gauge of momentum and sentiment because the same math was used under pressure by floor traders themselves. That calculation is centered on the average of high, low, and closing prices. This indicator creates trendlines connecting the last pivot, support, and resistance levels to the current ones. A dynamic visual cue could make it easier to assess if the price will continue or reverse the current trajectory. This method also shows us an excellent visual for volatility.
Key Takeaways:
This indicator draws new dynamic trendlines.
These new trendlines connect the past and present pivot point levels based on the timeframe you select.
Shorter timeframes = More trendlines
Price adherence to the path of these lines may offer insight for trading.
Lastly, note the first set of data in each new timeframe displays the current original pivot point levels along with the trendlines attached to their ending point. Most of the time this indicator leaves room by briefly highlighting the original static levels with all levels also being optional displays. Also note that a more stable asset may not require the outermost support and resistance levels. Like most time series analysis tools, the Pivot Web requires current data to function properly.
"Nature is pleased with simplicity, and nature is no dummy."