UP & DOWN VOLUMEIndicator draws UP & DOWN VOLUME for both NYSE and NASDAQ - just choose the appropriate exchange in settings.Indicateur Pine Script®par mmmerchant64
UpVol/TVol NYSE Lowry Upside DaysTakes Tradingviews Upside Volume for NYSE and divides it by Total Volume on NYSE. Tradingview's data source generally has different volume figures than say the Wall Street Journal. Therefore, this indicator is an estimate. 10% upside volume shows extreme panic and is consistent with market sell offs. 90% upside days, following a decline, are often occur within a week or so of significant market bottoms. Recommend using columns as the plot type. Based on research of LowryResearch Corp.Indicateur Pine Script®par CoryMitchell-CMT33107
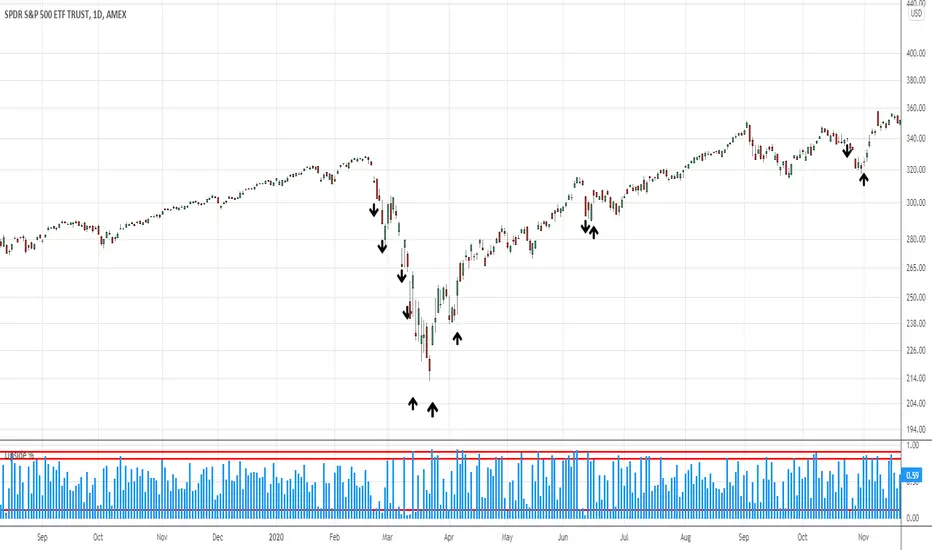
Up Volume vs Down VolumeCalculating NYSE Up Volume (UPVOL.NY) vs NYSE Down Volume (DNVOL.NY). The triangles appear when the ratio exceeds 90% in either direction. Also has the option to switch to NQ, US, DJ, AM, or AX tickers. Credit to @MagicEins for the original script: Indicateur Pine Script®par ChartingCyclesMis à jour 2020771
UVOL / DVOL RatioPlots the NYSE, NASDAQ, AMEX UP Volume and DOWN Volume ratios as a histogram - and adds the index UVOL / DVOL ratios as a line graph. DVOL is represented as negative - UVOL as positive. When either is above 2 its a good predictor of the day's outcome. At least - it tells you if the bulls or bears are winning the day. Really simple to use / edit to your needs EnjoyIndicateur Pine Script®par volak55485
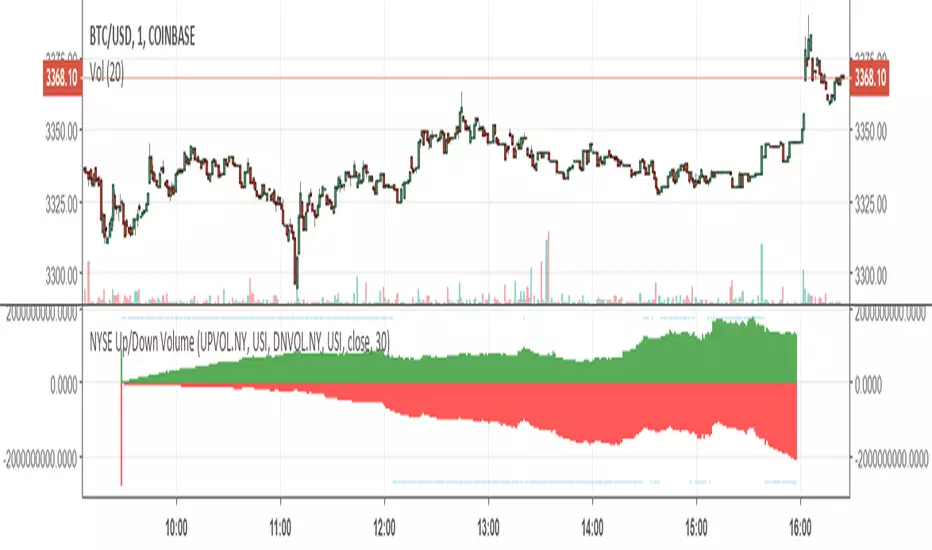
NYSE Up/Down VolumeAn indicator which shows the NYSE Up/Down volumeIndicateur Pine Script®par danarm11281