VolumeBars in FiatSimple volume bars indicator for cryptocurrencies that shows their respective volume in fiat.
USD

Vortex/SMA IndicatorVortex and SMA indicator, looks at the Metal/Dollar pair as a crypto case study. Wave length and trading correlations for trading pairs or bots.

BTCUSD 1 DAY Lower band Bitcoin ScriptThis calculates the lower level of the BTC price based on the MINING vs USD.
(C)2017/18 Paul Clevett
Chart Formation DetectionThis script is designed to recognise a chart formation that is bullish. However, the script is optimised to default as using a very accurate formation.
This script works best on the 1-15 minute time frames. Anything higher is subject to macroeconomic events as apposed to high-frequency-trading algorithms which we are relying on in order for this script to work.
This seems to work very well on certain instruments as apposed to others(e.g. gold seems to work better than the US30). You will find what you like the best and develop your own uses for these indicators.

BTC Buy Sell Guide (BSG) - MA & RSIhi BTChes,
green is when the price drops below the 100 day MA
red is the intensity of the 14 day RSI
BUY @ green
SELL @ the second or third RSI spike
most importantly, keep in mind fundamentals :)
-joie
BTC Volume in FiatThis indicator shows volume in Fiat. You will get wierd numbers if you use it on non BTC-FIAT pairs.

EUSDwaveV2 [pietherrieck]another version of my highly efficient strategy for the d1 eur/usd chart. i don't recommend to use it on other currencies/timeframes!

EUSDwave [pietherrieck]this is a highly efficient strategy for the d1 eur/usd chart. i don't recommend to use it on other currencies/timeframes!

Volume in BTC v2I made this indicator to display the volume in BTC in the top left. I find it useful to quickly get the idea of how much BTC is being traded in each pair. It also showing the 7 candle moving average volume in BTC. This is configurable tho.
Please note, this is my first script, and after activating it you will get two annoying lines on your chart. You will have to open the indicators setting and disable those lines manually until i figure out how to do it in the script. Anyway, its a minor issue. I hope you will still enjoy the indicator. Have a nice day.

EUSDwaveV2 [pietherrieck]new version of my highly efficient strategy for the d1 eur/usd chart. i don't recommend to use it on other currencies/timeframes! if you want to use it contact me!

Volume in BTCThis is an experimental script i made for tracking volume in BTC on poloniex pairs. I am not a developer, i hardly even know how to code, so im sure there is a better way! I shared the script on request from someone else. I made the line 100% transparant because i only want the number in the top left. Have a nice day.

Kraken Altcoin IndexIndex based upon the valuation of LTC, ETH, ETC, XMR and ZEC in XBT, USD and EUR
Options:
- choose which of the above alt coins are part of the index
- choose whether you want to see the valuation in XBT, USD or EUR
Note that because of the high valuation of ZEC during the launch period and the months thereafter it has a significant effect on the index. This is true as well for XMR, though to lesser extend.
Because of these effect, ZEC and XMR are not taken part of the index by default.
Please like it, if you find it useful.
If you'd like me to improve the indicator, the by all means leave a comment or PM me.
Cheers!

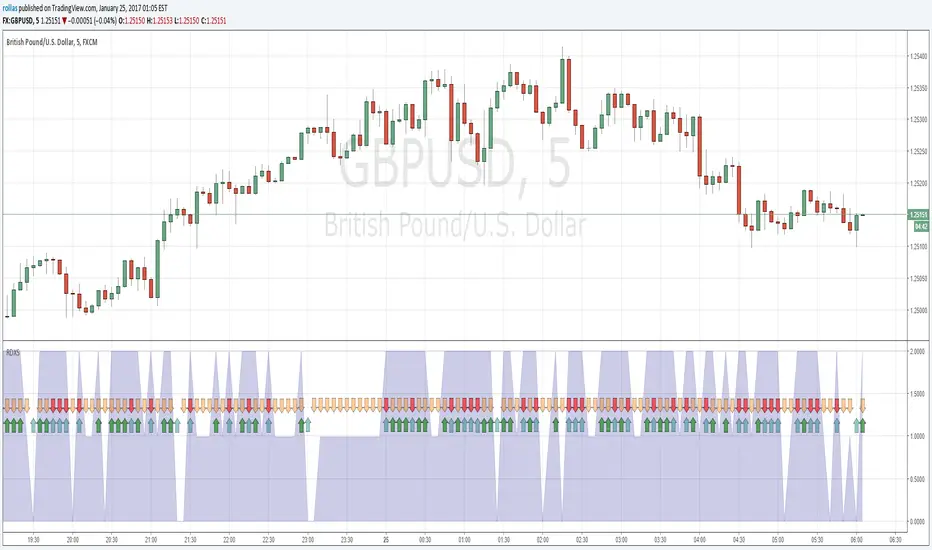
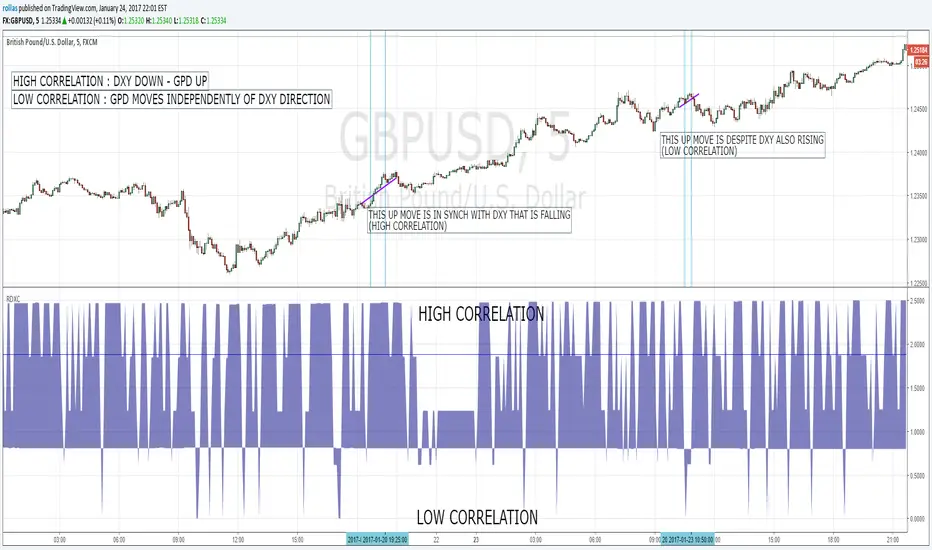
DXY SIGNALDXY Correlation indicator Version 2. Added adjustable parameters. Correlation factor is how many bars back for the colleration cumputing. Threshold adjusts the minimum correlation level to give signals. Default is 0.9. Value 1 equals %50 correlation while 2 is %100 correlation.
DXY SIGNALWorks on pairs including USD ticker. Gives buy and sell signals according to the relationship with DXY.
EUSDwave [pietherrieck]this is a highly efficient strategy for the d1 eur/usd chart.
i don't recommend to use it on other currencies/timeframes!
if you want to use it contact me!

EUSDwave [pietherrieck]this is a highly efficient strategy for the d1 eur/usd chart.
i don't recommend to use it on other currencies/timeframes!

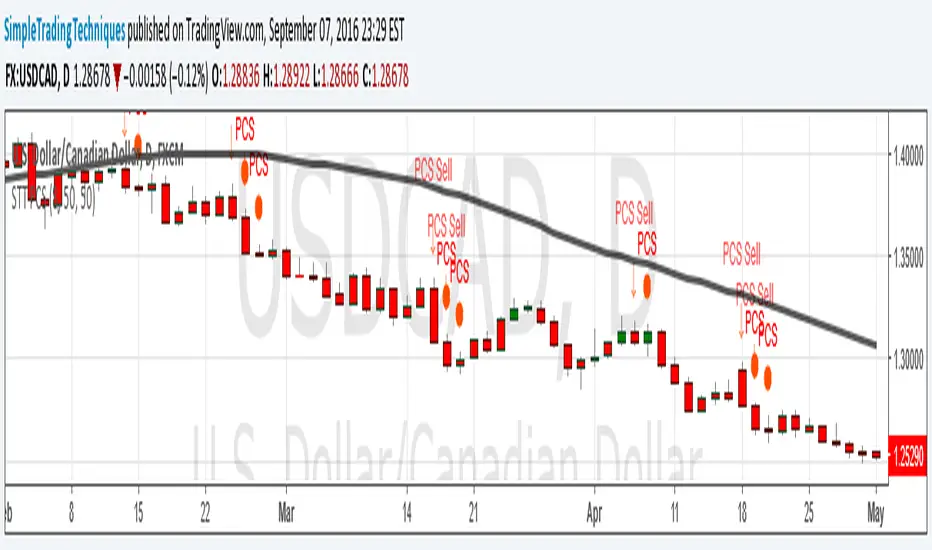
PULLBACK CANDLESTICK STRATEGY BY SIMPLE TRADING TECHNIQUESArrow represent trade setup
Circle represent triggering of the trade
--------------------------------------------------------------------
1. Where to place stop loss?
2. Where to exit the trade?
3. How to protect gains in your trade?
4. How to apply money management rule?
5. How to trade gap opening?


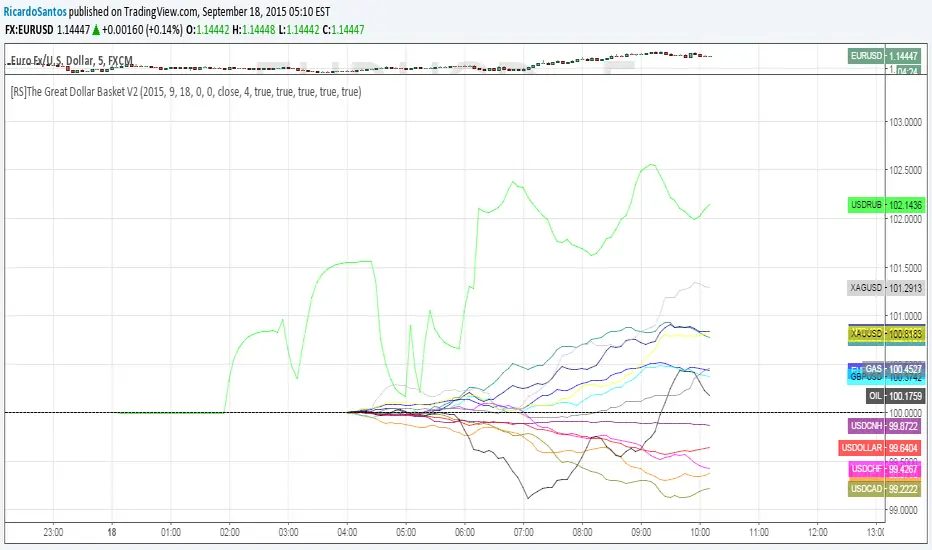
[RS]The Great Dollar Basket V2update: added hour and minute support (request for 56SD1uijk)
issues: usdrub is from a different data provider, reason why its desync'd with the other instruments intraday.
ATR Pips [LazyBear] [Elixium Mod: FEAR GAUGE]Modified version of ATR Pips
The indicator's value is a third of the daily range which is good to use as a stop loss value for intra day scalping on markets such as index futures and forex.
It's good for detecting and confirming inflection points in the market.
