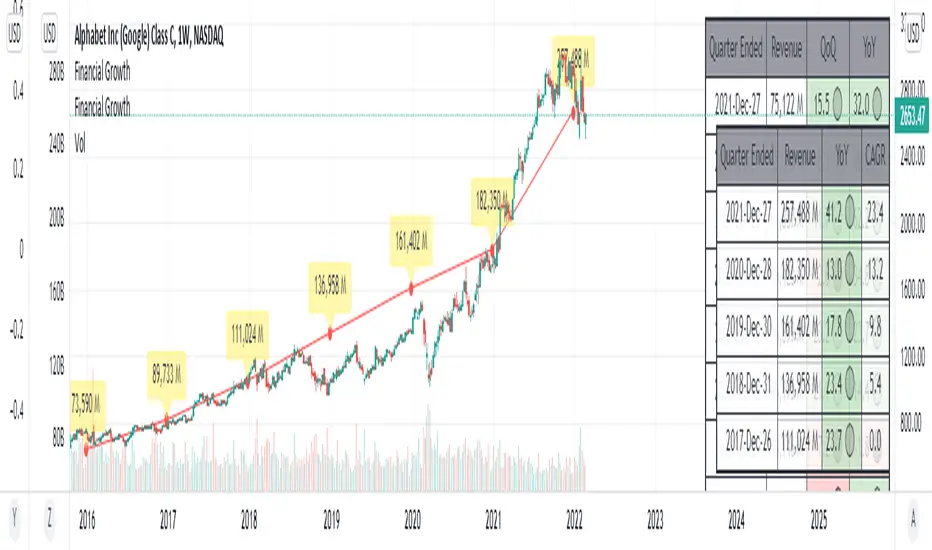
Financial GrowthThis indicator will acquire the financial data provided by Tradview.
the data is compare between Quarter, Annual and TTM in term of percent of growth.
YoY, QoQ and CAGR is also available by this script (The minimum is 4).
in addition, ploting of data, label and table also available (you can check the mark to toggle on / off).
Data : Revenue, Net Income, EBITDA, EPS, DVPS, Free Cash Flow and Forward PE .
How to use it.
just select the financial data, period and size of data to compare.
you can check the box to toggle the plotting line, label and table.
Enjoy.
Valueinvesting
Stock Value - How Much Stock Should Worth?Stock Value
© danny_peanuts
There are many method of measuring value of stock. However I'm proposing most basic stock valuation based on Book Value, Earnings, Dividends and Money Supply:
SV = (BVPS + EPS + DPS) * (M2/M0)
BVPS = Book Value Per Share (Asset - Liability)
EPS = Earnings Per Share
DPS = Dividends Per Share
M2 = M2 Money Supply (Money Market)
M0 = M0 Money Supply (Base Money)
Fundamental value of a stock should be determine by it's BV which means total asset of a company if were liquidated today and use some of it's asset to pay of the debt. So technically BVPS is the intrinsic value of a stock. However the company is generating an earning which is profit and loss that should be added on top of the fundamental value of company, so thus EPS should be added on top of Book Value Per Share. Aside from earnings, the stock that you purchase give you dividends as your return so DPS also can be included on top of that. So all in all BVPS, EPS and DPS are the primary valuation of the stock. However most of the stock are traded way higher than their fundamental valuation. The main reason of this is the market dynamics which is driven by central banks printing of base money supply M0. The banking credit system then lend out this money to money markets as loan so that peoples can invest and by the company stock. This money supply extension of credit is known as money market M2 which drive the stock inflated price. The ratio between M2 and M0 are the money multiplier effect that drives the stock price higher than it's valuation. So the Stock Value should be the total number of BVPS + EPS + DPS times the M2 money multiplier as shown by this indicator.
If the stock are traded above their SV value, that means it's an overpriced bubble
If the stock are traded below their SV value, that means it's an underpriced burst

Income Ratio■ Income Statement Ratio
This script will provide how distribution of income statement of a comany is.
it also allows us to see a clear picture how the business of a company develop.
For example TESLA.
in term of value, its revenue is 13,757K in the last quarter and it seam to be stable.
while the cost of goods sold (COGS) also increase.
In term of percent, it shows that the gross profit margin is growing up as well as net profit margin.
moreover, depreciation and amortization has declined as well as COGS.
This information like this will help us make a better trading plan.
■ Idea.
1. Each items such as Cost of Goods Sold, Gross Profit will be divided by total revenue.
2. 2 types of data after calculation, Value in Million and Percent by comparing with "Total Revenue".
■ How to use it.
In the menu, you can select the type of data to show
1. Select data type, it is available in Value in Million and Percent.
2. Select the financial period : FY for Financial Year and FQ for Financial Quarter.
Enjoy.

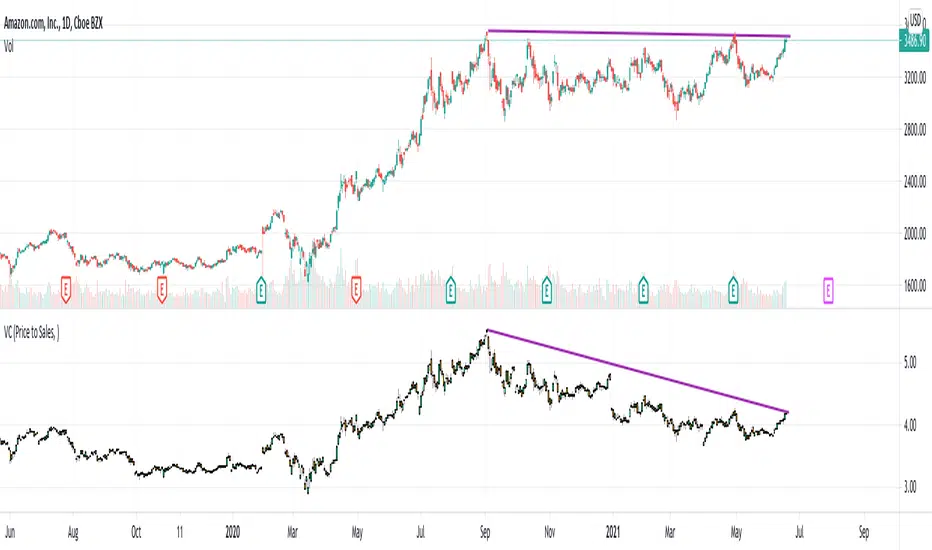
Value CandlesCreating candles from value stats as an experiment. These candles will almost always follow price candles except when there is a deviation.
Strategies based on buying the dips can be applied better on value candles. This is because, drop in value candles imply real bargain whereas drop in price candles can also be due to some other factors.
We can clearly see in the Amazon chart that value candles have come down even though price candles are at same level from September. This signifies AMZN stock is having more value now (due to increased sales from September to now) than back in September even though the price is same.
Another simple thing we can do is move Value candles into same overlay as that of price candles. This will look something like this:
Key thing to remember : Lower the value candle higher the relative value of stock.
Value RangeHere is another attempt to chase value based on technical analysis.
This is extended version of PE range script published earlier.
Instead of just PE, this script contains several other factors which defines value. You can chose which factor to look at from input dialog:
Possible value factors included in this script are:
Price to Earnings
Price to Sales
Price to Book
PE - Forwarding
PS - Forwarding
Price to Cashflow
Enterprise Value to EBITDA
Enterprise Value to Cashflow
Some of these can be added to chart directly from financials. But, the script also calculate range based on donchian channel or bollinger bands. Instead of short periods, we are looking for periods in terms of years. Rest of things remain same.

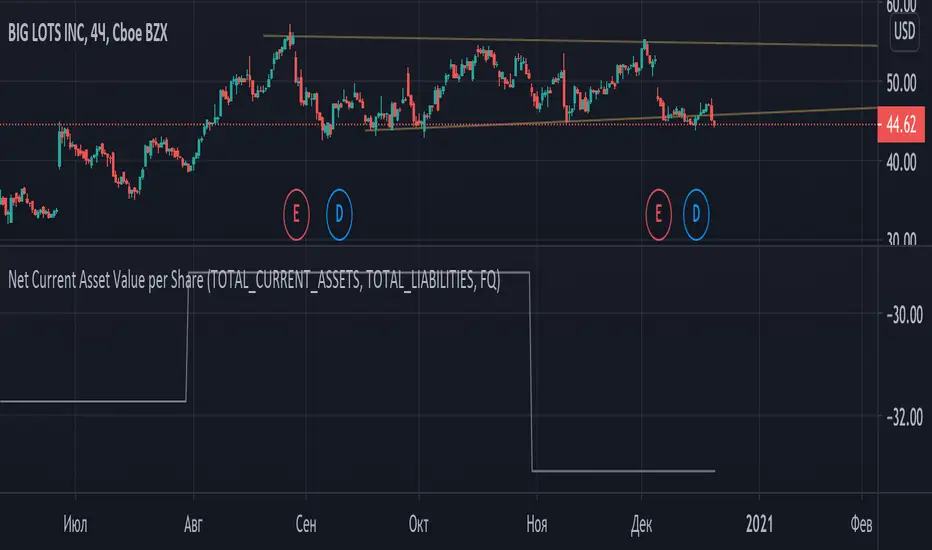
Graham Net Current Asset Value per ShareNet current asset value per share (NCAVPS) is a measure created by Benjamin Graham as one means of gauging the attractiveness of a stock. A key metric for value investors, NCAVPS is calculated by taking a company's current assets and subtracting total liabilities.
NCAVPS = Current Assets - (Total Liabilities + Preferred Stock) ÷ Shares Outstanding.
According to Graham, investors will benefit greatly if they invest in companies where the stock prices are no more than 67% (or 2/3) of their NCAV per share (price <= (2/3)*NCAV).
Coloring pattern:
- price <= (1/3)*ncav -> light green
- (1/3)*ncav < price <= (2/3)*ncav -> green
- (2/3)*ncav < price <= ncav -> dim red
- price > ncav -> red
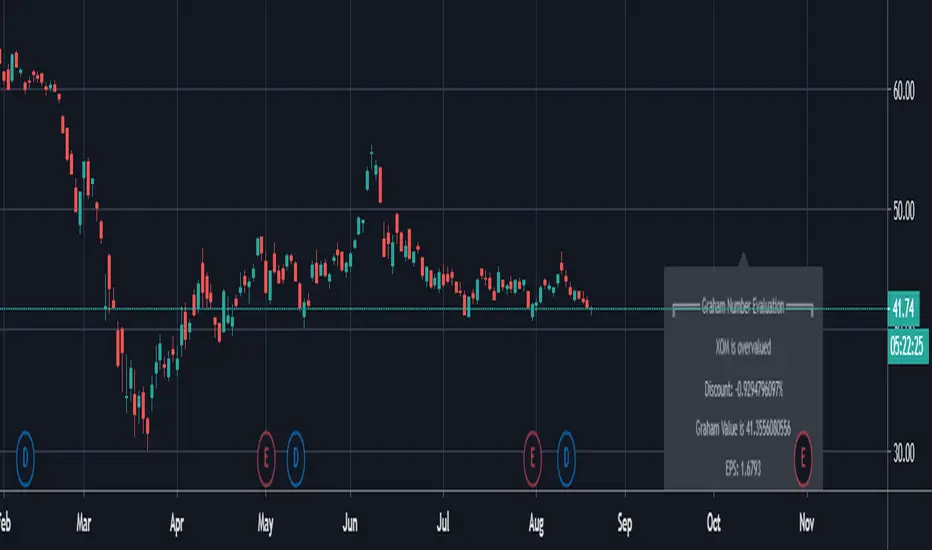
Graham FormulaThis is an Tradingview implementation of the Grahams Formula as described in Benjamin Grahams book "The Intelligent Investor".
In theory this can be used to screen for over- and undervalued stocks, however as Graham himself notes, you should look into other fundamentals when using them in conjunction with Grahams formula.
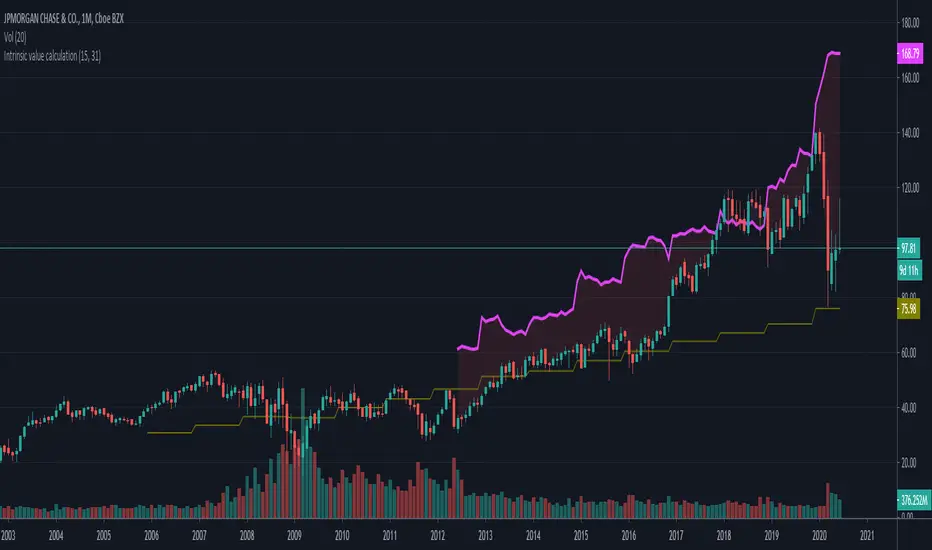
Intrinsic value calculation Intrinsic value calculator based on Warren Buffet's and Ben Graham's work
In value investing determing the true value of a COMPANY instead of a stock price is crucial.
This little indicator shows the "Intrinsic value" of the choosen stock meaning the value of the stock in 10 years time. Calculation is based on historical book value's average annual growth rate and dividends paid.
Since this is about long therm investing, use monthly charts.
"Intrinsic value can be defined simply: It is the discounted value of the cash that can be taken out of a business during its remaining life.”
– Warren Buffett
One way to calculate that is by the growth in per share book value and dividends taken in the forseeable future (10 years) than discount it with the prevailing 10 year note's rate.
In the inputs you have to set 2 variables:
1. How many years back you have the first data for book value per share available?
2. What was the per share book value that year?
(Bookvalue is ploted in olive colour and you can get the oldest one if you move your cursor over the latest data on the left)
CAUTION! You have to reenter it for every stock you analyse as this is stock-specific data!
After setting the input data, you will see the "Intrinsic Value"'s pink curve ploted over the price chart.
If the price is well below the pink line, the company is undervalued and can be a possible applicant for long therm investment.
Margin of safety: when the current price is 50% below the intrinsic value that means a 10% yearly growth potential (100% growth in 10 years) or a 100% margin of safety.
I am a beginer in Pine so please excuse my coding...
If anybody knows hot to extract historical data from 15 years ago, please share it with me, so I can automate the whole calculation without inputs necessary.