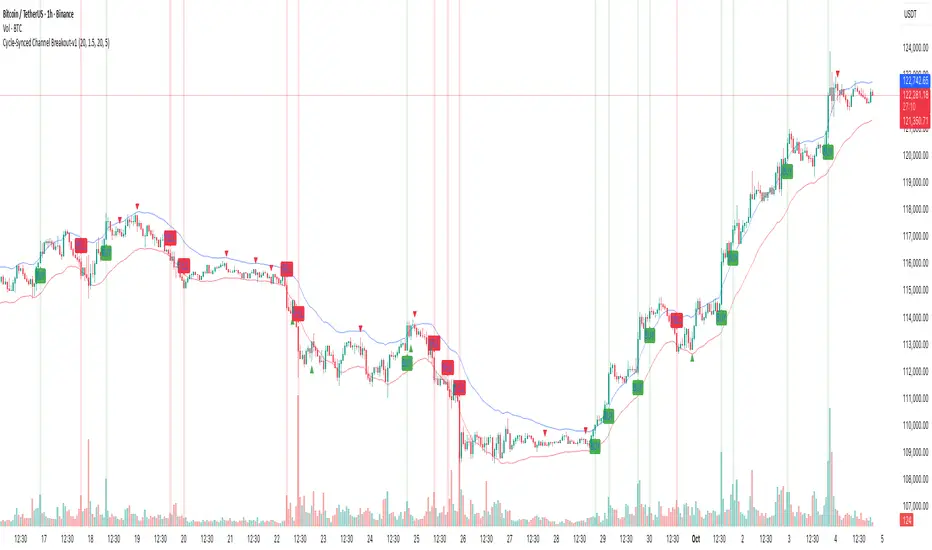
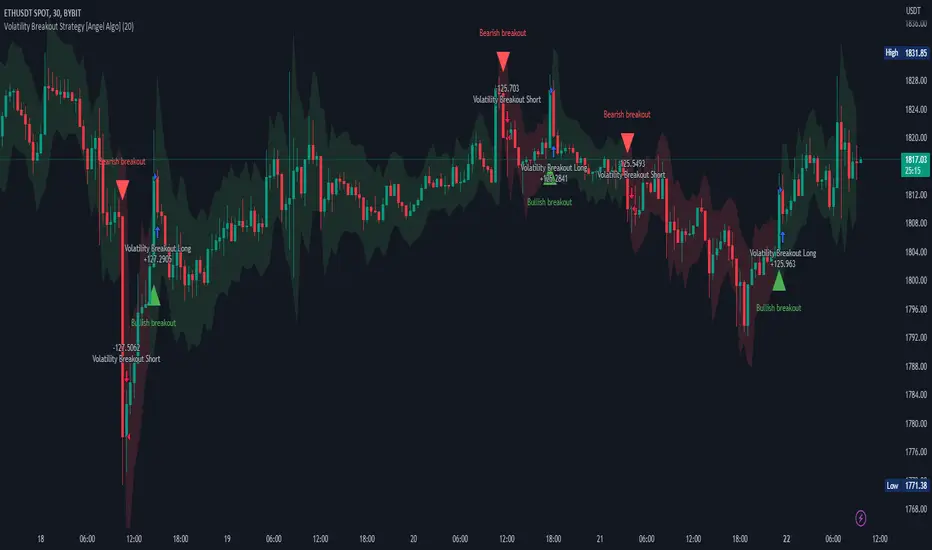
VCP Historical Score Histogram PM📊 VCP Historical Score Histogram
The VCP Historical Score Histogram is a specialized companion tool to the Pro Dashboard, designed to visualize the "silent" contraction of volatility over the history of a stock. While standard price action can look random, the VCP Score reveals the underlying institutional accumulation and the precise moments when a stock becomes "tight" enough to explode.
🔍 Why Use the Histogram?
VCP (Volatility Contraction Pattern) trading is all about timing. This indicato
Indicateur