Volatility Regime Classifier | ATRP Percentile ZonesThis indicator helps you understand the current volatility environment of any asset by comparing recent ATR-based values to its historical range.
It defines four regimes:
🔴 Low Volatility: Volatility is decreasing
🟢 Normal: Volatility is increasing but still below average
🟠 High: Volatility is elevated
🟣 Extreme: Volatility is very high compared to recent history
⚙️ How it works
We calculate the Average True Range (ATR) as a percentage of price (ATRP), then compare a short-term ATR to a longer-term one. Their difference shows whether volatility is picking up or slowing down.
To make the signal more adaptive, we look at the distribution of recent volatility over a rolling window. We compute the 50th and 70th percentiles of that history to set dynamic thresholds.
About distribution & percentiles
Volatility in financial markets doesn't follow a normal (Gaussian) distribution, it's often skewed, with sudden spikes and fat tails. That means fixed thresholds (like "ATR > 20") can be misleading or irrelevant across assets and timeframes.
Using percentiles solves this:
The 50th percentile marks the middle of the recent volatility range.
The 70th percentile captures a zone where volatility is unusually high, but not too rare, which keeps the signal usable and not overly sensitive.
These levels offer a balance:
⚖️ not too reactive, not too slow — just enough to highlight meaningful shifts.
✅ Use cases
Spot changes in market conditions
Filter or adapt strategies depending on the regime
Adjust position sizing and risk dynamically
Volatilitytrend

Volatility Trend (Zeiierman)█ Overview
The Volatility Trend (Zeiierman) is an indicator designed to help traders identify and analyze market trends based on price volatility. By calculating a dynamic trend line and volatility-adjusted bands, the indicator provides visual cues to understand the current market direction, potential reversal points and volatility.
█ How It Works
The indicator uses a weighted moving average of historical prices to create a responsive trend line that is adjusted for volatility using standard deviation. The indicator sets upper and lower bands at intervals of two standard deviations, acting as markers for potential overbought or oversold conditions. Additionally, by comparing current and previous trend line values, the indicator identifies the trend direction, providing crucial insights for traders.
█ How to Use
Trend Identification
Use the trend line to identify the overall market direction. An upward-sloping line indicates an uptrend, while a downward-sloping line indicates a downtrend.
Volatility Assessment
Use the distance between the upper and lower bands to gauge market volatility. Wider bands indicate higher volatility, while narrower bands indicate lower volatility.
Overbought/Oversold
If the price reaches or exceeds the upper or lower bands, it may be in an overbought or oversold condition, respectively.
█ Settings
Trend Control: Adjusts the sensitivity and smoothness of the trend line. Lower values make the trend more responsive, while higher values make it smoother.
Trend Dynamic: Controls how quickly the trend adjusts to price changes. Higher values result in a slower adjustment.
Volatility: Consists of two parts - the scaling factor for volatility and the sensitivity for volatility adjustment. Adjusting these settings alters the distance between the trend lines and the price, as well as how sensitive the bands are to changes in volatility.
Squeeze Control: Influences the degree to which market squeeze is considered in the calculation, with higher values increasing sensitivity.
Enable Scalping Trend: A toggle that, when activated, makes the indicator focus on short-term trends, which is particularly useful for scalping strategies.
█ Related scripts with the same calculation philosophy
TrendCylinder
TrendSphere
Predictive Trend and Structure
-----------------
Disclaimer
The information contained in my Scripts/Indicators/Ideas/Algos/Systems does not constitute financial advice or a solicitation to buy or sell any securities of any type. I will not accept liability for any loss or damage, including without limitation any loss of profit, which may arise directly or indirectly from the use of or reliance on such information.
All investments involve risk, and the past performance of a security, industry, sector, market, financial product, trading strategy, backtest, or individual's trading does not guarantee future results or returns. Investors are fully responsible for any investment decisions they make. Such decisions should be based solely on an evaluation of their financial circumstances, investment objectives, risk tolerance, and liquidity needs.
My Scripts/Indicators/Ideas/Algos/Systems are only for educational purposes!

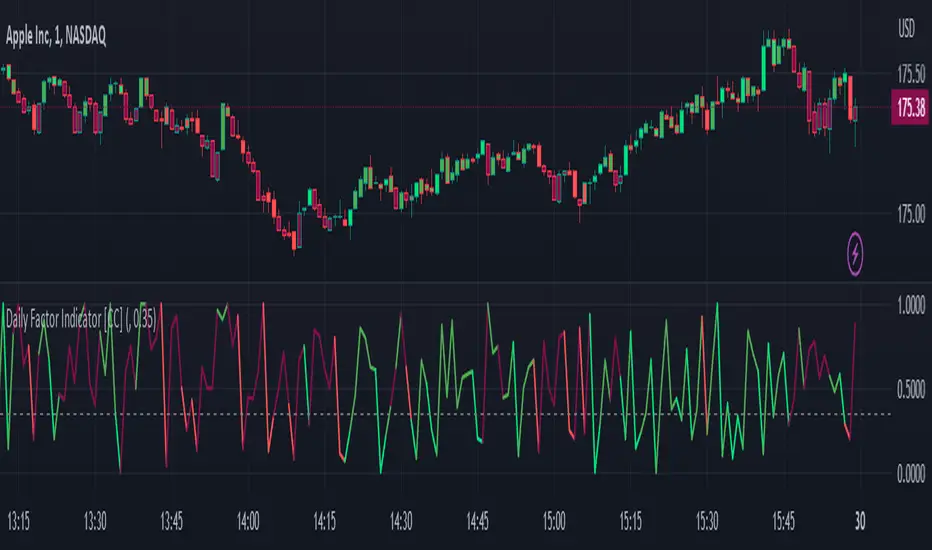
Daily Factor Indicator [CC]The Daily Factor Indicator was created by Andrea Unger (Stocks and Commodities Jun 2023 pgs 26-31), and this is a new volatility indicator that compares the body, which is the absolute difference between the previous open and previous close, and the range which is the difference between the previous high and previous low. The indicator is calculated by dividing the body and range to determine the volatility for the previous bar. This indicator will range between 0 and 1. Values closer to 1 mean very high volatility, and values closer to 0 mean very low volatility. I have introduced a simple moving average strategy to decide buy or sell signals and colors. Darker colors mean the indicator is above the threshold level, and lighter colors mean the indicator is below the threshold level. Colors are shades of green when the price is above the moving average and shades of red when the price is below the moving average. Feel free to try out your own threshold level and general buy and sell signals.
Let me know if there are any other indicators you would like me to publish!
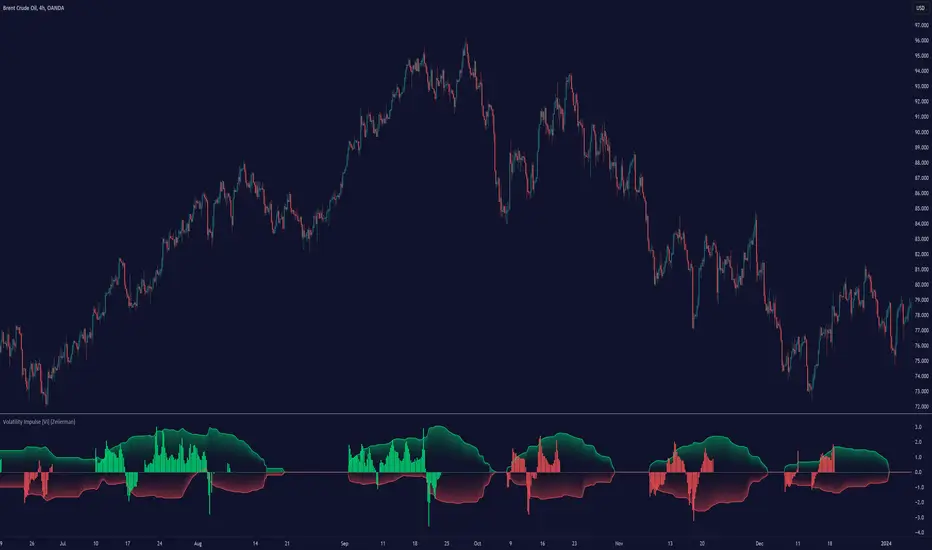
Volatility Impulse [VI] (Expo)█ Overview
The Volatility Impulse Indicator is a trading tool that measures the rate of change in an asset's price volatility. It helps identify potential market entry or exit points by signaling high or low volatility periods, which could suggest increased price momentum or consolidation. The Volatility Impulse Indicator will spike when the market is highly volatile, indicating a potential trend reversal or breakout. Conversely, when the market is less volatile, the indicator will be more stable, indicating a possible continuation of the current trend.
█ Trend Feature
Adding a Trend feature to the volatility line makes the indicator a complete trading tool that can be used in many strategies. This trend feature capitalizes on the historical price momentum to determine the current trend direction, providing additional context and insight for traders. The historical price momentum essentially encapsulates the speed and strength of price changes over a certain period. By integrating this information into the volatility indicator, traders gain a clearer picture of not only the magnitude of price fluctuations but also the prevailing trend in the market.
█ How is the Volatility Impulse calculated?
The Volatility Impulse Indicator is based on the principle that volatility precedes price action. Therefore, they are useful in predicting future price movements.
In this calculation, we're determining volatility by looking at the greatest absolute difference in price. This is done by comparing two separate things:
The highest price and a previous highest price: The code is essentially looking back at a specific number of bars ('Length') and finding the highest price during that period. It then compares that highest price to the previous highest price (found during the previous 'Length' period). The difference between these two gives a measure of how much the highest price is changing.
The lowest price and a previous lowest price: Similar to the highest price, the code looks back at a specific number of bars and finds the lowest price. It then compares that to the lowest price of the previous period. The difference gives a measure of how much the lowest price is changing.
The 'greatest absolute difference' means it's considering the magnitude of the change, not the direction. So whether the price is increasing or decreasing doesn't matter here - it's the size of the change that counts.
This way of calculating volatility is looking at how much the extreme values (the highest and lowest prices) are changing. If these values are changing a lot, it suggests that price movements are quite volatile. Conversely, if the highest and lowest prices aren't changing much, it suggests lower volatility.
█ How to use
Using the Volatility Impulse Indicator is relatively simple.
Identify potential trend reversals: When the Volatility Impulse Indicator shows a spike, indicating high volatility, traders can look for potential trend reversals.
Volatility Retracement: Volatility retracement takes place in the direction of the ongoing trend and can be interpreted as a sign that the retracement phase is over or exhausted. This typically indicates that enough retail stop losses have been triggered or that sufficient profit-taking has been completed. Both of these factors can contribute to a pause or a reversal in the trend's direction, leading to a temporary spike in volatility.
Volatility Breakout: Sudden and rapid price movement beyond a certain level may indicate a potential breakout. This event suggests that the price has enough momentum to continue its direction, marking the breakout as valid.
Trend Confirmation: When the volatility line reaches its upper or lower band, it indicates an increase in volatility, suggesting a strengthening trend. When the volatility line oscillates around the midline, it may indicate decreasing volatility and a weakening trend or consolidation.
Overbought/Oversold Conditions: If the volatility line is above the upper line, it could indicate an overbought situation, suggesting a potential reversal or pullback, a perfect place to take partial profit. Conversely, a volatility line below the lower band may signal an oversold market, suggesting a possible upward movement or reversal, a perfect place to take partial profit.
Manage risk: Traders can use the Volatility Impulse Indicator to manage risk. When the market is highly volatile, traders can place stop-loss orders at strategic levels, thereby limiting their risk.
█ Any Alert Function Call
Any alert function call allows traders to combine predefined alerts. For example, they can pair 'trend is positive' with 'volatility line spikes below the lower band,' and so on.
-----------------
Disclaimer
The information contained in my Scripts/Indicators/Ideas/Algos/Systems does not constitute financial advice or a solicitation to buy or sell any securities of any type. I will not accept liability for any loss or damage, including without limitation any loss of profit, which may arise directly or indirectly from the use of or reliance on such information.
All investments involve risk, and the past performance of a security, industry, sector, market, financial product, trading strategy, backtest, or individual's trading does not guarantee future results or returns. Investors are fully responsible for any investment decisions they make. Such decisions should be based solely on an evaluation of their financial circumstances, investment objectives, risk tolerance, and liquidity needs.
My Scripts/Indicators/Ideas/Algos/Systems are only for educational purposes!
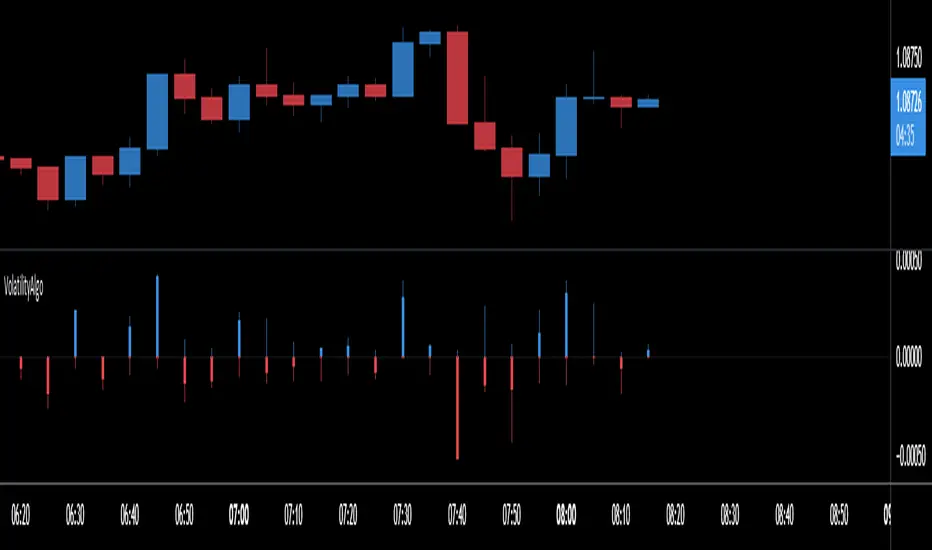
VolatilityAlgoThis indicator allows you to calculate the precise volatility in real time
> Allows analyzing the periods of high/low volatility
> Also to do a technical analysis on the volatility of each bar
> It works with all assets as well as all periods
Here are the different Values:
Upper Volatility Calculation
1 open to close
2 open to high
3 upper shadow
Lower Volatility Calculation
4 open to close
5 open to low
6 lower shadow
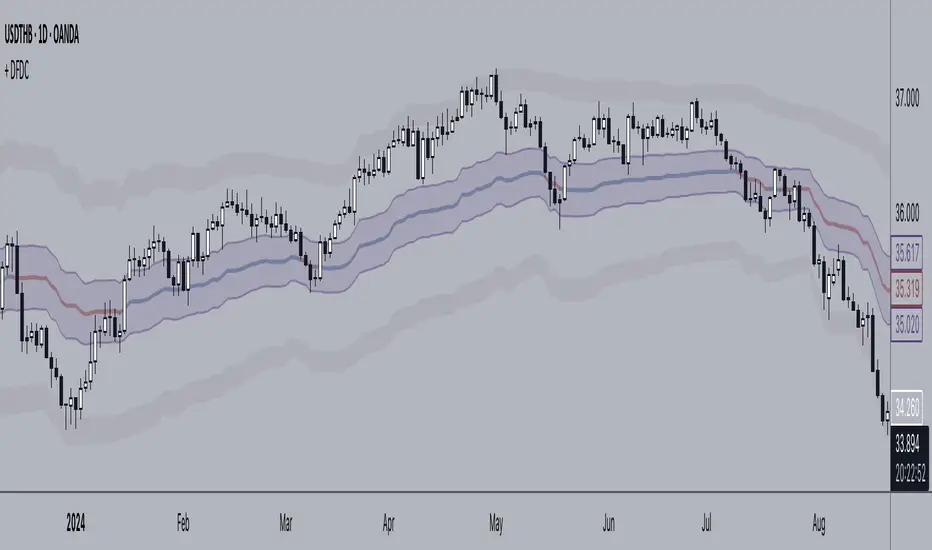
+ Dynamic Fibo-Donchian ChannelsThis is my second Donchian Channels indicator (and will probably be my last because how many does one really need). This version is different from my other one in that, well, it's 'dynamic' which simply means that it self adjusts based on the same formula that my Ultimate Moving Average does. What does that mean? It just means that the script takes an average of 8 different length, in this case, highest highs and lowest lows. The user doesn't need to pick a lookback/length/period/what-have-you. The indicator does it all itself. This, I think, makes for a very nice baseline or bias indicator to fit within a system that utilizes something like that. I also think it makes for a more accurate gauge of higher highs and lower lows within a timeframe, because honestly what does it mean to make a lower low over 20 periods or 8 periods or 50 periods? I don't know. What I do know is that traditional Donchian Channels never made much sense to me, but this does.
Additionally, I've kept (I guess that's not 'additionally') the fibonacci retracement levels from my other Donchian Channels indicator. These are calculated off the high and the low of the Donchian Channels themselves. You will see that there are only three retracement levels (.786, .705, .382), one of which is not a fib level, but what some people call the 'OTE,' or 'optimal trade entry.'' If you want more info on the OTE just web search it. So, why no .618 or .236? Reason being that the .618 overlaps the .382, and the .236 is extremely close to the .786. This sounds confusing, but the retracement levels I'm using are derived from the high and low, so it was unnecessary to have all five levels from each. I could have just calculated from the high, or just from the low, and used all the levels, but I chose to just calculate three levels from the high and three from the low because that gives a sort of mirror image balance, and that appeals to me, and the utility of the indicator is the same.
The plot lines are all colored, and I've filled certain zones between them. There is a center zone filled between both .382 levels, an upper and lower zon filled between the .786 and either the high or the low, and a zone between the .705 and .785
If you like the colored zones, but don't like the plots because they cause screen compression, turn off the plots under the "style" tab, or much more simply right click on the price scale and click 'scale price chart only.' Voila! No more screen compression due to a moving average or some other annoyance.
Besides that basis being a nice baseline indicator the various fib bands (or just the high and low bands) make for excellent mean reversion extremes in ranging environments.
There are alerts for candle closes across every line.
Below is an image of the indicator at default settings.
Below is an image of the indicator with the center .382 channel turned off.
Below is an image of the indicator with just the .786/.705 channel showing .
VIX Volatility Trend Analysis With Signals - Stocks OnlyVIX VOLATILITY TREND ANALYSIS CLOUD WITH BULLISH & BEARISH SIGNALS - STOCKS ONLY
This indicator is a visual aid that shows you the bullish or bearish trend of VIX market volatility so you can see the VIX trend without switching charts. When volatility goes up, most stocks go down and vice versa. When the cloud turns green, it is a bullish sign. When the cloud turns red, it is a bearish sign.
This indicator is meant for stocks with a lot of price action and volatility, so for best results, use it on charts that move similar to the S&P 500 or other similar charts.
This indicator uses real time data from the stock market overall, so it should only be used on stocks and will only give a few signals during after hours. It does work ok for crypto, but will not give signals when the US stock market is closed.
**HOW TO USE**
When the VIX Volatility Index trend changes direction, it will give a green or red line on the chart depending on which way the VIX is now trending. The cloud will also change color depending on which way the VIX is trending. Use this to determine overall market volatility and place trades in the direction that the indicator is showing. Do not use this by itself as sometimes markets won’t react perfectly to the overall market volatility. It should only be used as a secondary confirmation in your trading/trend analysis.
For more signals with earlier entries, go into settings and reduce the number. 10-100 is best for scalping. For less signals with later entries, change the number to a higher value. Use 100-500 for swing trades. Can go higher for long swing trades. Our favorite settings are 20, 60, 100, 500 and 1000.
***MARKETS***
This indicator should only be used on the US stock markets as signals are given based on the VIX volatility index which measures volatility of the US Stock Markets.
***TIMEFRAMES***
This indicator works on all time frames, but after hours will not change much at all due to the markets being closed.
**INVERSE CHARTS**
If you are using this on an inverse ETF and the signals are showing backwards, please comment with what chart it is and I will configure the indicator to give the correct signals. I have included over 50 inverse ETFs into the code to show the correct signals on inverse charts, but I'm sure there are some that I have missed so feel free to let me know and I will update the script with the requested tickers.
***TIPS***
Try using numerous indicators of ours on your chart so you can instantly see the bullish or bearish trend of multiple indicators in real time without having to analyze the data. Some of our favorites are our Auto Fibonacci, Directional Movement Index, Volume Profile with buy & sell pressure, Auto Support And Resistance, Vix Scalper and Money Flow Index in combination with this Vix Trend Analysis. They all have real time Bullish and Bearish labels as well so you can immediately understand each indicator's trend.

Volatility Risk Premium GOLD & SILVER 1.0ENGLISH
This indicator (V-R-P) calculates the (one month) Volatility Risk Premium for GOLD and SILVER.
V-R-P is the premium hedgers pay for over Realized Volatility for GOLD and SILVER options.
The premium stems from hedgers paying to insure their portfolios, and manifests itself in the differential between the price at which options are sold (Implied Volatility) and the volatility GOLD and SILVER ultimately realize (Realized Volatility).
I am using 30-day Implied Volatility (IV) and 21-day Realized Volatility (HV) as the basis for my calculation, as one month of IV is based on 30 calendaristic days and one month of HV is based on 21 trading days.
At first, the indicator appears blank and a label instructs you to choose which index you want the V-R-P to plot on the chart. Use the indicator settings (the sprocket) to choose one of the precious metals (or both).
Together with the V-R-P line, the indicator will show its one year moving average within a range of +/- 15% (which you can change) for benchmarking purposes. We should consider this range the “normalized” V-R-P for the actual period.
The Zero Line is also marked on the indicator.
Interpretation
When V-R-P is within the “normalized” range, … well... volatility and uncertainty, as it’s seen by the option market, is “normal”. We have a “premium” of volatility which should be considered normal.
When V-R-P is above the “normalized” range, the volatility premium is high. This means that investors are willing to pay more for options because they see an increasing uncertainty in markets.
When V-R-P is below the “normalized” range but positive (above the Zero line), the premium investors are willing to pay for risk is low, meaning they see decreasing uncertainty and risks in the market, but not by much.
When V-R-P is negative (below the Zero line), we have COMPLACENCY. This means investors see upcoming risk as being lower than what happened in the market in the recent past (within the last 30 days).
CONCEPTS :
Volatility Risk Premium
The volatility risk premium (V-R-P) is the notion that implied volatility (IV) tends to be higher than realized volatility (HV) as market participants tend to overestimate the likelihood of a significant market crash.
This overestimation may account for an increase in demand for options as protection against an equity portfolio. Basically, this heightened perception of risk may lead to a higher willingness to pay for these options to hedge a portfolio.
In other words, investors are willing to pay a premium for options to have protection against significant market crashes even if statistically the probability of these crashes is lesser or even negligible.
Therefore, the tendency of implied volatility is to be higher than realized volatility, thus V-R-P being positive.
Realized/Historical Volatility
Historical Volatility (HV) is the statistical measure of the dispersion of returns for an index over a given period of time.
Historical volatility is a well-known concept in finance, but there is confusion in how exactly it is calculated. Different sources may use slightly different historical volatility formulas.
For calculating Historical Volatility I am using the most common approach: annualized standard deviation of logarithmic returns, based on daily closing prices.
Implied Volatility
Implied Volatility (IV) is the market's forecast of a likely movement in the price of the index and it is expressed annualized, using percentages and standard deviations over a specified time horizon (usually 30 days).
IV is used to price options contracts where high implied volatility results in options with higher premiums and vice versa. Also, options supply and demand and time value are major determining factors for calculating Implied Volatility.
Implied Volatility usually increases in bearish markets and decreases when the market is bullish.
For determining GOLD and SILVER implied volatility I used their volatility indices: GVZ and VXSLV (30-day IV) provided by CBOE.
Warning
Please be aware that because CBOE doesn’t provide real-time data in Tradingview, my V-R-P calculation is also delayed, so you shouldn’t use it in the first 15 minutes after the opening.
This indicator is calibrated for a daily time frame.
----------------------------------------------------------------------
ESPAŇOL
Este indicador (V-R-P) calcula la Prima de Riesgo de Volatilidad (de un mes) para GOLD y SILVER.
V-R-P es la prima que pagan los hedgers sobre la Volatilidad Realizada para las opciones de GOLD y SILVER.
La prima proviene de los hedgers que pagan para asegurar sus carteras y se manifiesta en el diferencial entre el precio al que se venden las opciones (Volatilidad Implícita) y la volatilidad que finalmente se realiza en el ORO y la PLATA (Volatilidad Realizada).
Estoy utilizando la Volatilidad Implícita (IV) de 30 días y la Volatilidad Realizada (HV) de 21 días como base para mi cálculo, ya que un mes de IV se basa en 30 días calendario y un mes de HV se basa en 21 días de negociación.
Al principio, el indicador aparece en blanco y una etiqueta le indica que elija qué índice desea que el V-R-P represente en el gráfico. Use la configuración del indicador (la rueda dentada) para elegir uno de los metales preciosos (o ambos).
Junto con la línea V-R-P, el indicador mostrará su promedio móvil de un año dentro de un rango de +/- 15% (que puede cambiar) con fines de evaluación comparativa. Deberíamos considerar este rango como el V-R-P "normalizado" para el período real.
La línea Cero también está marcada en el indicador.
Interpretación
Cuando el V-R-P está dentro del rango "normalizado",... bueno... la volatilidad y la incertidumbre, como las ve el mercado de opciones, es "normal". Tenemos una “prima” de volatilidad que debería considerarse normal.
Cuando V-R-P está por encima del rango "normalizado", la prima de volatilidad es alta. Esto significa que los inversores están dispuestos a pagar más por las opciones porque ven una creciente incertidumbre en los mercados.
Cuando el V-R-P está por debajo del rango "normalizado" pero es positivo (por encima de la línea Cero), la prima que los inversores están dispuestos a pagar por el riesgo es baja, lo que significa que ven una disminución, pero no pronunciada, de la incertidumbre y los riesgos en el mercado.
Cuando V-R-P es negativo (por debajo de la línea Cero), tenemos COMPLACENCIA. Esto significa que los inversores ven el riesgo próximo como menor que lo que sucedió en el mercado en el pasado reciente (en los últimos 30 días).
CONCEPTOS :
Prima de Riesgo de Volatilidad
La Prima de Riesgo de Volatilidad (V-R-P) es la noción de que la Volatilidad Implícita (IV) tiende a ser más alta que la Volatilidad Realizada (HV) ya que los participantes del mercado tienden a sobrestimar la probabilidad de una caída significativa del mercado.
Esta sobreestimación puede explicar un aumento en la demanda de opciones como protección contra una cartera de acciones. Básicamente, esta mayor percepción de riesgo puede conducir a una mayor disposición a pagar por estas opciones para cubrir una cartera.
En otras palabras, los inversores están dispuestos a pagar una prima por las opciones para tener protección contra caídas significativas del mercado, incluso si estadísticamente la probabilidad de estas caídas es menor o insignificante.
Por lo tanto, la tendencia de la Volatilidad Implícita es de ser mayor que la Volatilidad Realizada, por lo cual el V-R-P es positivo.
Volatilidad Realizada/Histórica
La Volatilidad Histórica (HV) es la medida estadística de la dispersión de los rendimientos de un índice durante un período de tiempo determinado.
La Volatilidad Histórica es un concepto bien conocido en finanzas, pero existe confusión sobre cómo se calcula exactamente. Varias fuentes pueden usar fórmulas de Volatilidad Histórica ligeramente diferentes.
Para calcular la Volatilidad Histórica, utilicé el enfoque más común: desviación estándar anualizada de rendimientos logarítmicos, basada en los precios de cierre diarios.
Volatilidad Implícita
La Volatilidad Implícita (IV) es la previsión del mercado de un posible movimiento en el precio del índice y se expresa anualizada, utilizando porcentajes y desviaciones estándar en un horizonte de tiempo específico (generalmente 30 días).
IV se utiliza para cotizar contratos de opciones donde la alta Volatilidad Implícita da como resultado opciones con primas más altas y viceversa. Además, la oferta y la demanda de opciones y el valor temporal son factores determinantes importantes para calcular la Volatilidad Implícita.
La Volatilidad Implícita generalmente aumenta en los mercados bajistas y disminuye cuando el mercado es alcista.
Para determinar la Volatilidad Implícita de GOLD y SILVER utilicé sus índices de volatilidad: GVZ y VXSLV (30 días IV) proporcionados por CBOE.
Precaución
Tenga en cuenta que debido a que CBOE no proporciona datos en tiempo real en Tradingview, mi cálculo de V-R-P también se retrasa, y por este motivo no se recomienda usar en los primeros 15 minutos desde la apertura.
Este indicador está calibrado para un marco de tiempo diario.

Volatility Risk Premium (VRP) 1.0ENGLISH
This indicator (V-R-P) calculates the (one month) Volatility Risk Premium for S&P500 and Nasdaq-100.
V-R-P is the premium hedgers pay for over Realized Volatility for S&P500 and Nasdaq-100 index options.
The premium stems from hedgers paying to insure their portfolios, and manifests itself in the differential between the price at which options are sold (Implied Volatility) and the volatility the S&P500 and Nasdaq-100 ultimately realize (Realized Volatility).
I am using 30-day Implied Volatility (IV) and 21-day Realized Volatility (HV) as the basis for my calculation, as one month of IV is based on 30 calendaristic days and one month of HV is based on 21 trading days.
At first, the indicator appears blank and a label instructs you to choose which index you want the V-R-P to plot on the chart. Use the indicator settings (the sprocket) to choose one of the indices (or both).
Together with the V-R-P line, the indicator will show its one year moving average within a range of +/- 15% (which you can change) for benchmarking purposes. We should consider this range the “normalized” V-R-P for the actual period.
The Zero Line is also marked on the indicator.
Interpretation
When V-R-P is within the “normalized” range, … well... volatility and uncertainty, as it’s seen by the option market, is “normal”. We have a “premium” of volatility which should be considered normal.
When V-R-P is above the “normalized” range, the volatility premium is high. This means that investors are willing to pay more for options because they see an increasing uncertainty in markets.
When V-R-P is below the “normalized” range but positive (above the Zero line), the premium investors are willing to pay for risk is low, meaning they see decreasing uncertainty and risks in the market, but not by much.
When V-R-P is negative (below the Zero line), we have COMPLACENCY. This means investors see upcoming risk as being lower than what happened in the market in the recent past (within the last 30 days).
CONCEPTS:
Volatility Risk Premium
The volatility risk premium (V-R-P) is the notion that implied volatility (IV) tends to be higher than realized volatility (HV) as market participants tend to overestimate the likelihood of a significant market crash.
This overestimation may account for an increase in demand for options as protection against an equity portfolio. Basically, this heightened perception of risk may lead to a higher willingness to pay for these options to hedge a portfolio.
In other words, investors are willing to pay a premium for options to have protection against significant market crashes even if statistically the probability of these crashes is lesser or even negligible.
Therefore, the tendency of implied volatility is to be higher than realized volatility, thus V-R-P being positive.
Realized/Historical Volatility
Historical Volatility (HV) is the statistical measure of the dispersion of returns for an index over a given period of time.
Historical volatility is a well-known concept in finance, but there is confusion in how exactly it is calculated. Different sources may use slightly different historical volatility formulas.
For calculating Historical Volatility I am using the most common approach: annualized standard deviation of logarithmic returns, based on daily closing prices.
Implied Volatility
Implied Volatility (IV) is the market's forecast of a likely movement in the price of the index and it is expressed annualized, using percentages and standard deviations over a specified time horizon (usually 30 days).
IV is used to price options contracts where high implied volatility results in options with higher premiums and vice versa. Also, options supply and demand and time value are major determining factors for calculating Implied Volatility.
Implied Volatility usually increases in bearish markets and decreases when the market is bullish.
For determining S&P500 and Nasdaq-100 implied volatility I used their volatility indices: VIX and VXN (30-day IV) provided by CBOE.
Warning
Please be aware that because CBOE doesn’t provide real-time data in Tradingview, my V-R-P calculation is also delayed, so you shouldn’t use it in the first 15 minutes after the opening.
This indicator is calibrated for a daily time frame.
ESPAŇOL
Este indicador (V-R-P) calcula la Prima de Riesgo de Volatilidad (de un mes) para S&P500 y Nasdaq-100.
V-R-P es la prima que pagan los hedgers sobre la Volatilidad Realizada para las opciones de los índices S&P500 y Nasdaq-100.
La prima proviene de los hedgers que pagan para asegurar sus carteras y se manifiesta en el diferencial entre el precio al que se venden las opciones (Volatilidad Implícita) y la volatilidad que finalmente se realiza en el S&P500 y el Nasdaq-100 (Volatilidad Realizada).
Estoy utilizando la Volatilidad Implícita (IV) de 30 días y la Volatilidad Realizada (HV) de 21 días como base para mi cálculo, ya que un mes de IV se basa en 30 días calendario y un mes de HV se basa en 21 días de negociación.
Al principio, el indicador aparece en blanco y una etiqueta le indica que elija qué índice desea que el V-R-P represente en el gráfico. Use la configuración del indicador (la rueda dentada) para elegir uno de los índices (o ambos).
Junto con la línea V-R-P, el indicador mostrará su promedio móvil de un año dentro de un rango de +/- 15% (que puede cambiar) con fines de evaluación comparativa. Deberíamos considerar este rango como el V-R-P "normalizado" para el período real.
La línea Cero también está marcada en el indicador.
Interpretación
Cuando el V-R-P está dentro del rango "normalizado",... bueno... la volatilidad y la incertidumbre, como las ve el mercado de opciones, es "normal". Tenemos una “prima” de volatilidad que debería considerarse normal.
Cuando V-R-P está por encima del rango "normalizado", la prima de volatilidad es alta. Esto significa que los inversores están dispuestos a pagar más por las opciones porque ven una creciente incertidumbre en los mercados.
Cuando el V-R-P está por debajo del rango "normalizado" pero es positivo (por encima de la línea Cero), la prima que los inversores están dispuestos a pagar por el riesgo es baja, lo que significa que ven una disminución, pero no pronunciada, de la incertidumbre y los riesgos en el mercado.
Cuando V-R-P es negativo (por debajo de la línea Cero), tenemos COMPLACENCIA. Esto significa que los inversores ven el riesgo próximo como menor que lo que sucedió en el mercado en el pasado reciente (en los últimos 30 días).
CONCEPTOS:
Prima de Riesgo de Volatilidad
La Prima de Riesgo de Volatilidad (V-R-P) es la noción de que la Volatilidad Implícita (IV) tiende a ser más alta que la Volatilidad Realizada (HV) ya que los participantes del mercado tienden a sobrestimar la probabilidad de una caída significativa del mercado.
Esta sobreestimación puede explicar un aumento en la demanda de opciones como protección contra una cartera de acciones. Básicamente, esta mayor percepción de riesgo puede conducir a una mayor disposición a pagar por estas opciones para cubrir una cartera.
En otras palabras, los inversores están dispuestos a pagar una prima por las opciones para tener protección contra caídas significativas del mercado, incluso si estadísticamente la probabilidad de estas caídas es menor o insignificante.
Por lo tanto, la tendencia de la Volatilidad Implícita es de ser mayor que la Volatilidad Realizada, por lo cual el V-R-P es positivo.
Volatilidad Realizada/Histórica
La Volatilidad Histórica (HV) es la medida estadística de la dispersión de los rendimientos de un índice durante un período de tiempo determinado.
La Volatilidad Histórica es un concepto bien conocido en finanzas, pero existe confusión sobre cómo se calcula exactamente. Varias fuentes pueden usar fórmulas de Volatilidad Histórica ligeramente diferentes.
Para calcular la Volatilidad Histórica, utilicé el enfoque más común: desviación estándar anualizada de rendimientos logarítmicos, basada en los precios de cierre diarios.
Volatilidad Implícita
La Volatilidad Implícita (IV) es la previsión del mercado de un posible movimiento en el precio del índice y se expresa anualizada, utilizando porcentajes y desviaciones estándar en un horizonte de tiempo específico (generalmente 30 días).
IV se utiliza para cotizar contratos de opciones donde la alta Volatilidad Implícita da como resultado opciones con primas más altas y viceversa. Además, la oferta y la demanda de opciones y el valor temporal son factores determinantes importantes para calcular la Volatilidad Implícita.
La Volatilidad Implícita generalmente aumenta en los mercados bajistas y disminuye cuando el mercado es alcista.
Para determinar la Volatilidad Implícita de S&P500 y Nasdaq-100 utilicé sus índices de volatilidad: VIX y VXN (30 días IV) proporcionados por CBOE.
Precaución
Tenga en cuenta que debido a que CBOE no proporciona datos en tiempo real en Tradingview, mi cálculo de V-R-P también se retrasa, y por este motivo no se recomienda usar en los primeros 15 minutos desde la apertura.
Este indicador está calibrado para un marco de tiempo diario.

TradeChartist Actuator™TradeChartist Actuator is an extremely functional indicator that converts the price action volatility and momentum into a meaningful trading system (based on user defined Standard Deviation Factor), that consists of expanding/contracting Volatility Range Bands, Dynamic Trend Support/Resistance Bands and 2 types of Breakout Signals in a visually stunning design. The script also neatly packs in ZigZag & manual/automatic Fibonacci Retracement tools, option to filter the signals using an external filter and other useful extras like ™TradeChartist Dollar Candles and much more.
===================================================================================================================
™TradeChartist Actuator User Manual
█ Actuator Range Bands
Actuator Range Bands consists of a Mean line, an Upper Band and a Lower Band which are based on user defined Standard Deviation Factor (Default - 1.618, Min - 0.5, Max - 2). The 1.618 factor works extremely well as the unnecessary volatility data of the bands are eliminated by Actuator's logic. In my personal tests, 1.618 works consistently better than any other value in visually showcasing the true volatility range. By eliminating the unnecessary volatility data from the original non-stabilized bands, Actuator helps detect price momentum by detecting two types of breakouts.
Bands Breakout - Filtered
When the price breaks out of the upper or lower band after a trend, there is a strong possibility of a reversal especially when the volatility expansion/contraction takes place. This is detected using a built in filter with the Filtered Bands Breakout and the user can choose to use the closing price or High/Low price as the trigger for breakouts. This trade setup is very useful especially at zones where the Actuator Range Bands contract or squeeze after an expansion as shown in the OANDA:XAUUSD 1hr chart below.
Also, after a consistent expansion of the bands with price trending in the upper channel or the lower channel, users can spot good profit taking or Short trade opportunities with confirmation of overbought price and if possible a strong bear divergence as show in the BINANCE:LUNAUSDTPERP 1hr chart below.
It can be seen from the chart above that even though Actuator is designed to detect Extreme Bands Breakout using High/Low price, it is done with a little bit of filtering by the script logic and hence didn't generate a Bear signal at the lower band support zone.
Mean Breakout - Filtered
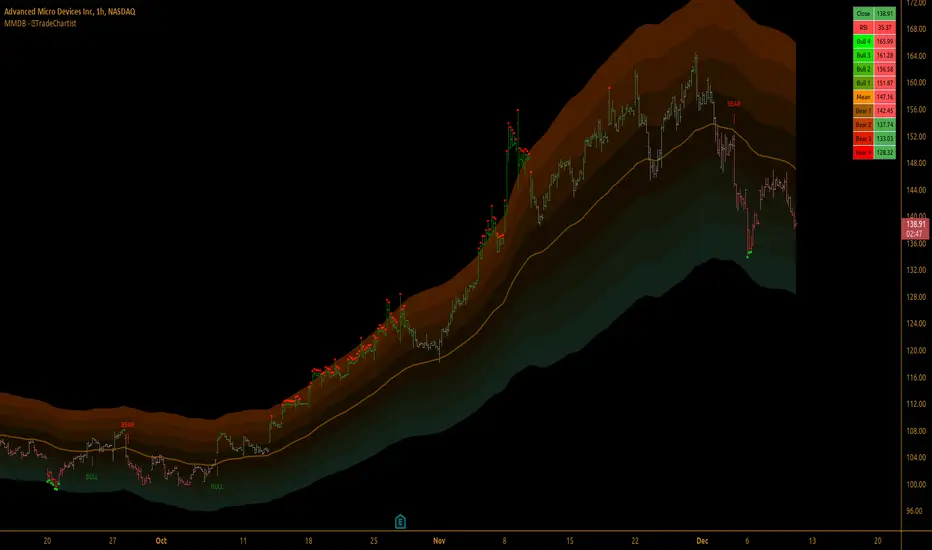
In most Mean Reversion models, mostly oscillators, the mean plays an important role in helping traders predict the price dynamic, but it also presents a challenge whether that mean will act as support or resistance so the trader can take a position that will have a high probability of success. Filtered Mean Breakout helps exactly to identify the price dynamic at the mean zone and helps reduce the dilemma. Actuator uses Volatility Trend and Momentum of the price action at mean to determine Bull/Bear breakouts. Following NASDAQ:AAPL 1hr chart shows an example of 2 instances of Filtered Mean Breakout detection, one bull and one bear and further area where no Breakout was detected in spite of price crossing the mean.
This Breakout type is really helpful in spotting early moves and also reduces the high volatility risk of Extreme Bands Breakout in some cases.
===================================================================================================================
█ External Filter
Actuator breakout signals can be further filtered using the feature of connecting an external signal as a trade filter.
External filter like RSI , MACD etc. can be used to filter breakouts by connecting to ™TradeChartist Actuator under ╔═══ 𝗣𝗹𝘂𝗴 𝗙𝗶𝗹𝘁𝗲𝗿 𝗵𝗲𝗿𝗲 ═══ 🔌 dropdown by enabling 𝐔𝐬𝐞 𝐄𝐱𝐭𝐞𝐫𝐧𝐚𝐥 𝐅𝐢𝐥𝐭𝐞𝐫.
To get the external filter to work, 𝐒𝐢𝐠𝐧𝐚𝐥 𝐓𝐲𝐩𝐞 must be set right. For plots that are non oscillatory like Moving Averages, Super Trend etc., choose type as Non Oscillatory and for Oscillators like RSI , CCI , MACD etc., choose type as Oscillatory .
For Oscillators, levels must be specified for 𝐎𝐬𝐜𝐢𝐥𝐥𝐚𝐭𝐨𝐫 𝐁𝐮𝐥𝐥 𝐅𝐢𝐥𝐭𝐞𝐫 𝐯𝐚𝐥𝐮𝐞 and 𝐎𝐬𝐜𝐢𝐥𝐥𝐚𝐭𝐨𝐫 𝐁𝐞𝐚𝐫 𝐅𝐢𝐥𝐭𝐞𝐫 𝐯𝐚𝐥𝐮𝐞, especially if the Oscillator doesnt have 0 as midline, like RSI . Even for 0 mid oscillators like CCI , filter levels like 100/-100 work effectively to filter noise.
Use 𝐁𝐮𝐥𝐥/𝐁𝐞𝐚𝐫 𝐁𝐚𝐜𝐤𝐠𝐫𝐨𝐮𝐧𝐝 𝐅𝐢𝐥𝐥 under Actuator Visuals section to paint the trade zones background. It helps visually see the effect of filters on the breakout entries and also the trade performance.
The following chart shows the Filter settings with ™TradeChartist Momentum Drift Oscillator connected to Actuator as Oscillatory signal with filter values 0.
The two example charts of 1hr BINANCE:BTCUSDT below shows the difference in Actuator signals based on Oscillatory signal from ™TradeChartist Momentum Drift Oscillator and the difference can be seen from the highlighted Bull/Bear Background Fill.
Without External Filter
With External Filter
===================================================================================================================
█ Dynamic Trend Support/Resistance Bands
In addition to Volatility Range Bands, Actuator also plots Dynamic Trend Support and Resistance bands that are more sensitive to price action and helps the user determine growing support/resistance which is indicated by coloured dots. These dots normally appear when the Support or Resistance stays at the same level for a few bars and change between Bull and Bear colours based on how the price interacts with them as shown below.
===================================================================================================================
█ Useful Trade Tools
™TradeChartist Dollar Candles
Dollar Candles help detect the volatility exhaustion prices and plots $ signs to help the trader take profits or move stop loss levels to secure gains. The $ signs do not appear for every trade zone, but whenever price hits a critical level, it shows up above price bar (for Bull trend) or below price bar (for Bear trend) in real time. Users can also set alerts for Dollar Candles with Once Per Bar setting. The Daily NASDAQ:TSLA chart below shows the Dollar Candles on both Bull and Bear trends.
It is important to note that taking pockets of profits on a leveraged trade position or moving up stop loss to maximize trend gains at $ candles will help increase Average Profitability Per Trade (APPT) .
Bull/Bear Background Fill
Bull/Bear Background Fill paints the trade zones in Bull and Bear colours. This helps visualize the difference in trade zones when testing various settings and also helps analyze past performance of Actuator Signals with or without the use of External Filter.
Entry Stop Loss Reference
Reference zone for stop loss has always been a tricky one for traders. Using a fixed percentage stop at entry may not be best during high volatility moves. Over the extensive period of Actuator testing, a simple solution to this problem was found. The previous trend's Range Bands Mean Line served as a perfect reference point for Entry Stop. Also while analysing this Mean line, it was found to be a perfect horizontal support/resistance line and also helped detect unproductive trades. The example 15m chart of NASDAQ:AMD shows how the Entry Stop Loss Reference performed.
Stop Line Touch Points plot orange touch points on the Stop Line whenever the price hits it during the trade.
Actuator Colour Bars
Actuator Colour Bars paints the Momentum Strength on the price bars. This helps visually see the price bars venturing into the Overbought or the Oversold zones. Also, this feature also helps spot divergences as higher highs or lower lows with less intense Bull/Bear colour than the previous high/low shows diminishing momentum as shown in the 1h chart of OANDA:GBPJPY below.
===================================================================================================================
█ ZigZag & Fibonacci Toolkit
Actuator plots developing and completed ZigZags based on Bull and Bear trend depending on the Breakout Type and Breakout Price from the settings.
Option to enable or disable 𝐙𝐢𝐠𝐙𝐚𝐠 𝐂𝐨𝐧𝐧𝐞𝐜𝐭𝐨𝐫 which can be helpful for Harmonic traders.
Option to display 𝐙𝐢𝐠𝐙𝐚𝐠 𝐇𝐢𝐠𝐡𝐬/𝐋𝐨𝐰𝐬 and 𝐑𝐒𝐈 𝐚𝐭 𝐇𝐢𝐠𝐡𝐬/𝐋𝐨𝐰𝐬 in one of two styles.
Two types of Fibonacci to choose from - 𝐀𝐮𝐭𝐨-𝐅𝐢𝐛𝐬 and 𝐅𝐢𝐛𝐬 𝐛𝐚𝐬𝐞𝐝 𝐨𝐧 𝐋𝐨𝐨𝐤𝐛𝐚𝐜𝐤.
𝐀𝐮𝐭𝐨-𝐅𝐢𝐛𝐬 option plots Auto Fibonacci levels based on Bull/Bear trend depending on user specified Breakout Type and Breakout Price.
𝐅𝐢𝐛𝐬 𝐛𝐚𝐬𝐞𝐝 𝐨𝐧 𝐋𝐨𝐨𝐤𝐛𝐚𝐜𝐤 plots Fibonacci levels based on the highest high and lowest low of the lookback period (𝐃𝐚𝐲𝐬 or 𝐂𝐚𝐧𝐝𝐥𝐞𝐬).
Fibonacci levels can be reversed by enabling 𝐑𝐞𝐯𝐞𝐫𝐬𝐞 from settings.
Enabling 𝐂𝐮𝐫𝐫𝐞𝐧𝐭 𝐏𝐫𝐢𝐜𝐞 𝐅𝐢𝐛 𝐋𝐚𝐛𝐞𝐥 displays the current Fib level of the developing price bar.
Option to customize Fib levels and colours.
4hr chart of BINANCE:BTCUSDT showing Auto Fibonacci levels, Zig-Zag with Trend High/Lows, Zig-Zag connectors with Fib Ratios and RSI at Trend High/Low prices.
Note:
If momentum doesn't slow down, the fibs can extend beyond 1 and may continue way beyond 4.618 fib level. These are quite rare depending on how distant the near high/low is based.
ZigZag and Fibonacci are good reference indicators and should always be used as confirmations rather than standalone indicators.
===================================================================================================================
█ Actuator Colour Scheme
Actuator employs 3 built in colour schemes namely Chilli , Flame and Sublime Grayscale and a versatile colour scheme Custom which enables the user to customise the colour combinations of the components of the Actuator script.
===================================================================================================================
█ Alerts
Alerts can be created for the following.
Actuator Bull Breakout Signal - Once Per Bar Close
Actuator Bear Breakout Signal - Once Per Bar Close
Actuator Long Dollar - Take Profit - Once Per Bar
Actuator Short Dollar - Take Profit - Once Per Bar
Actuator Stop Line Hit - Once Per Bar
Note: The script doesn't repaint, so the alerts can be used with confidence. To check this, users can do bar replays to check if the plots and markers stay in the same place.
===================================================================================================================
Best Practice: Test with different settings first using Paper Trades before trading with real money
===================================================================================================================

TradeChartist Mean Momentum Drift Bands (MMDB)™TradeChartist Mean Momentum Drift Bands (MMDB) is a Momentum indicator that plots a Mean Momentum line (calculated automatically from sample means of many lookback periods decided by the script logic) and Upper/Lower Drift Bands (calculated using standard deviation). The script helps spot price volatility, Oversold/Overbought zones and also generates high probability breakout signals without any user input.
===================================================================================================================
Features of ™TradeChartist MMDB
==============================
Momentum Mean and 4 upper/lower Drift bands.
No User input required.
3 Visual colour schemes - Chilli, Flame and Custom.
MMDB table that shows asset's price, RSI and values of Mean & Upper/Lower Drift bands
Breakout Signals (Bull and Bear arrows) based on price closing above or below the 1st Drift Band.
Overbought and Oversold zones.
Colour Bars based on Momentum strength.
Alerts for Bull and Bear Breakouts ( Once per bar close to be used).
===================================================================================================================
Example Charts
1. MMDB used along with ™TradeChartist MMDO (Mean Momentum Drift Oscillator) on 4hr chart of BINANCE:BTCUSDT
2. MMDB on 4hr chart of OANDA:XAUUSD
3. MMDB on 1hr chat of OANDA:SPX500USD
4. MMDB connected to ™TradeChartist Plug and Trade on BINANCE:LINKUSDTPERP
===================================================================================================================
Note: The script doesn't repaint, so the alerts can be used with confidence. To check this, users can do bar replay to confirm if the plots and markers stay in the same place.
===================================================================================================================
Best Practice: Test with different settings first using Paper Trades before trading with real money
===================================================================================================================
Mid to High daily % - MA & ThresholdPurpose of this script is to provide a metric for comparing crypto volatility in terms of the % gain that can be garnished if you buy the midpoint price of the day and sell the high***. I'm specifically using bots that buy non-stop. This metric makes it easy to compare crypto coins while also providing insight on what a take profit % should be if I want to be sure it closes often instead of getting stuck in a position.
Added a few moving averages of (Mid-range to High Daily %). When these lines starts to trend down, it's time to lower the take profit % or move on to the next coin.
Decided to add a threshold so I could easily mark where I think the (Mid-range to High Daily %) is for most days.
Ex. I can mark 10% threshold and can eyeball roughly ~75% of the days in the past month or so were at or above that level. Then I know I have plenty volatility for a bot taking 5% profit. Also if you have plenty of periodic poke-through that month (let's say once a week) you might argue that you can set it to 7% if you're willing to wait about that long. Either way this metric is conservative because it is only the middle of the range to the high, a less conservative version might provide the % gain if you bought the day low and sold the day high.
***Since this calculation only takes the middle of the range and the high of the day into account, red days are volatile against a buyer but to your advantage if you are a seller. BUT if you have plenty of safety buy orders this volatility in price only means your total purchase volume increases and when/if you reach a take profit level you sell more there.
Would like to upgrade and add a separate MA line for green days and a separate MA line for red days to discern if that particular coin has a bias. Also would like to include some statistics on how many candles are above or below threshold for a certain period instead of eyeballing.

TradeChartist Volatizer™TradeChartist Volatizer (Volatility Visualizer) is an exceptionally well designed script that helps visualize Price Volatility and Momentum with the help of various Visual components including Volatizer Bands and Mean line, Support/Resistance levels, Trade Signals and much more. Volatizer's ability to filter trades based on Volatizer Bands, initial Support/Resistance breach, along with the use of External Filter makes it an extremely functional and a useful indicator in addition to its visually engaging design.
===================================================================================================================
™𝗧𝗿𝗮𝗱𝗲𝗖𝗵𝗮𝗿𝘁𝗶𝘀𝘁 𝗩𝗼𝗹𝗮𝘁𝗶𝘇𝗲𝗿 𝗨𝘀𝗲𝗿 𝗠𝗮𝗻𝘂𝗮𝗹
======================================
𝗩𝗼𝗹𝗮𝘁𝗶𝘇𝗲𝗿 𝗕𝗮𝗻𝗱𝘀
Volatizer Bands comprises of an Upper Band, a Lower Band and a Mean line, that form the important components of this script. These bands are based on consolidation of various factors including comparison of volatility and Higher Time Frame (HTF) Momentum with that of the chart time frame. This helps visualize relative Volatility of the chart's price action in relation to the bands and the mean line. The width and the acceleration of the bands depend upon two of the only user inputs required in this script. They are
Volatizer Length - This is the lookback length required to plot the strength of the price action. This length also determines the Volatizer Levels and Fills that help visualize Volatility and Momentum of the asset observed/traded. Higher the length, longer the trend and higher the Risk:Reward ratio
Sensitivity - Users can choose one of 3 Sensitivity options ( Low , Optimal , High ) to adjust the degree of sensitivity of the Bands' reaction to the price action. High Sensitivity Bands react quicker to the price action based on underlying logic.
Example : 1hr chart of BINANCE:ETHUSDT using 24/High on the left and 24/Low on the right.
𝗩𝗼𝗹𝗮𝘁𝗶𝘇𝗲𝗿 𝗠𝗲𝗮𝗻
Volatizer mean is a critical component of the Bands as it can determine the nature of the price action based on how the price tests the Volatizer Mean. When the price is extremely volatile or trending and when it is influenced by Bull or Bear momentum, the Mean line can be the magnet for Pull Backs or Throw Backs. Mean Touch Points can be enabled or disabled from the settings.
Example - 1hr chart of BINANCE:ETHUSDT clearly showing the use of the Mean line and Orange Mean Touch Points.
Example - 1hr chart of BINANCE:ETHUSDT with Volatizer Levels/Fills enabled on the left and disabled on the right.
𝗜𝗻𝗶𝘁𝗶𝗮𝗹 𝗦𝘂𝗽𝗽𝗼𝗿𝘁/𝗥𝗲𝘀𝗶𝘀𝘁𝗮𝗻𝗰𝗲 𝗟𝗲𝘃𝗲𝗹𝘀
Volatizer plots automatic Initial Support/Resistance Levels when this option is enabled. This is based on the user input of Length and Sensitivity.
Example - 1hr chart of BINANCE:BTCUSDT with Initial Support/Resistance Levels enabled. Initial range for support/resistance is shown on the chart.
𝗣𝗿𝗼𝗳𝗶𝘁 𝗧𝗮𝗸𝗶𝗻𝗴 𝗭𝗼𝗻𝗲𝘀
Volatizer uses a clever logic that helps detect volatility exhaustion prices and plots $ signs to help the trader take profits or move stop loss levels to secure gains or to exit trade position. This option can be enabled or disabled by checking or unchecking Display Profit Taking Zones . These zones can also be important support/resistance zones based on the trend volatility and momentum.
Example - 1hr chart of BINANCE:BTCUSDT (Setting - 24/Low) showing $ signs to help traders. (Green $ for Bull Zones and Red $ for Bear Zones)
𝗧𝗿𝗮𝗱𝗲 𝗦𝗶𝗴𝗻𝗮𝗹𝘀 𝗮𝗻𝗱 𝗧𝗿𝗮𝗱𝗲 𝗙𝗶𝗹𝘁𝗲𝗿𝘀
The script can also be used to plot Trade Signals automatically with or without the use of Trade Filters. When the price shows bullish or bearish momentum when the price crosses above or below the mean, Bull or Bear plot appears on the chart to signal potential trend change. These signals can be filtered using one, two or all three filters listed below.
Filter Initial S/R Level Breakouts - Plots Signals only when the initial Support/Resistance levels get breached.
Filter using Volatizer Bands - Plots Signals only when the Upper/Lower bands get breached.
External Filter - Plots Signals only if crossover/breakout criteria of External Filter (Oscillatory or Non-Oscillatory Signal) is satisfied.
Example Charts for Trade Signals/ Filters using 1hr chart of NASDAQ:AMD (Setting - 24/Optimal)
1. Trade Signals without any filter
2. Trade Signals using Initial S/R Level Breakout Filter only
3. Trade Signals using Volatizer Bands Filter only
4. Trade Signals using External Filter - MDO (144) with 0 Filter values along with other 2 built in filters
𝗔𝗹𝗲𝗿𝘁𝘀
Alerts can be created using Trading View's Alert Creation box by choosing one of the following Volatizer Conditions.
Long - Alerts when Bull signal is generated. Use Once Per Bar Close
Long Take Profit - Alerts when $ signs are plotted during Bull Zone. Use Once Per Bar
Short - Alerts when Bear signal is generated. Use Once Per Bar Close
Short Take Profit - Alerts when $ signs are plotted during Bear Zone. Use Once Per Bar
Test of Mean - Alerts when price tests the Volatizer Mean line. Use Once Per Bar
Note: The indicator doesn't repaint even though a potential repaint warning appears when creating alerts. This can be confirmed by doing bar replay with vertical lines at various lines and trend change zones to get confidence using the indicator. The vertical lines will stay in the same place on both current time and when running a bar replay.
𝗩𝗼𝗹𝗮𝘁𝗶𝘇𝗲𝗿 𝗩𝗶𝘀𝘂𝗮𝗹𝘀
Visual settings like Colour scheme, Colour Bars, Fill Transparency and Initial Support/Resistance Linewidth can be adjusted/changed from the settings under Volatizer Visuals section.
𝗛𝗼𝘄 𝘁𝗼 𝘂𝘀𝗲 𝗩𝗼𝗹𝗮𝘁𝗶𝘇𝗲𝗿 𝗟𝗲𝗻𝗴𝘁𝗵 𝗮𝗻𝗱 𝗦𝗲𝗻𝘀𝗶𝘁𝗶𝘃𝗶𝘁𝘆 𝗲𝗳𝗳𝗲𝗰𝘁𝗶𝘃𝗲𝗹𝘆
1. As mentioned in the manual above, higher the length, longer the trend and higher the Risk:Reward ratio.
2. Sensitivity affects the frequency of the signals in general. Low Sensitivity will generate less frequent signals and High Sensitivity will generate more frequent signals as the Sensitivity affects how quickly the Bands react to the price action.
3. As a rule of thumb, it is recommended to use relevant numbers that seem to work well as Volatizer Length. These can be Fibonacci numbers like 5, 8 , 13, 21, 34, 55, 89, 144 etc. These can also be chart timeframe multipliers that relate to Higher Time Frame (HTF). For example, using 24 on 1hr chart will help see Volatizer Bands based on Daily volatility and momentum, 72 on 15m chart for 4hr trend and so on.
===================================================================================================================
There are several combinations of settings that can be tested on the asset traded based on timeframe and risk/reward expectations. The indicator can be used for trade entries with filter combinations or can be used as standalone Visualizer for trend confirmations, levels etc.
===================================================================================================================
Best Practice: Test with different settings first using Paper Trades before trading with real money
===================================================================================================================

TradeChartist Trend Splitter ™TradeChartist Trend Splitter is a visual Trend spotting script based on two simple models fused together - Dynamic Volatility Bands and Dynamic Mean Bands. The fusion of these two models based on user defined parameters of length, Volatility Risk and Mean Bands type, along with optional Trend Splitter color bars and Trend background split will make it visually engaging for any trader to understand the price action.
===================================================================================================================
Trend Splitter User Manual
========================
Trend Splitter settings has option to enable and disable the Volatility Bands and also the Mean Bands.
Under each heading, user can adjust the parameters to suit the trading style, based on time-frame traded.
Volatility Bands track the price action based on volatility trend lookback (Default - 55, MIn - 5, Max - 337) and also uses a Detector plot based on user defined risk (Default is 2.618, Min - 0.618, Max - 5) to continuously track the price action.
Mean Bands track the Mean values of the price action based on TradeChartist's original Mean Reversion Model based on one of 4 time tested Fib Lengths (Default - 55, Options - 55, 89, 144, 233, 337) and detects the price testing of Mean using Orange touchpoints.
Using Price Action in relation to both Volatility Bands and the Mean Bands, the script creates Mean Bands filtered Trend splits that plot Bull or Bear Trend background.
The Mean Bands Filter can be disabled for Trend Splits by just disabling Mean Bands from the settings. Also the option to display Trend Split background can also be enabled or disabled from the settings.
The settings also includes a useful feature to enable or disable coloured price bars using one of 3 colour themes.
Users can create alerts for Price testing mean, Bull and Bear trends using Long or Short from Trend Splitter's Alert Condition.
The indicator doesn't repaint even though a potential repaint warning appears when creating alerts. This can be confirmed by doing bar replay with vertical lines at various lines and trend change zones to get confidence using the indicator. The vertical lines will stay in the same place on both current time and when running a bar replay.
===================================================================================================================
Example Charts
1. 5m chart of BINANCE:AXSUSDTPERP using Trend Splitter (144, 2.618, Normal, 55) and TradeChartist Momentum Drift Oscillator (144 with Drift Visualizer). The Trend Splitter and MDO combo work brilliantly on Lower Time Frames and even on 15s/30s charts with MDO length of 144.
Best Practice - Always wait for a very long trend (over 337 bars on both MDO and Trend Splitter before taking a reverse trend trade at either Exhaustion or Super OB/OS zones of MDO) when using very low time-frames.
2. 5m chart of NYSE:PLTR using Trend Splitter (144, 3.618, Normal, 55) connected to TradeChartist Fib Master to plot Automatic Fibs. Just use Trend Identifier of Trend Splitter from Fib Master signal dropdown from settings, having both scripts active on chart.
3. Daily chart of OANDA:XAUUSD using Trend Splitter (using only Mean Bands - Weighted/144) to spot areas of support and resistance at Mean Bands.
Best Practice - Mean Bands can also act as confirmation indicator when used with other Trading View Indicators like RSI, Stohastic, Bollinger Bands etc.
4. Daily chart of COINBASE:ETHUSD using Trend Splitter (55, 0.618, Weighted, 55) connected to TradeChartist Plug and Trade to show Trend Splitter based Entries with Targets and Past Performance to assess the settings parameters in Trend Splitter. Just use Trend Identifier of Trend Splitter from Plug and Trade signal dropdown from settings, having both scripts active on chart.
===================================================================================================================
Best Practice: Test with different settings first using Paper Trades before trading with real money
===================================================================================================================

Sigma Spikes [CC]Sigma Spikes were created by Adam Grimes and this is one of the best volatility indicators out there. This indicator not only gives you positive or negative volatility but with my version I can identify any sudden changes from the underlying trend. Buy when the line turns green and sell when it turns red.
Let me know if there were any other indicators you wanted to see me publish!
TradeChartist Drifter Lite™TradeChartist Drifter Lite is an adeptly designed, functional and a visual indicator that plots trend-following Auto-Fibs , based on user defined lookback length, and includes the Ichimoku Cloud to help visualize the Price action in relation to the Support and Resistance limits of the Auto-Fibs.
What are the Drifter limits and Drifter Auto-fibs based on?
Drifter limits are based on the highest and lowest of the open/close values of the user defined Drifter Length (Default - 144).
These limits form the 0% and 100% Fib retracements, which help derive the 23.6%, 38.2%, 50%, 61.8% and 76.4% Auto-Fib plots of the Drifter.
Why is the Kumo of the Ichimoku included in the Drifter?
When the price enters the oversold/overbought zones of the Auto-Fibs towards the 100% retracement zones, the price could either come back to test the mean or follow the trend which becomes hard to predict without a secondary confirmator. Kumo cloud helps visualize the trend in relation to it and helps traders make an informed trade decision.
Users can use any of their favourite secondary confirmator like RSI, Stoch, MACD in addition to the cloud to further strengthen their decision.
How does the coloured bars help visualize the price action?
Drifter includes optional coloured bars which paint the price bars with the Bull/Bear strength based on the Drifter length.
The coloured bars help visualise the Bull/Bear power hold and also helps spot visible exhaustion which is a useful feature and acts as a good confirmator too.

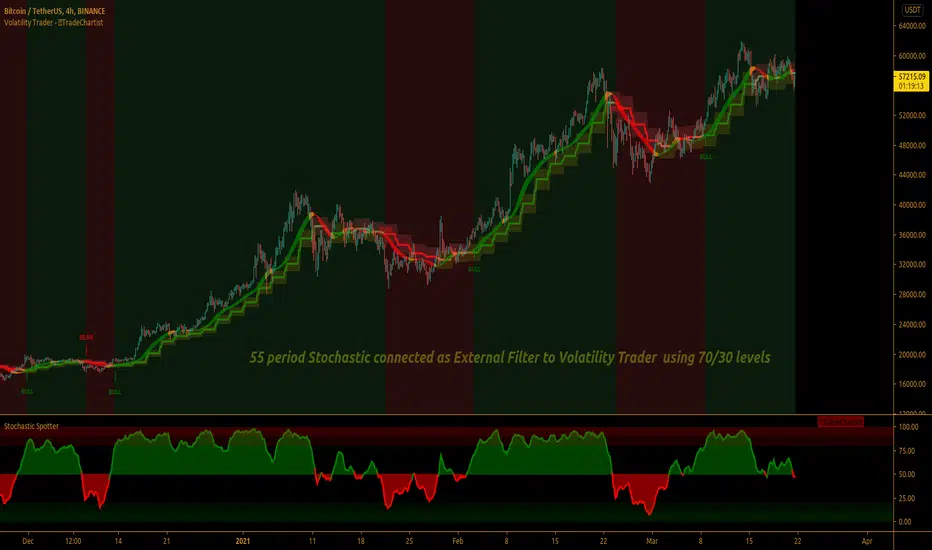
TradeChartist Volatility Trader ™TradeChartist Volatility Trader is a Price Volatility based Trend indicator that uses simple to visualize Volatility steps and a Volatility Ribbon to trade volatility breakouts and price action based on lookback length.
===================================================================================================================
Features of ™TradeChartist Volatility Trader
======================================
The Volatility steps consists of an Upper band, a Lower band and a Mean price line that are used for detecting the breakouts and also used in plotting the Volatility Ribbon based on the price action. The Mean Line is colour coded based on Bull/Bear Volatility and exhaustion based on Price action trend.
In addition to the system of Volatility Steps and Volatility Ribbon, ™TradeChartist Volatility Trader also plots Bull and Bear zones based on high probability volatility breakouts and divides the chart into Bull and Bear trade zones.
Use of External Filter is also possible by connecting an Oscillatory (like RSI, MACD, Stoch or any Oscillator) or a non-Oscillatory (Moving Average, Supertrend, any price scale based plots) Signal to confirm the Bull and Bear Trade zones. When the indicator detects the Volatility breakouts, it also checks if the connected external signal agrees with the trend before generating the Bull/Bear entries and plotting the trade zones.
Alerts can be created for Long and Short entries using Once per bar close .
===================================================================================================================
Note:
Higher the lookback length, higher the Risk/Reward from the trade zones.
This indicator does not repaint , but on the alert creation, a potential repaint warning would appear as the script uses security function. Users need not worry as this is normal on scripts that employs security functions. For trust and confidence using the indicator, users can do bar replay to check the plots/trade entries time stamps to make sure the plots and entries stay in the same place.
™TradeChartist Volatility Trader can be connected to ™TradeChartist Plug and Trade to generate Trade Entries, Targets etc by connecting Volatility Trader's Trend Identifier as Oscillatory Signal to Plug and Trade.
===================================================================================================================
Best Practice: Test with different settings first using Paper Trades before trading with real money
===================================================================================================================
This is not a free to use indicator. Get in touch with me (PM me directly if you would like trial access to test the indicator)
Premium Scripts - Trial access and Information
Trial access offered on all Premium scripts.
PM me directly to request trial access to the scripts or for more information.
===================================================================================================================
TradeChartist Donchian Channels Breakout Strategy™TradeChartist Donchian Channels Breakout Strategy is the strategy backtester version of ™TradeChartist Donchian Channels Breakout Filter .
===================================================================================================================
Features of ™TradeChartist Donchian Channels Breakout Strategy
========================================================
Option to plot Donchian Channels of user preferred length, based on the Source price in addition to High/Low Donchian Channels.
Generates trade entries based on user preferred Breakout Price. For example, if the user prefers HL2 as breakout price, irrespective of the Donchian Channels type, trade entries are generated only when hl2 price (average of high/low) breaks out of the upper or lower band.
Option to plot background colour based on Breakout trend. The bull zones are filled with green background, the Bear zones are filled with red background and the bar that broke out is filled with orange background.
Option to colour price bars using Donchian Channels price trend. The Donchian Channels basis line is plotted using the same colours as coloured bars as default.
Note: This script does not repaint. To use the script for trade entries, wait for the bar close without Backtester or Strategy entries (with Backtester) and use a second confirmator (includes fundamentals) based on asset type as some markets require users to have good pulse on the fundamentals as trading by Technicals/price action dynamic alone may not be safe.
Note: Trend Based Stochastic of the same DC Length can be used from ™TradeChartist Risk Meter for Trade Confirmations too.
===================================================================================================================
Best Practice: Test with different settings first using Paper Trades before trading with real money
===================================================================================================================
This is not a free to use strategy. Get in touch with me (PM me directly if you would like trial access to test the strategy)
Premium Scripts - Trial access and Information
Trial access offered on all Premium scripts.
PM me directly to request trial access to the scripts or for more information.
===================================================================================================================

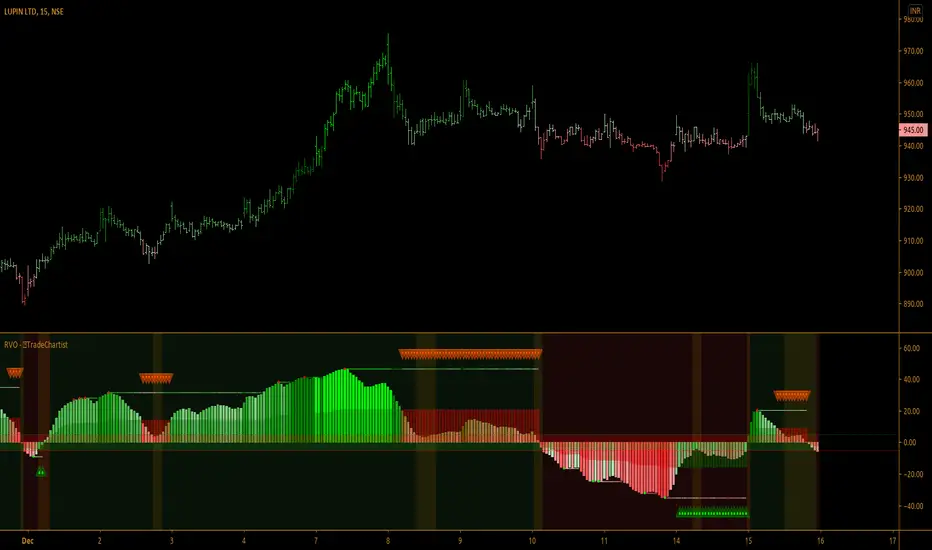
Relative Volatility OscillatorRelative Volatility Oscillator is a volatility based oscillator and works very well on Lower Time Frames on volatile assets. It uses one of five periods (34,55,89,144,233) to calculate relative volatility of the current bar with the volatility trend of one of the 5 periods from the settings, using percentile rank.
Features of Relative Volatility Oscillator
Choice of one of five periods for the Relative Volatility Oscillator plot.
SOS Triangles to indicate Bull/Bear Exhaustion.
Option to plot Volatility Zones. Oscillator Values between -5 and 5 will be plotted using exhaustion colours and can be used to monitor trades closely for trend reversals.
Choice of 3 colour themes including option to plot trend based coloured price bars.
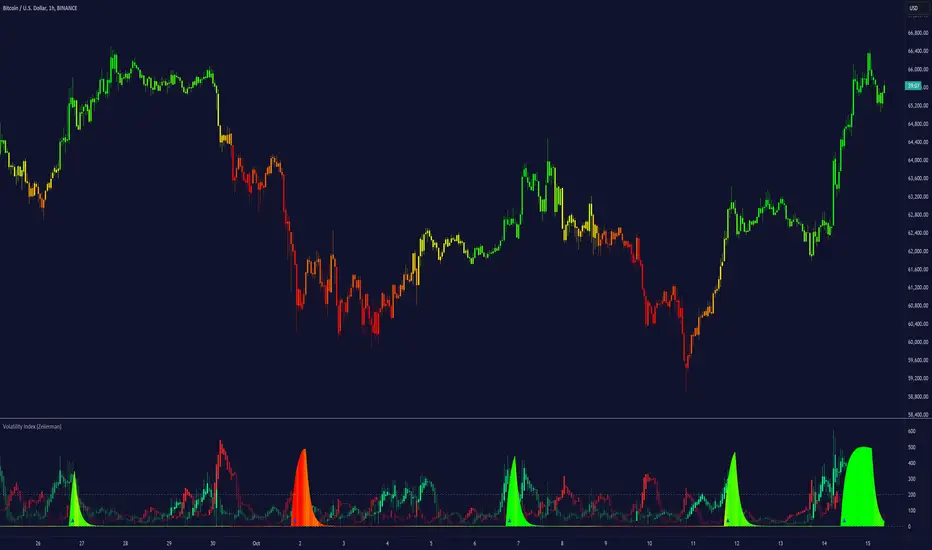
Volatility Index (Expo)Volatility Index (Expo)
DESCRIPTION
Volatility can be referred to many things, but a commonly accepted definition of volatility is that it’s a measure of the risk or uncertainty in the market. Higher volatility is equal to more risk in the market. A simple way of describing it is that when volatility is high, the value of the market can be spread out over a larger range of values. This means that the price of the market can change dramatically over a short time period in either direction. A lower volatility means that a market's value does not fluctuate dramatically, and tends to be steadier. However, how to calculate and to apply volatility has been widely debated and many different calculations have been used. Volatility Index is a must for a professional trader in today's volatile markets.
This Volatility Index is derived from research within Volatility.
HOW TO USE
1. Use the indicator to detect low- respectively high volatility.
2. Enter the market when the volatility is low, and exit the market when the volatility is high.
3. Use the indicator to identify when the volatility peaks. Can indicate that the market will shift or can be good areas to take profits.
Trend
When the market is in a positive trend, the volatility is low and stable. The opposite happens when the market is in a negative trend, the volatility is high and price moves boldly.
As a rule ,when volatility increases unusually(abnormal) in relation to previous periods something is happening in the market, then wait until the volatility peaks or when the indicator does not make any new highs (the indicator becomes flat), and in conjunction with that the trending price action doesn’t make any new lows or respectively highs. When this happens there is a high probability that the market will take a temporary turn.
Positive volatility refers to when the volatility index increases with green candlesticks this means that the buyers are more aggressive than sellers. (Can indicate a trend change)
Negative volatility refers to when the volatility index increases with red candlesticks this means that the sellers are more aggressive than buyers. (Can indicate a trend change)
INDICATOR IN ACTION
This indicator is best presented live, the graphs below gives a hint of how the Volatility Index works.
The indicator works on any market, security, currency, stock, etc. and on any timeframe.
BTCUSD
EURUSD
WALL STREET
I hope you find this indicator useful , and please comment or contact me if you like the script or have any questions/suggestions for future improvements. Thanks!
I will continue to work on this indicator, so please share your experience and feedback with me so that I can continuously improve it. Thanks to everyone that have contacted me regarding my scripts. Your feedback is valuable for future developments!
ACCESS THE INDICATOR
• Contact me on TradingView or use the links below
-----------------
Disclaimer
Copyright by Zeiierman.
The information contained in my scripts/indicators/ideas does not constitute financial advice or a solicitation to buy or sell any securities of any type. I will not accept liability for any loss or damage, including without limitation any loss of profit, which may arise directly or indirectly from use of or reliance on such information.
All investments involve risk, and the past performance of a security, industry, sector, market, financial product, trading strategy, or individual’s trading does not guarantee future results or returns. Investors are fully responsible for any investment decisions they make. Such decisions should be based solely on an evaluation of their financial circumstances, investment objectives, risk tolerance, and liquidity needs.
My scripts/indicators/ideas are only for educational purposes!
Volatility BalanceThis "Volatility Balance" indicator measures volatility from a different perspective.
It plots both an upside (green) and downside (red) volatility rating as well as a histogram depicting either the difference between the two or the two combined.
First, it calculates the ratio of the candle body (open to close) in relation to the entire candle range (high - low). This is the "candle body size ratio".
Secondly, it calculates the "dominance ratio" of the upside volatility (close - low) or downside volatility (high - close), in relation to the entire candle range (high - low)
Thirdly, it then uses the above values to derive the upside and downside power.
The upside and downside powers are calculated by multiplying the "candle body size ratio" to the upside or downside "dominance ratio" and then to the entire candle range.
It then divides this value by the close of the candle to normalize the overall value. After which it then multiplies this final value by 100, to get a percentage value between 0 - 100%.
It then averages the upside or downside "power value", using a volume-weighted moving average with the averaging period initially set to 7 periods, but this can be altered in the format settings.
The volatility difference or volatility size is displayed as a histogram style behind the green and red upside and downside power lines (depending on which value the user chooses), via an option in the format settings.
The volatility difference is the upside minus the downside and the volatility size is the upside and downside added together.
In case the user wishes to see EACH candle's power value before it has been averaged with volume, there is an option in the format settings to show each candle's upside or downside "power". If this method is chosen, the histogram will be hidden. There are also various check boxes, in case the user wishes to hide any of the plotted values.
The volatility size can determine how much energy has been behind the change in price over the period measured.
The volatility difference can determine how much upwards or downward energy is present within the period measured, in other words, the possible direction.
The use of the candle body ratio helps to determine the balance between upwards and downwards energy. If it is small, then it implies that there is more of a balance between buyers and sellers and therefore less volatility, as the price hasn't moved as much than if the body of the candle was larger. Smaller values indicate that price may not move as much and therefore lock up your funds longer until price starts to move again.
The use of a volume-weighted moving average helps to give higher volume periods more significance towards a possible price shift.
---------------------------------------------------------------------------------------------------------------------------
This indicator was originally inspired by the Profit Trailer Feeder add-on and it's volatility groupings.
If you don't already have the Profit Trailer Feeder add-on to the Profit Trailer software, and you have now decided to get it, please help me out and use my affiliate link below. It won't cost you any extra, but it helps keep the lights on, so I can create more of these indicators.
Kindest Regards
Created 2018 - by @Squiggles#8806
LTC Tip Jar: LX4bUBdjiRPsagUbZoAczSGgDC4YqTJL7w
Profit Trailer Feeder affiliate link: cryptoprofitbot.com
