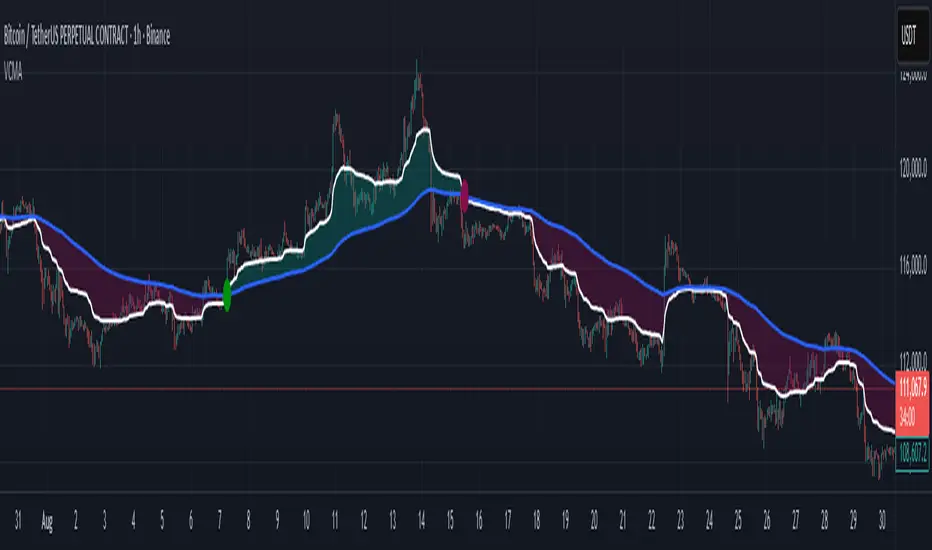
Volumetric Compressed MAVCMA (Volumetric Compressed Moving Average) uses the compressor and weighted standard deviation functions originally translated to pinescript by @gorx1 to plot moving averages in order to use for entry confirmation.
🔹 Concepts and Idea:
When we do music we always use different kinds of filters (low-pass, high pass, etc) for equalization and filtering itself. That stuff we use in finance as well. What we also always use in music are compressors, there dynamic processors that automatically adjust volume so it will be more consistent. Almost all the cool music you hear is compressed (both individual instruments (especially vocals) and the whole track afterwards), otherwise stuff will be too quite and too weak to flex on it, and also DJing it would be a nightmare.
🔹 Model:
I don't wanna explain it all in statistical / DSP way for once.
First of all, I think the population of volumes is log-normally distributed, so let's take logs of volumes, now we have a ~ normally distributed data. We take linearly weighted mean, add and subtract linearly weighted standard deviation from it, these would be our thresholds, the borders between different kinds of volumes explained before.
The upper threshold is for downward compression, that will not let volume pass it higher.
The lower threshold is for upward compression, all the volumes lower than this threshold will be brought up to the threshold's level.
Then we apply multipliers to the thresholds in order to adjust em and find the sweet spots. We do it the same way as in sound engineering when we don't aim for overcompression, we adjust the thresholds until they start to touch the signal and all good.
Afterwards, we delete all the number 1 and number 3 volume, leaving us exclusively with the clear main component, ready to be processed further.
We return the volumes to dem real scale.
For more info on Volume Compression it's highly advised to check @gorx1's initial script Volume Compressor
🔹 Settings:
MA Type: Moving average type to be used for comparison after calculating the compressed version of volume. This creates the second line after the compression line, so we can consider crossovers for confirmation entries.
Upward threshold: Upward threshold where the compression of volume is calculated. Increasing usually causes smoother lines.
Downward threshold: Downward threshold where the compression of volume is calculated. Decreasing usually causes smoother lines.
Compression Lookback: The Main lookback window of a volume that is used for compression. Increasing this would provide smoother lines but might cause delayed signals. Decreasing means more signals, but might cause whiplash and distorted signals.
Comparative Lookback: This is our lookback to be used with our ma type selection. There is no static better or worse lookback value for this indicator. It should be adjusted based on the pair.
🔹 Where to use:
This indicator should be used as another confirmation tool for your entry signals in your existing strategy/market following combination. Green dots (crossovers) mean bullish movement is expected, and red dots (crossbounders) mean bearish movement is expected. Automated crossover alerts are available. A reminder is that this kind of indicator should not be used on its own for trading, but rather should be used as a confirmation along with your trend detection and main entry indicators to provide additional confidence.
If you want to know under the hood, read the How it works section below.
🔹 How it works:
//This is our main compression calculation, which is used for the first line.
Compressed_out = compressor(volume, len_window, up_thresh, down_thresh)
//This is the secondary ratio calculation that we use for the second line.
Comp_ma = ma(ma_type, close * compressed_out, len_ml) / ma(ma_type, compressed_out, len_ml)
Vwma = ma(ma_type, close, len_window)
We calculate the ratio of the compressed volume and plot it against the base MA. Base MA's length is determined by the Compression Lookback input compared to the Comperative Lookback that is used for the compressed version. This provides us with another possible confirmation indicator that can be used to take advantage of volume ranges.
Volumeaverage
Moving Average Volume (20, 50)Shows two moving averages of volume, the 20 and 50 periods.
white bars in the background show volume, look for breaks of the target lines to confirm a breakout with volume
green shaded regions show how much higher the current volume is compared to historical volume
the greener the shade, the higher the multiple is (cap is 10x higher)
indicator is to be used with other breakout identifiers, or to help confirm the strength of a move out of an SAR level.
Volume with EMA and Coloring RulesSummary
This indicator plots the market’s volume as a histogram in a separate panel (not overlaid on the main price chart). An EMA (Exponential Moving Average) is then calculated based on the volume. The color of each volume bar switches dynamically:
• Blue when the bar’s volume is higher than the EMA
• White when the bar’s volume is lower than or equal to the EMA
This simple visual cue allows you to quickly see if the market’s current volume is above or below its average trend.
How to Use
1. Add to Chart
Apply the indicator to your TradingView chart, and it will open in a separate panel beneath the price.
2. Adjust EMA Length
Modify the “EMA Length” to control how quickly the average volume adapts to changes.
3. Interpretation
• Blue bars may indicate stronger-than-usual participation.
• White bars indicate volume is relatively lower compared to its recent average.
This indicator provides an at-a-glance way to see if trading activity is intensifying or easing, which can be paired with other technical or fundamental tools to help confirm market shifts or potential opportunities.
Multi TimeFrame VolumeThis script, "Multi TimeFrame Volume," is a TradingView Pine Script indicator that displays volume data across five user-selected timeframes in a table. Each volume is formatted in thousands (K) or millions (M) and color-coded based on the percentage change from the previous value (green for increase, red for decrease, gray if unchanged). The table's position and header colors can be customized. This helps traders quickly see volume trends at different intervals on a single chart
Hull OscillatorThis oscillator comprehends two different indicators:
- The first one is a MACD but calculated using the Hull Moving Average.
- The second one is to show the direction in which the Hull Moving Average is going.
Notice that in the first indicator, the histogram is colored as follows:
- If the volume pressure (difference between the volume-weighted moving average and the normal one) is positive both for the short term and the long term, it's green, if negative it's red, and if not is simply gray.
This tool can be used both for:
- Analyze the direction to have a bias to follow
- Analyze the divergences
- Obtain the signal to enter and exit the trade
- Analyze the market strength with volume to confirm the signal
Customizable Volume DetailsThis script allows you to gain insight into volume such as differentiating between buy and sell volume, 30 day average, 30 bar average, and more.
Welkin Advanced Volume Study (for VSA)This is a translation of Welkin's Advanced Volume Study Indicator originally written for ThinkOrSwim. This version is simpler than Welkin's and attempts to streamline that basic functionality for beginners to Volume Spread Analysis.
This can be used to replace the built-in volume bar with a more advanced version that is designed to facilitate Volume Spread Analysis. The basic idea is to clearly call out areas of high and low volume that help a trader determine where to "Smart Money" may be attempting to move the market. Volume is an incredible powerful tool for the retail trader; learn how to use it.
Grey bar are Below Average volume .
Blue bars are Average Volume , from a 20sma of volume .
Orange bars are 2-sigma (or 2 standard deviations) above average.
Magenta bars are 3-sigma (3 standard deviations) above average.
The plotted lines represent these levels.
Yellow bars have relatively higher volume compared to the previous bar.
The study can also apply these same colors to the price candles themselves, as well as showing buying and selling pressure of the volume bars.
Volume Average % Cross - ChartVolume Average Percentage Cross Indicator - Chart
This version is specialized for notifications on your chart. If you wish to see notifications on your volume bars please choose "Volume Average Percentage Cross Indicator - Default".
What is the Volume Average % Cross - Chart Indicator you might ask yourself - what is it for?
I will tell you!
Use Case:
In my Indicator you have an Input to set the period for the volume average period.
Once the volume average period is calculated it is now necessary to choose the percentage value.
What is the percentage value?
The percentage value multiplies the past volume bar with a positive percentage value and a negative percentage value. I give this calculation the name "VolPercentage".
If the volume average is below the negative VolPercentage Value it means that the last volume bar is stronger than the volume average period by the percentage you set the percentage value input at.
If the volume average is above the positive VolPercentage Value it means that the last volume bar is weaker than the volume average period by the percentage you set the percentage value input at.
That means that if for example the percentage value would be 20 it would require the volume average to be 20% above the past volume bar.
That means that if for example the percentage value would be 20 it would require the volume average to be 20% lower than the past volume bar.
Once I uploaded my 100 Indicators I will accurately describe each indicator with videos, this will be huge!
Interpretation:
Volume is the amount of market participants who bought in a candlestick bar a set amount of shares at varying prices from within the bar itself.
If volume decreases it means that there has been fewer market participants and if it increases it means that there is an increase of market participants.
If this is used with candlestick patterns it helps tremendously to identify strong or weak doji candlesticks.
Volume Average Cross - VAC ChartVolume Average Cross Chart Indicator
This indicator plots signals from two different volume averages when they cross on the chart.
It does not show the default volume bars, to see them please go to my VAC Default Indicator.
This is VAC Chart. If you want to see the crosses on your volume bars and not on the chart please go to my VAC Default Indicator.
Rules:
Fast Volume Period always has to be lower than the Slow Volume Period to trigger correct signals.
Inputs:
-> Fast Volume Average Period
-> Slow Volume Average Period
-> Option to enable/disable the cross-signals
Volume Average Cross - VAC DefaultVolume Average Cross Default Indicator
This indicator plots signals from two different visual volume averages when they cross.
In does in addition to that show the default volume bars.
This is VAC Default. If you need to see the crosses on your chart and not on the volume bars please go to my VAC Chart Indicator.
Rules:
Fast Volume Period always has to be lower than the Slow Volume Period to trigger correct signals.
Inputs:
-> Fast Volume Average Period
-> Slow Volume Average Period
-> Option to enable/disable the cross-signals and to show/hide both volume averages.