Volume Weighted Average Price Dynamic Slope [sgbpulse]VWAP Dynamic Slope: A Comprehensive Indicator for Trend Identification and Smart Trading
Introducing VWAP Dynamic Slope, an innovative TradingView indicator that harnesses the power of Volume Weighted Average Price (VWAP) and enhances it with immediate visual feedback. The indicator colors the VWAP line based on its slope, allowing you to quickly and easily identify the direction and strength of the current trend for the asset, providing advanced tools for in-depth analysis.
What is VWAP and Why is it so Important?
VWAP (Volume Weighted Average Price) is an indicator that represents the average price at which an asset has traded, weighted by the volume traded at each price level. Unlike a simple moving average, VWAP gives greater weight to trades executed with high volume, making it a reliable measure of the asset's "true" or "fair" price within a given period. Many institutional traders use VWAP as a central reference point for evaluating the effectiveness of entries and exits. An asset trading above its VWAP is considered to have bullish momentum, and below it – bearish momentum.
How it Works: Dynamic VWAP Slope Analysis
VWAP Dynamic Slope analyzes the inclination of the VWAP line and displays it using an intuitive color scheme:
Positive Slope (Uptrend): When the VWAP points upwards, signaling positive momentum, the default color will be green.
Negative Slope (Downtrend): When the VWAP points downwards, signaling negative momentum, the default color will be orange.
Trend Change (CHG): When a change in the VWAP's trend direction occurs, a "CHG" label will be displayed. The label's color will be green if the change is to an uptrend, and orange if the change is to a downtrend.
Identifying Steep Slopes for Increased Momentum:
The indicator's uniqueness lies in its ability to identify "steep" slopes – rapid and particularly strong changes in the VWAP's direction. This indicates exceptionally strong momentum:
Steep Positive Slope: The VWAP color will change to dark green, indicating significant buying pressure.
Steep Negative Slope: The VWAP color will change to dark red, indicating significant selling pressure.
Dynamic Momentum Strength Label: In situations of steep slope (positive or negative), a dynamic label will be displayed with the change value of the VWAP at that point. This label allows you to monitor momentum strength, intensification, or weakening in real-time.
Advanced Analytical Tools for Complete Control
VWAP Dynamic Slope provides you with unprecedented flexibility through a variety of customizable tools:
Multiple VWAP Anchors and Visual Marking:
Common Time Anchors: Choose whether the VWAP resets at the beginning of each Session (daily), Week, Month, Quarter, Year, Decade, or Century.
Advanced Intraday Anchors: Within the Session, you can choose to calculate VWAP specifically for Pre-Market, Regular Hours, and Post-Market hours. This option is particularly crucial for intraday traders.
Important Event Anchors: The indicator allows for VWAP resets at significant milestones such as Earnings, Dividends, and Splits, for analyzing the market's immediate reaction.
Visual Anchor Marking: To enhance clarity and orientation, a Label ⚓ can be displayed at each selected anchor point, helping to immediately identify the start point of the VWAP calculation in the chosen context.
Customizable Bands (Up to Three on Each Side):
Add up to three Bands above and below the VWAP to identify areas of deviation and excursion from the average price. You have two calculation options:
Standard Deviation: Based on volatility and statistical distance from the VWAP.
Percentage: Defines fixed percentage-based bands from the VWAP.
Key Pre-Market Levels (Pre-Market High/Low):
Display the Pre-Market High and Low levels as separate lines on the chart. These lines often serve as important psychological support and resistance zones, allowing you to see how the VWAP behaves near them.
Full Customization and Precise Control:
VWAP Source Selection: Determine which price data type will be used for the VWAP calculation. The default is HLC3 (average of High, Low, and Close), but any other relevant data source available in TradingView can be selected.
Offset: Set an offset for the VWAP line, allowing you to shift it left or right on the time axis by a chosen number of bars.
Customizable Colors: Choose your preferred colors for each slope state, Pre-Market High/Low lines, and Bands.
Setting the "Steepness" Threshold (Per-mille Price Change Per Minute ‱/min with Auto-Adjustment): Determine the sensitivity for identifying a steep slope by setting the required change threshold in VWAP in terms of per-mille price change per minute (‱/min). The indicator performs smart adjustment for any timeframe you select on the chart (e.g., 30 seconds, 1 minute, 5 minutes, 10 minutes, etc.), ensuring that the "steepness" setting maintains consistency and relevance.
Examples for Setting the Steepness Threshold:
Suppose you set the steepness threshold to 0.3‱/min (per-mille price change per minute).
On a 30-second chart: The indicator will check if the VWAP changed by 0.15 ‱/min (half of the per-minute threshold) within a single bar. If so, the slope will be considered steep. Explanation: Since 30 seconds is half a minute, the indicator looks for a change that is half of the threshold set for a full minute.
On a 1-minute chart: The indicator will check if the VWAP changed by 0.3 ‱/min (the full per-minute threshold) within a single bar. If so, the slope will be considered steep. Explanation: Here, the bar represents a full minute, so we check the full threshold.
On a 5-minute chart: The indicator will check if the VWAP changed by 1.5 ‱/min (5 times the per-minute threshold) within a single bar. If so, the slope will be considered steep. Explanation: A 5-minute bar contains 5 minutes, so the cumulative change in VWAP needs to be 5 times greater to be considered "steep" on the same scale.
In summary, this setting allows you to precisely and uniformly control the sensitivity of steep slope detection across all timeframes, providing immense flexibility in analyzing the asset's momentum.
Advantages of Using Per-mille Price Change Per Minute (‱/min)
Using per-mille price change per minute (‱/min) offers several key advantages for your indicator:
Normalized and Objective Measurement: It provides a uniform scale for the VWAP's rate of change, regardless of the asset's price or nominal value. A 0.1 per-mille change per minute always carries the same relative significance.
Comparison Across Different Asset Prices: Using per-mille allows for direct comparison of VWAP movement strength between assets trading at very different prices (e.g., a $100 asset versus a $1 asset), enabling an understanding of true momentum without bias from the nominal price.
Smart Timeframe Agnostic Adjustment: This is a critical capability. The indicator automatically adjusts the per-mille per minute threshold you set to any chart timeframe (30 seconds, 1 minute, 5 minutes, etc.), maintaining consistency in "steepness" detection without manual recalibration.
Precise Momentum Identification: This measurement precisely identifies when the VWAP's rate of change becomes significant, and when momentum strengthens or weakens, contributing to more informed trading decisions.
In short, per-mille change per minute (‱/min) provides accuracy, consistency, and flexibility in identifying VWAP momentum changes, with smart adaptation across all timeframes.
Who is this Indicator For?
VWAP Dynamic Slope is a powerful tool for:
Intraday Traders: For quick identification of intraday trend directions and momentum across any timeframe, with specific consideration for Pre-Market, Regular Hours, or Post-Market VWAP, and incorporating key pre-market levels.
Swing Traders and Long-Term Investors: For analyzing longer-term trends based on periodic and event-driven VWAP anchors.
Beginner Traders: As an excellent visual aid for understanding the relationship between price, volume, and trend direction, and how different anchor points, pre-market levels, and data sources influence price behavior.
Experienced Traders: For integration with existing strategies, gaining additional confirmation for trend strength identification, and highly precise and flexible parameter calibration.
VWAP Dynamic Slope provides a rich, multi-dimensional layer of information about the VWAP, helping you make more informed trading decisions in real-time, within the context of your chosen asset.
Vwapbands

8EMA/VWAP14 Oscillator w/ Trend Exhaustion Bands8EMA/VWAP14 Oscillator w/ Trend Exhaustion Bands + Performance Screener
Introducing the 8EMA/VWAP14 Oscillator with Trend Exhaustion Bands + Screener Suite - a comprehensive trading system that combines trend identification, momentum analysis, and real-time performance tracking all in one indicator. This system features a four-tier signal approach: early momentum warning dots before anything happens, confirmed entry/exit triangles when it's time to act, a dynamic trend ribbon on your price chart, and adaptive exhaustion bands that adjust to each asset's unique characteristics. The built-in performance tracker shows exactly how well your signals are working - success rates, average time to hit targets, and more - providing clear insight for confident trading decisions. Optimized for daily and weekly timeframes, this suite is suitable for both manual traders and automated strategies.
Aim of the Indicator
The 8EMA/VWAP14 Oscillator with Trend Exhaustion Bands is an advanced momentum oscillator system that combines trend identification, momentum analysis, and forward-looking performance validation. This comprehensive tool measures the percentage difference between an 8-period Exponential Moving Average and a 14-period Volume Weighted Average Price while providing multiple layers of signal confirmation through visual trend ribbons, momentum shift alerts, and adaptive exhaustion detection.
How to Interpret the Indicator
Visual Trend System: The indicator displays a dynamic ribbon between the 8EMA and 14VWAP lines on the price chart, automatically colored green when EMA8 is above VWAP14 (bullish trend) and red when below (bearish trend), providing instant trend context.
Four-Tier Signal System:
Tiny Green Dots (Below Bars): Early bullish momentum shifts when the oscillator crosses above its adaptive baseline
Green Triangles (Below Bars): Confirmed buy signals when EMA8 crosses above VWAP14
Tiny Red Dots (Above Bars): Early bearish momentum shifts when the oscillator crosses below its adaptive baseline
Red Triangles (Above Bars): Confirmed sell signals when EMA8 crosses below VWAP14
Oscillator Analysis: The separate pane displays the momentum oscillator with a dynamic zero line (thin blue) representing the recent average EMA8/VWAP14 relationship. Trend exhaustion is detected through adaptive bands - orange for potential upside exhaustion and purple for potential downside exhaustion, calculated dynamically based on the oscillator's historical range relative to its adaptive baseline.
Key Settings and Flexibility
Signal Source Customization: Choose from Open, High, Low, Close, OHLC Average, or HL Average to optimize signal sensitivity for different market conditions and trading styles.
Multi-Timeframe Capability: Enable higher timeframe analysis to use signals from longer periods while trading on shorter timeframes, significantly reducing noise and improving signal quality for more reliable entries.
Dynamic Baseline Controls: Adjust the adaptive zero line calculation period (5-100 bars) - shorter periods provide more responsive momentum detection, while longer periods offer smoother trend context and reduced false signals.
Entry Timing Options: "Bar Opening Only" mode ensures signals trigger only at confirmed bar close using realistic entry prices, eliminating mid-bar noise and providing accurate backtesting results for automated trading systems.
Adaptive Exhaustion Detection: Customize lookback periods and threshold multipliers to fine-tune exhaustion sensitivity for different volatility environments and asset classes.
Comprehensive Performance Tracking: Set custom profit targets (1-50%) and maximum holding periods to analyze forward-looking signal effectiveness with real-time success rate monitoring.
Advanced Features and Benefits
Forward-Looking Performance Analytics: Unlike traditional backtesting, this system tracks how often buy signals reach specified profit targets and measures average time to target, providing immediate validation of signal quality across different assets and timeframes.
Adaptive Baseline Technology: The dynamic zero line automatically adjusts to each asset's unique EMA8/VWAP14 relationship patterns, making momentum signals contextually relevant rather than using static thresholds that may not suit all market conditions.
Professional Entry/Exit Tracking: When "Bar Opening Only" is enabled, all performance calculations use actual tradeable prices (next bar's open) rather than theoretical mid-bar prices, ensuring realistic performance expectations.
Visual Performance Dashboard: Real-time table displaying success rate, average bars to target, fastest/slowest target achievement, and active position tracking with complete transparency about timeframe, signal source, and methodology being used.
Integrated Alert System: Comprehensive alerts for both early momentum shifts and confirmed crossover signals, enabling automated trading integration and timely manual intervention.
Best Practices for Timing Entries and Exits
Entry Timing Strategy:
Watch for Early Warning: Monitor tiny green dots as momentum builds - this is your preparation phase
Confirm with Ribbon: Ensure the ribbon color aligns with your intended direction (green for long positions)
Enter on Triangle Signal: Execute entries when confirmed buy triangles appear, using realistic bar opening prices
Avoid Exhaustion Zones: Be cautious entering when the oscillator is near orange (upper) exhaustion bands
Exit Timing Strategy:
Monitor Momentum Shifts: Red dots above bars provide early warning of potential reversals before actual sell signals
Use Exhaustion Bands: Consider partial profit-taking when oscillator reaches exhaustion zones (orange/purple bands)
Confirm with Sell Signals: Exit positions when red triangles appear, especially if preceded by bearish momentum dots
Time-Based Exits: Utilize the "Max Bars to Target" setting to avoid holding losing positions indefinitely
Risk Management Integration:
Position Sizing: Use success rate metrics to adjust position sizes - higher success rates may warrant larger positions
Multi-Timeframe Confluence: Combine daily signals with weekly context for highest probability setups
Avoid False Signals: Wait for momentum dots before triangles for stronger signal confirmation, reducing whipsaw trades
Optimal Market Conditions:
Trending Markets: Ribbon provides clear directional bias - trade in direction of ribbon color
Range-Bound Markets: Focus on exhaustion bands for reversal opportunities near dynamic support/resistance levels
Volatile Conditions: Use higher timeframe settings to filter noise and focus on more significant moves
Optimal Timeframe Usage
This indicator achieves exceptional performance on Daily timeframes and delivers superior results on Weekly timeframes. Weekly analysis is particularly powerful for position trading and swing strategies, as the adaptive exhaustion bands and momentum shifts have greater statistical significance over extended periods. The ribbon visualization becomes especially valuable on longer timeframes, clearly delineating major trend phases while filtering out intraday noise that can plague shorter-term analysis.
Alternative Applications
Multi-Timeframe Confluence System: Use weekly signals for trend direction while executing entries on daily timeframes, combining the indicator's momentum dots and triangles across different time horizons for high-probability setups.
Automated Trading Integration: The indicator's comprehensive alert system and realistic entry tracking make it ideal for automated trading platforms, with clear signal hierarchy and performance validation built into the system.
Risk-Adjusted Position Sizing: Utilize real-time success rate data and average holding period metrics to dynamically adjust position sizes based on current market effectiveness of the strategy.
Market Regime Detection: The ribbon color changes and exhaustion band interactions help identify when markets transition between trending and ranging conditions, allowing strategy adaptation accordingly.
Performance Validation Tool: Test signal effectiveness across different assets, timeframes, and market conditions before committing capital, using the forward-looking analytics to validate strategy assumptions.
Conclusion
The 8EMA/VWAP14 Oscillator with Trend Exhaustion Bands represents a comprehensive trading system that bridges the gap between manual analysis and automated execution. Its multi-layered approach provides both leading momentum indicators and lagging confirmation signals, while the adaptive baseline technology ensures relevance across different market conditions and asset classes. The integration of visual trend ribbons, performance analytics, and flexible timing controls makes it suitable for both discretionary traders seeking enhanced market insight and systematic traders requiring robust signal validation for automated strategies.

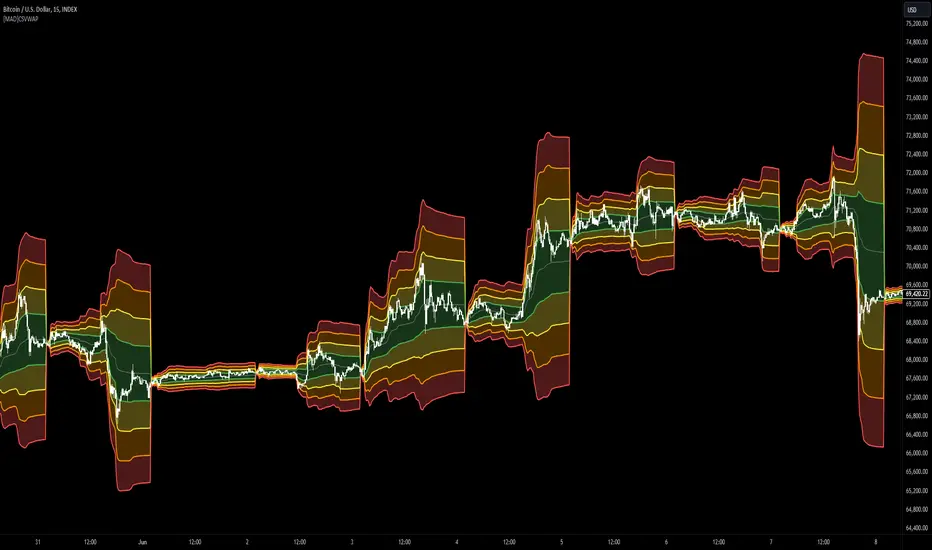
ZenAlgo - RangerThe core of the indicator is the daily range, anchored around the 1-minute timeframe VWAP (volume-weighted average price), with ±2 standard deviations defining the upper and lower bounds. This range dynamically forms throughout the day and then gets “locked” at 23:59 each day to establish historical reference values.
The indicator calculates this locked VWAP and standard deviation per day, which serves two primary purposes:
Drawing today's real-time evolving range , updated each minute.
Plotting previous daily ranges , based on historical locked VWAPs and standard deviations, providing visual reference boxes on the chart.
This design enables the trader to identify mean-reversion zones and persistent directional biases based on volume-weighted price consensus.
Multiple Standard Deviation Layers
Beyond the ±2.0 deviation bounds, optional lines are available at half-step increments (e.g., ±0.5, ±1.5, ..., ±4.5) and full-step levels beyond ±2.0 (±3.0, ±4.0, ±5.0). These provide a customizable grid to visualize price extremes, tail behavior, or potential breakout zones relative to volume-adjusted price equilibrium.
Users can enable only the levels they need, offering flexibility depending on their strategy (e.g., scalping versus swing trading).
Historical Range Retention
The script stores up to 70 previous daily VWAP + standard deviation values (adjustable). For each, it draws a full range box and standard deviation lines in the past. This historical context helps in understanding how current price interacts with prior days’ balance zones.
These boxes are always drawn from 00:00 to 23:59 UTC , ensuring consistent alignment across instruments and avoiding session-based discrepancies.
Monday Range Reference (Drawn on Tuesdays)
On Tuesdays, the indicator plots the previous Monday's VWAP-based range across the rest of the week. This serves as a persistent contextual anchor for traders watching weekly unfolding behavior. The range is defined identically (VWAP ±2σ) and drawn from Monday 00:00 through the following Monday.
This method assumes Monday often sets the tone or structure for the week, and tracking this level through time may highlight support/resistance confluence or range expansion scenarios.
Each Monday range is extended over 7 days and includes dashed lines at the 25%, 50%, and 75% marks within the range. These midrange markers help traders assess microstructure behaviors (e.g., reversion to median, failure to hold midpoint, etc.).
Daily Volume Delta via 4H Candles
The indicator also integrates daily buy/sell volume deltas , derived from 4-hour candles of the regular session (non-Heikin Ashi). The logic categorizes volume as:
Buy volume when candle closes above the previous close.
Sell volume when it closes below.
Even split when the candle closes flat.
These volumes accumulate each day to derive net delta (buy - sell). This delta is recorded for each day and can optionally be displayed. A similar process tracks the delta for each Monday range on an ongoing basis.
This information quantifies the market’s aggressive buying vs. selling , correlating with price positions inside or outside the VWAP ranges. A strong delta in one direction may justify a price sustaining above/below VWAP, or diverging from the previous range.
Interpretation and Best Usage Practices
VWAP±2σ Range : Considered a high-probability area for consolidation or reversal. Mean-reverting strategies can benefit from signals within this area.
VWAP±3.0 and beyond : Extreme deviations may signal exhaustion or breakout potential, but are less frequent.
Previous Range Overlap : Overlap of today’s price with past VWAP zones may indicate support/resistance zones.
Monday Range on Tuesday : Persistent levels where the week may repeatedly pivot. Best used on instruments that exhibit weekly cyclical behavior (e.g., indices, forex).
Delta Behavior : Sharp positive or negative delta combined with price outside VWAP bands may suggest initiative participation and potential trend continuation.
Added Value Over Free Alternatives
While many free VWAP tools exist, this script differs in several specific and factual ways:
Anchored 1-minute VWAP lock at a consistent daily timestamp (23:59 UTC), enabling historical analysis.
Historical storage of previous VWAP ranges , with adjustable memory depth and visual continuity.
Flexible standard deviation plotting , down to 0.5 increments, tailored to the user's strategy needs.
Dedicated Monday range analysis , not common in freely available scripts.
Volume delta tracking per day and per Monday range , offering a directional volume view unavailable in standard VWAP implementations.
Persistent and visual interpretation framework using extended boxes and dashed lines for easier contextual navigation.
Each of these additions increases the script’s utility for methodical traders relying on volume-weighted statistics, without requiring additional configuration or external calculations.
Limitations and Disclaimers
VWAP based on 1-minute resolution : The indicator uses minute-level data to calculate daily VWAP and standard deviation. This offers high fidelity on liquid instruments but may produce noisy or unreliable levels on illiquid assets or during periods of low volume. For example, microcap stocks or thinly traded altcoins might not yield stable VWAP centers.
Inferred buy/sell volume : Volume delta is estimated using price movement from one candle to the next (close-to-close logic), rather than actual trade-level aggressor data (which is not accessible via TradingView). This approximation may misclassify volume in choppy or low-volatility environments, especially in assets where price changes do not correlate well with order flow (e.g., crypto during low-volume weekends).
Non-continuous markets and price gaps : For assets that do not trade continuously (e.g., stocks, futures), the VWAP calculation starts fresh every day at 00:00 UTC, regardless of the instrument’s official session start. As a result:
Pre-market/post-market trades may be included in VWAP when analyzing equities, even though they are often excluded in professional VWAP tools.
Opening gaps in equities and futures may distort early VWAP values due to lack of volume context, especially if the previous day's session was already closed when new data begins accumulating.
Weekend gaps in crypto, although less frequent due to 24/7 trading, can still influence delta accumulation if abrupt moves happen during low liquidity periods.
Daily session alignment : The VWAP anchoring and box drawing uses 00:00 UTC to 23:59 UTC windows. For instruments with different official session timings (e.g., US equities, CME futures), this may cause mismatches between expected session VWAPs and the ones shown in this script.
Conclusion
The ZenAlgo – Ranger script offers a systematic visualization of volume-adjusted price behavior, combining statistical VWAP ranges with volume delta overlays. By integrating daily and weekly reference zones, this tool supports structured decision-making in various market environments, particularly for traders prioritizing mean reversion, range expansion, or trend confirmation.

Head Hunter HHHead Hunter HH - Advanced Market Structure & Volume Analysis Indicator
This indicator combines volume analysis, price action, and VWAP to identify high-probability trading opportunities across multiple timeframes.
Key Features:
• Smart Volume Analysis: Detects institutional volume patterns using dynamic thresholds
• VWAP-Based Market Structure: Multiple standard deviation bands for precision entry/exit
• Daily Level Integration: Previous day's high, low, close, and current day's open
• Advanced Signal Classification: Regular, Super Strong, and Scalp signals
Signal Types:
1. Regular Signals (White/Purple Triangles)
• Volume-confirmed reversals
• Institutional price levels
• Technical momentum alignment
2. Super Strong Signals (Green/Red Diamonds)
• High-volume breakouts
• Strong momentum confirmation
• Multiple timeframe alignment
3. Scalp Signals (Green/Magenta Circles)
• Quick reversal opportunities
• VWAP deviation analysis
• Volume surge confirmation
Visual Components:
• VWAP with Standard Deviation Bands
• 50 MA (optional)
• Daily Reference Levels
• Color-coded signals based on strength
• Bar color changes on confirmed signals
Best Practices:
• Most effective on higher timeframes (1H+)
• Use with major pairs/instruments
• Combine signals with support/resistance
• Monitor volume confirmation
• Wait for candle close confirmation
This indicator helps identify institutional order flow and high-probability reversal zones by analyzing volume patterns, price action, and market structure, providing traders with multiple confirmation layers before entry.
Note: Results may vary based on market conditions and timeframe selection. Always use proper risk management.

VWAP 2.0 with desv + Initial Balance by RiotWolftrading🌟 Overview
This powerful tool is designed for traders who want to harness the power of the Volume Weighted Average Price (VWAP) alongside session-based ranges to make informed trading decisions. Whether you're a day trader or a swing trader, this indicator provides a clean and effective way to identify support, resistance, and market trends—all in one place! 💡
✨ Key Features
Auto-Anchored VWAP 📊
Automatically calculates the VWAP based on a user-defined anchor period (e.g., Daily, Weekly, Monthly).
Resets at the start of each period (e.g., daily for a Daily anchor).
Displays a customizable VWAP line with standard deviation bands to highlight key price levels.
Standard Deviation Bands 📏
Plots up to three sets of standard deviation bands above and below the VWAP (multipliers: 1.0, 2.0, 3.0).
Includes volume percentage labels to show where trading volume is concentrated. 📉
Session High/Low Range 🕒
Identifies the high and low prices within a customizable session (default: 12:00 to 15:31).
Draws horizontal lines at the session high and low, with dotted deviation lines for additional reference points.
Perfect for spotting key levels during your trading session! 🔑
Time-Based Range Box ⏰
Highlights a specific time window (default: 15:40 to 15:50) with a colored box showing the high and low prices.
Ideal for tracking price action during high-impact events like news releases or market opens. 📅
Alerts 🚨
Set up alerts for when the price crosses above or below the VWAP—never miss a potential trading opportunity!
⚙️ Settings
Customize the indicator to fit your trading style with these easy-to-use settings:
VWAP Settings
Timezone 🌍: Select your timezone (default: GMT+2) to align calculations with your local time.
VWAP Source 📈: Choose the price source for VWAP (default: hlc3 - average of high, low, close).
Std Deviation Multipliers 📐: Adjust the multipliers for the bands (default: 1.0, 2.0, 3.0).
Line Width ✏️: Set the thickness of the VWAP and band lines (default: 1).
Session Time ⏳: Define the session window for VWAP calculations (default: 08:00-18:00, all days).
Show Upper/Lower Bands 👀: Toggle visibility for each set of bands (default: Band 1 visible, Bands 2 & 3 hidden).
Range Settings
Range Start/End Time 🕙: Set the time window for the range box (default: 15:40 to 15:50).
Box Color 🎨: Customize the border color (default: blue).
Box Background Color 🖌️: Adjust the background color (default: light aqua, 90% transparency).
I created this indicator to provide a streamlined, clutter-free tool for traders who rely on VWAP and session-based analysis. It focuses on the essentials—VWAP, standard deviation bands, session high/low, and range box—without unnecessary overlays. I hope it helps you in your trading journey! If you have feedback or suggestions, feel free to share—I’d love to hear from you! 😊

Multi-Timeframe VWAP Master ProThe Multi-Timeframe VWAP Suite is a comprehensive and highly customizable indicator designed for traders who rely on Volume-Weighted Average Price (VWAP) across multiple timeframes and periods. This tool provides a complete suite of VWAP calculations, including daily, weekly, monthly, quarterly, yearly, and custom VWAPs, allowing traders to analyze price action and volume trends with precision. Whether you're a day trader, swing trader, or long-term investor, this indicator offers unparalleled flexibility and depth for your trading strategy.
Multi-Timeframe VWAPs:
Daily, Weekly, Monthly, Quarterly, and Yearly VWAPs: Track VWAP across various timeframes to identify key support and resistance levels.
Customizable Timeframes: Use the SMA timeframe input to adjust the period for moving averages and other calculations.
Previous Period VWAPs:
Previous Daily, Weekly, Monthly, and Quarterly VWAPs: Analyze historical VWAP levels to understand past price behavior and identify potential reversal zones.
Previous Year Quarterly VWAPs: Compare current price action to VWAP levels from specific quarters of the previous year.
Custom VWAPs:
Custom Start Date and Timeframe: Define your own VWAP periods by specifying a start date and timeframe, allowing for tailored analysis.
Dynamic Custom VWAP Calculation: Automatically calculates VWAP based on your custom inputs, ensuring flexibility for unique trading strategies.
Seasonal and Yearly VWAPs:
April, July, and October VWAPs: Analyze seasonal trends by tracking VWAP levels for specific months.
Yearly VWAP: Get a broader perspective on long-term price trends with the yearly VWAP.
SMA Integration:
SMA Overlay: Combine VWAP analysis with a Simple Moving Average (SMA) for additional confirmation of trends and reversals.
Customizable SMA Length and Timeframe: Adjust the SMA settings to match your trading style and preferences.
User-Friendly Customization:
Toggle Visibility and Labels: Easily enable or disable the display of specific VWAPs and their labels to keep your chart clean and focused.
Color Customization: Each VWAP line and label is color-coded for easy identification and can be customized to suit your preferences.
Dynamic Labeling:
Automatic Labels: Labels are dynamically placed on the last bar, providing clear and concise information about each VWAP level.
Customizable Label Text: Labels include detailed information, such as the timeframe or custom period, for quick reference.
Flexible Timeframe Detection:
Automatic Timeframe Detection: The indicator automatically detects new days, weeks, months, and quarters, ensuring accurate VWAP calculations.
Support for Intraday and Higher Timeframes: Works seamlessly on all chart timeframes, from 1-minute to monthly charts.
Previous Year Quarterly VWAPs:
Q1, Q2, Q3, Q4 VWAPs: Compare current price action to VWAP levels from specific quarters of the previous year.
User-Selectable Year: Choose the year for which you want to calculate previous quarterly VWAPs.
Persistent Monthly VWAPs:
Option to Persist Monthly VWAPs Year-Round: Keep monthly VWAP levels visible even after the month ends for ongoing analysis.
Comprehensive Analysis: Combines multiple VWAP timeframes and periods into a single tool, eliminating the need for multiple indicators.
Customizable and Flexible: Tailor the indicator to your specific trading strategy with customizable timeframes, periods, and settings.
Enhanced Decision-Making: Gain deeper insights into price action and volume trends across different timeframes, helping you make more informed trading decisions.
Clean and Organized Charts: Toggle visibility and labels to keep your chart clutter-free while still accessing all the information you need.
Ideal For:
Day Traders: Use daily and intraday VWAPs to identify intraday support and resistance levels.
Swing Traders: Analyze weekly and monthly VWAPs to spot medium-term trends and reversals.
Long-Term Investors: Leverage quarterly and yearly VWAPs to understand long-term price behavior and key levels.
Seasonal Traders: Track April, July, and October VWAPs to capitalize on seasonal trends.
The Multi-Timeframe VWAP Suite is a powerful and versatile tool for traders of all styles and timeframes. With its comprehensive suite of VWAP calculations, customizable settings, and user-friendly design, it provides everything you need to analyze price action and volume trends with precision and confidence. Whether you're looking to fine-tune your intraday strategy or gain a broader perspective on long-term trends, this indicator has you covered.

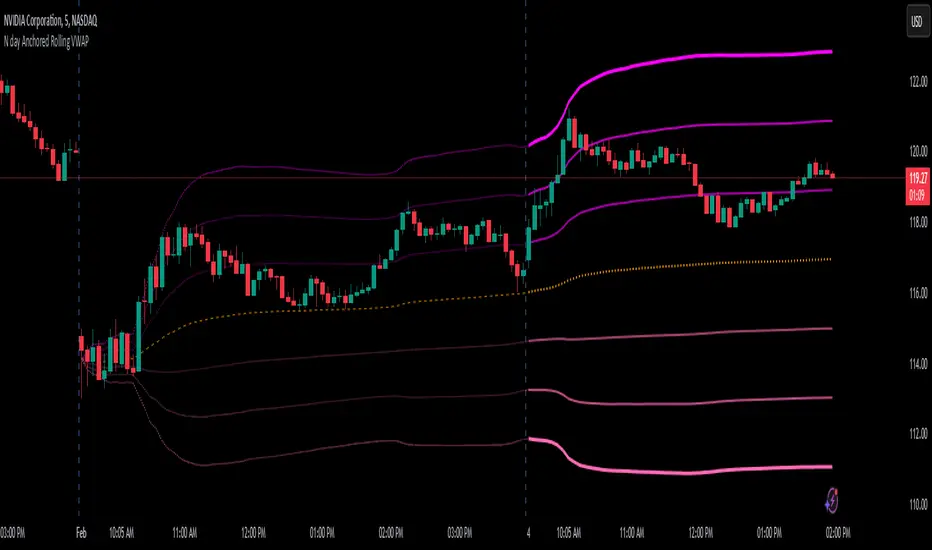
N day Anchored Rolling VWAP
⭐ Overview
The N-Day Anchored Rolling VWAP is designed to automate and simplify the use of anchored VWAP for traders, making it an invaluable tool for those who rely on VWAP for trend filtering, support/resistance identification, or strategy implementation. This indicator removes the tedious and repetitive manual process of setting the anchored VWAP for multiple charts or stocks in a watchlist. Once added, the indicator dynamically maintains and updates the anchor point across charts, allowing users to focus on their analysis instead of time-consuming adjustments.
________________________________________
⭐ Goal of the Indicator
The primary goal of this indicator is to automate the manual process of anchoring the VWAP for multiple charts or stocks. By removing the need to manually set the anchor every day, this script simplifies the workflow and saves valuable time for traders.
The examples and chart illustrations provided showcases some of the most common and widely used ways traders utilize anchored VWAP in their strategies. They are intended as demonstrations, not exhaustive applications, as specific use cases may vary based on individual trading approaches.
________________________________________
⭐ Why the Name?
1).N-Day Anchored:
The term "N-Day Anchored" reflects the flexibility of the anchor point. Users can specify the number of days prior to the present day where the VWAP calculation should begin. For
example:
🟢"0" anchors the VWAP to the current day's opening.
🟢"1" anchor it to the previous day's opening.
🟢"2" anchors it to the day before yesterday, and so on.
2).Rolling:
The "Rolling" aspect signifies that the anchor point remains consistent relative to the current day. For instance:
If the anchor is set to the day before yesterday, the indicator will continuously adjust to
ensure the anchor remains two days prior, even as new trading days begin. This means the
lines plotted always reflect the VWAP anchored to the chosen
relative day, regardless of how many days have passed.
________________________________________
⭐ Inputs, Settings, and Functionality
1). Anchor Point (Days Prior): Use the "Days prior" input to set the anchor point for VWAP:
🟢"0": Anchors the VWAP to the start of the current day's trading session.
🟢"1": (default): Anchors the VWAP to the start of the previous day's trading session.
🟢"2": Anchors the VWAP to the day before yesterday, and so on.
This input determines the starting point for the VWAP calculation and updates dynamically each day.
2). VWAP Line Customization: The orange dashed line represents the anchored VWAP.
You can adjust its color through the input’s menu.
3). Standard Deviation Bands:
⭕ Three Bands: The indicator plots three upper and three lower bands to represent standard deviation levels from the VWAP.
➡️ On the current day, these bands are plotted as thick, solid lines with bright colors, providing clear real-time plotting.
➡️ On historical days, the bands appear as faint, dotted lines, offering a visual
representation of the anchored VWAP without cluttering the chart.
⭕ Customizable Settings:
➡️Multiplier: Set the distance of each band from the VWAP.
➡️Colors: Choose separate colors for the upper and lower bands.
➡️Visibility Toggle: Enable or disable specific bands as needed.
This clear differentiation ensures traders can easily distinguish between real-time plotting (current day) and the visualization of historical anchoring.
________________________________________
⭐ Example Use Cases
1). Trend Filter: Use the anchored VWAP as a trend filter:
➡️When the price is above the anchored VWAP, the trend is bullish.
➡️When the price is below the anchored VWAP, the trend is bearish.
2). 2-Day Anchored VWAP Strategy: This strategy uses the VWAP anchored to the
previous day’s opening candle, continuing through today’s price action. Traders can
identify entry and exit points based on how the price interacts with this 2-day anchored VWAP.
3). Standard Deviation Bands as Support or Resistance: Utilize the standard deviation
bands to find potential support and resistance levels, as prices often react near these
bands.
4). VWAP Rejection (VWAP Bounce): Look for rejections near the anchored VWAP to
confirm a continuation of the current trend. For example, if the price rejects the 2-day
anchored VWAP, it can signal a strong continuation in the current trend direction.
VWAP Fibonacci Bands (Zeiierman)█ Overview
The VWAP Fibonacci Bands is a sophisticated yet user-friendly indicator designed to assist traders in visualizing market trends, volatility, and potential support/resistance levels. Developed by Zeiierman, this tool integrates the MIDAS (Market Interpretation Data Analysis System) methodology with Standard Deviation Bands and user-defined Fibonacci levels to provide a comprehensive market analysis framework.
This indicator is built for traders who want a dynamic and customizable approach to understanding market movements, offering features that adapt to varying market conditions. Whether you're a scalper, swing trader, or long-term investor.
█ How It Works
⚪ Anchor Point System
The indicator begins its calculations based on an anchor point, which can be set to:
A specific date for historical analysis or alignment with significant market events.
A timeframe-based reset, dynamically restarting calculations at the beginning of each selected period (e.g., daily, weekly, or monthly).
This dual-anchor method ensures flexibility, allowing the indicator to align with various trading strategies.
⚪ MIDAS Calculation
The MIDAS calculation is central to this indicator. It uses cumulative price and volume data to compute a volume-weighted average price (VWAP), offering a trendline that reflects the true value weighted by trading activity.
⚪ Standard Deviation Bands
The upper and lower bands are calculated using the standard deviation of price movements around the MIDAS line.
⚪ Fibonacci Levels
User-defined Fibonacci ratios are used to plot additional support and resistance levels between the bands. These levels provide visual cues for potential price reversals or trend continuations.
█ How to Use
⚪ Trend Identification
Uptrend: The price remains above the MIDAS line.
Downtrend: The price stays below the MIDAS line and aligns with the lower bands.
⚪ Support and Resistance
The upper and lower bands act as support and resistance levels.
Fibonacci levels provide intermediate zones for potential price reversals.
⚪ Volatility Analysis
Wider bands indicate periods of high volatility.
Narrower bands suggest low-volatility conditions, often preceding breakouts.
⚪ Overbought/Oversold Conditions
Look for the price beyond the upper or lower bands to identify extreme conditions.
█ Settings
Set Anchor Method
Anchor Method: Choose between Timeframe or Date to define the starting point of calculations.
Anchor Timeframe: For Timeframe mode, specify the interval (e.g., Daily, Weekly).
Anchor Date: For Date mode, set the exact starting date for historical alignment.
Set Std Dev Multiplier
Controls the width of the bands:
Higher values widen the bands, filtering out minor fluctuations.
Lower values tighten the bands for more responsive analysis.
Set Fibonacci Levels
Define custom Fibonacci ratios (e.g., 0.236, 0.382) to plot intermediate levels between the bands.
█ Tips for Fine-Tuning
⚪ For Trend Trading:
Use higher Std Dev Multipliers to focus on long-term trends and avoid noise. Adjust Anchor Timeframe to Weekly or Monthly for broader trend analysis.
⚪ For Reversal Trading:
Tighten the bands with a lower Std Dev Multiplier.
Use shorter anchor timeframes for intraday reversals (e.g., Hourly).
⚪ For Volatile Markets:
Increase the Std Dev Multiplier to accommodate wider price swings.
⚪ For Quiet Markets:
Decrease the Std Dev Multiplier to highlight smaller fluctuations.
-----------------
Disclaimer
The information contained in my Scripts/Indicators/Ideas/Algos/Systems does not constitute financial advice or a solicitation to buy or sell any securities of any type. I will not accept liability for any loss or damage, including without limitation any loss of profit, which may arise directly or indirectly from the use of or reliance on such information.
All investments involve risk, and the past performance of a security, industry, sector, market, financial product, trading strategy, backtest, or individual's trading does not guarantee future results or returns. Investors are fully responsible for any investment decisions they make. Such decisions should be based solely on an evaluation of their financial circumstances, investment objectives, risk tolerance, and liquidity needs.
My Scripts/Indicators/Ideas/Algos/Systems are only for educational purposes!

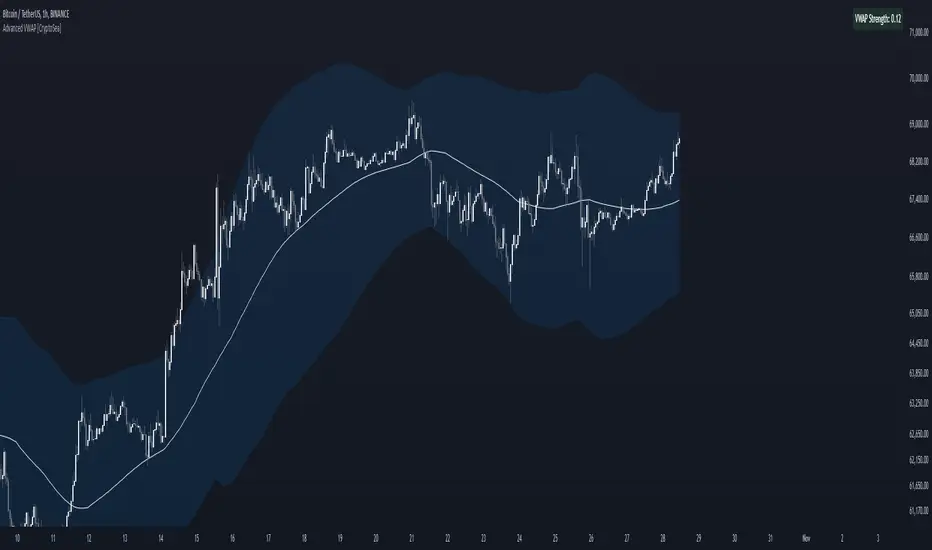
Advanced VWAP [CryptoSea]The Advanced VWAP is a comprehensive volume-weighted average price (VWAP) tool designed to provide traders with a deeper understanding of market trends through multi-layered VWAP analysis. This indicator is ideal for those who want to track price movements in relation to VWAP bands and detect key market levels with greater precision.
Key Features
Multi-Timeframe VWAP Bands: Includes multiple VWAP bands with different lookback periods (5, 10, 25, and 50), allowing traders to observe short-term and long-term price behavior.
Smoothed Band Options: Offers optional smoothing of VWAP bands to reduce noise and highlight significant trends more clearly.
Dynamic Median Line Display: Plots the median line of the VWAP bands, providing a reference for price movements and potential reversal zones.
VWAP Trend Strength Calculation: Measures the strength of the trend based on the price's position relative to the VWAP bands, normalized between -1 and 1 for easier interpretation.
In the example below we can see the VWAP Forecastd Cloud, which consists of multiple layers of VWAP bands with varying lookback periods, creating a dynamic forecast visualization. The cloud structure represents potential future price ranges by projecting VWAP-based bands outward, with darker areas indicating higher density and overlap of the bands, suggesting stronger support or resistance zones. This approach helps traders anticipate price movement and identify areas of potential consolidation or breakout as the price interacts with different layers of the forecast cloud.
How it Works
VWAP Calculation: Utilizes multiple VWAP calculations based on various lookback periods to capture a broad range of price behaviors. The indicator adapts to different market conditions by switching between short-term and long-term VWAP references.
Smoothing Algorithms: Provides the ability to smooth the VWAP bands using different moving average types (SMA, EMA, SMMA, WMA, VWMA) to suit various trading strategies and reduce market noise.
Trend Strength Analysis: Computes the trend strength based on the price's distance from the VWAP bands, with a value range of -1 to 1. This feature helps traders identify the intensity of uptrends and downtrends.
Alert Conditions: Includes alert options for crossing above or below the smoothed median line, as well as touching the smoothed upper or lower bands, providing timely notifications for potential trading opportunities.
This image below illustrates the use of smoothed VWAP bands, which provide a cleaner representation of the price's relationship to the VWAP by reducing market noise. The smoothed bands create a flowing cloud-like structure, making it easier to observe significant trends and potential reversal points. The circles highlight areas where the price interacts with the smoothed bands, indicating potential key levels for trend continuation or reversal. This setup helps traders focus on meaningful movements and filter out minor fluctuations, improving the identification of strategic entry and exit points based on smoother trend signals.
Application
Strategic Entry and Exit Points: Helps traders identify optimal entry and exit points based on the interaction with VWAP bands and trend strength readings.
Trend Confirmation: Assists in confirming trend strength by analyzing price movements relative to the VWAP bands and detecting significant breaks or touches.
Customized Analysis: Supports a wide range of trading styles by offering adjustable smoothing, band settings, and alert conditions to meet specific trading needs.
The Advanced VWAP by is a valuable addition to any trader's toolkit, offering versatile features to navigate different market scenarios with confidence. Whether used for day trading or longer-term analysis, this tool enhances decision-making by providing a robust view of price behavior relative to VWAP levels.
Multi-timeframe 24 moving averages + BB+SAR+Supertrend+VWAP █ OVERVIEW
The script allows to display up to 24 moving averages ("MA"'s) across 5 timeframes plus two bands (Bollinger Bands or Supertrend or Parabolic SAR or VWAP bands) each from its own timeframe.
The main difference of this script from many similar ones is the flexibility of its settings:
- Bulk enable/disable and/or change properties of several MAs at once.
- Save 3 of your frequently used templates as presets using CSV text configurations.
█ HOW TO USE
Some use examples:
In order to "show 31, 50, 200 EMAs and 20, 100, 200 SMAs for each of 1H, 4H, D, W, M timeframes using blue for short MA, yellow for mid MA and red for long MA" use the settings as shown on a screenshot below.
In order to "Show a band of chart timeframe MA's of lengths 5, 8, 13, 21, 34, 55, 100 and 200 plus some 1H, 4H, D and W MAs. Be able to quickly switch off the band of chart tf's MAs. For chart timeframe MA's only show labels for 21, 100 and 200 EMAs". You can set TF1 and TF2 to chart's TF and set you fib MAs there and configure fixed higher timeframe MAs using TF3, TF4 and TF5 (e.g. using 1H, D and W timeframes and using 1H 800 in place of 4H 200 MA). However, quicker way may be using CSV - the syntax is very simple and intuitive, see Preset 2 as it comes in the script. You can easily switch chart tf's band of MAs by toggling on/off your chart timeframe TF's (in our example, TF1 and TF2).
The settings are either obvious or explained in tooltips.
Note 1: When using group settings and CSV presets do not forget that individual setting affected will no have any effect. So, if some setting does not work, check whether it is overridden with some group setting or a CSV preset.
Note 2: Sometimes you can notice parts of MA's hanging in the air, not lasting up to the last bar. This is not a bug as explained on this screenshot:
█ FOR DEVELOPERS
The script is a use case of my CSVParser library, which in turn uses Autotable library, both of which I hope will be quite helpful. Autotable is so powerful and comprehensive that you will hardly ever wish to use normal table functions again for complex tables.
The indicator was inspired by Pablo Limonetti's url=https://www.tradingview.com/script/nFs56VUZ/]Multi Timeframe Moving Averages and Raging @RagingRocketBull's # Multi SMA EMA WMA HMA BB (5x8 MAs Bollinger Bands) MAX MTF - RRB

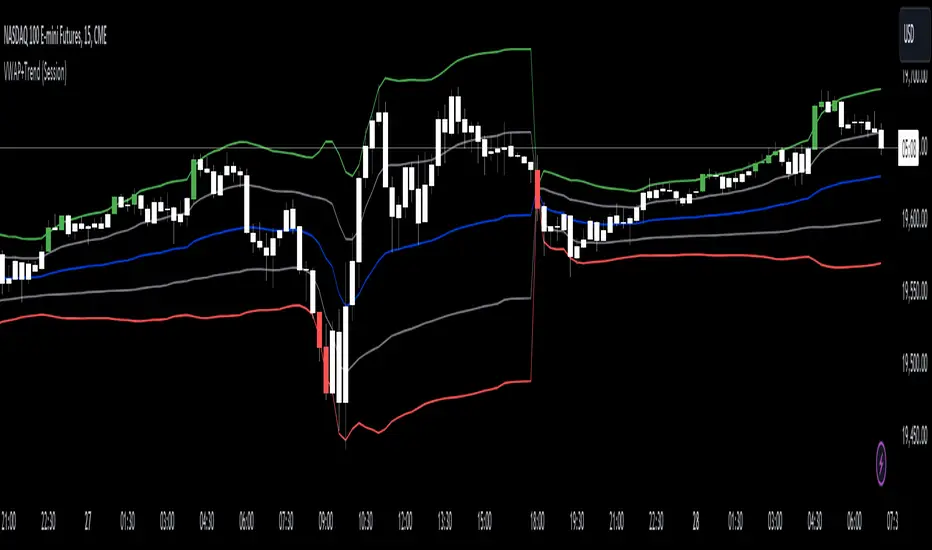
VWAP with Trend Alerts [CrossTrade]The VWAP with Trend Alerts indicator is designed to provide a comprehensive visual and analytical tool for traders using the Volume Weighted Average Price (VWAP) along with additional features like custom bar coloring and trend-based signal alerts.
Key Components and Functionalities:
1. VWAP Calculation: The core of this indicator is the VWAP, which represents the average price of an asset, weighted by volume. It's a popular tool among traders to identify the general direction and strength of a trend, and for assessing entry and exit points.
2. Standard Deviation Bands: Surrounding the VWAP are multiple bands calculated based on standard deviation values. These bands serve as dynamic support and resistance levels. The script allows up to three bands, each with customizable multipliers, giving insights into price volatility and potential breakout or reversal points.
3. Bar Coloring Options:
- Color All Bars: When enabled, all bars on the chart are colored based on whether they close above (green) or below (red) the VWAP.
- Trend Bars Only: This option, when selected, colors only the bars that close beyond the second standard deviation band. It helps in identifying stronger trends and significant market movements.
4. Buy and Sell Signal Conditions: The script includes conditions for buy and sell signals specifically tailored for trend bars. A buy signal is generated when a bar closes above both the VWAP and the upper second standard deviation band, indicating a potential strong uptrend. Conversely, a sell signal is triggered when a bar closes below both the VWAP and the lower second standard deviation band, suggesting a strong downtrend.
5. Alert Conditions: To aid in timely decision-making, the script features alert conditions corresponding to the buy and sell signals.
Usage and Application:
- For Trend Identification: The VWAP and its bands can help identify the prevailing market trend. Bars closing consistently above the VWAP suggest an uptrend, while those closing below indicate a downtrend.
- Volatility Assessment: The standard deviation bands provide a visual representation of market volatility. Narrower bands suggest low volatility, while wider bands indicate high volatility.
- Signal Alerts for Trading: The buy and sell signals, especially those filtered by the trend bars condition, can be valuable for traders looking for strong movement confirmations.
Flexibility and Customization:
This indicator is highly customizable and builds off of the core logic found in standard VWAP indicators. By allowing traders to adjust the standard deviation multipliers and choose their preferred bar coloring strategy. It caters to various trading styles, whether focusing on the broader market trend or pinpointing significant trend-based movements.
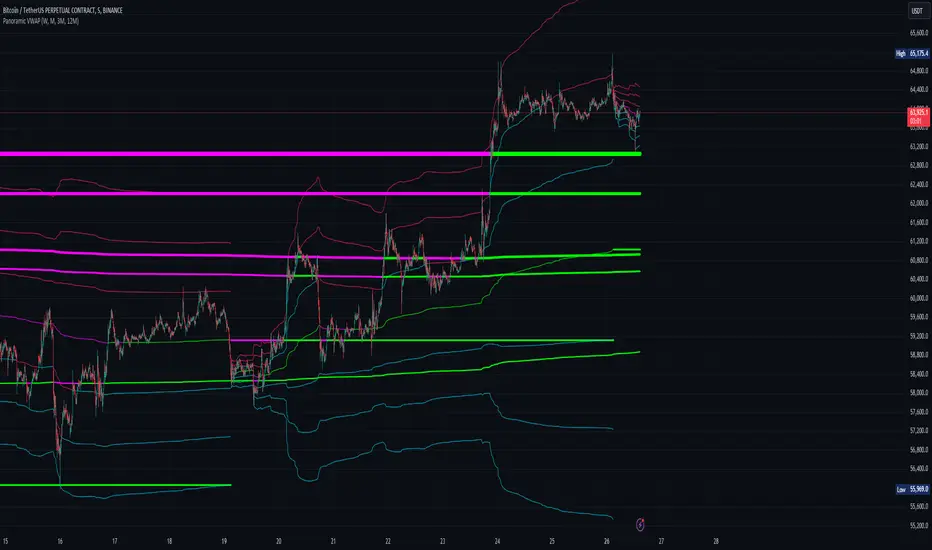
Panoramic VWAP### Panoramic VWAP Indicator Overview
The Panoramic VWAP indicator provides a way to display up to four Volume Weighted Average Price (VWAP) lines on a chart, each anchored to different timeframes. This indicator also includes options for displaying standard deviation bands and close lines, offering a comprehensive view of price action across multiple time horizons.
### Key Features
Quad VWAPs : The indicator allows for the display of four VWAP lines simultaneously. Each line can be set to a different timeframe, enabling traders to analyze market conditions across various periods on a single chart.
Standard Deviation Bands : Users can enable bands around each VWAP line, which represent standard deviations or percentage levels from the VWAP. These bands help in assessing volatility and identifying potential overbought or oversold conditions.
Close Lines : The indicator includes an option to show close lines, marking the price's closing level relative to the VWAP. This feature is useful for examining how the market closes in relation to VWAP, which can be important for understanding trend strength or potential reversals.
### How It Looks
VWAP Lines : Multiple VWAP lines are displayed, each reflecting different timeframes. The lines change color depending on whether the price is above or below the VWAP, indicating bullish or bearish momentum.
Bands : Optional bands around the VWAP lines provide a visual indication of volatility, with the potential to identify overbought or oversold areas.
Close Lines : These lines represent the price's closing level relative to the VWAP and can be displayed to add further context to the analysis.
### How to Use It
Trend Analysis :
- Price above a VWAP line indicates bullish momentum .
- Price below a VWAP line suggests bearish momentum .
Support and Resistance :
- VWAP lines often act as dynamic support and resistance. Price approaching a VWAP line from above may find support, while approaching from below may encounter resistance.
Volatility Assessment :
- Bands around the VWAP lines can signal areas of potential reversal. Upper bands may indicate overbought conditions, while lower bands may indicate oversold conditions.
Multiple Timeframe Analysis :
- The ability to display VWAPs from different timeframes simultaneously allows for the identification of confluence zones, where multiple VWAP levels align, indicating potentially significant support or resistance levels.
Customization :
- The indicator settings are customizable, allowing users to choose which VWAP lines, bands, and close lines to display, along with adjustments for visual preferences like line thickness and colors.
### Practical Application
Intraday Trading : Traders can use the VWAPs and bands to identify potential entry and exit points during the trading day based on price interactions with these levels.
Swing Trading : Monitoring VWAP lines across different timeframes can help identify key levels where price might reverse or gain momentum, aiding in decisions about holding or exiting positions.
Long-Term Analysis : VWAP lines on higher timeframes can serve as dynamic support or resistance levels, providing context for long-term trend analysis and investment decisions.
The Panoramic VWAP indicator allows for a detailed analysis of price trends and levels across multiple timeframes, combining VWAPs, standard deviation bands, and close lines in a single, customizable tool.
VWAP Bands [TradingFinder] 26 Brokers Data (Forex + Crypto)🔵 Introduction
Indicators are tools that help analysts predict the price trend of a stock through mathematical calculations on price or trading volume. It is evident that trading volume significantly impacts the price trend of a stock symbol.
The Volume-Weighted Average Price (VWAP) indicator combines the influence of trading volume and price, providing technical analysts with a practical tool.
This technical indicator determines the volume-weighted average price of a symbol over a specified time period. Consequently, this indicator can be used to identify trends and entry or exit points.
🟣 Calculating the VWAP Indicator
Adding the VWAP indicator to a chart will automatically perform all calculations for you. However, if you wish to understand how this indicator is calculated, the following explains the steps involved.
Consider a 5-minute chart. In the first candle of this chart (which represents price information in the first 5 minutes), sum the high, low, and close prices, and divide by 3. Multiply the resulting number by the volume for the period and call it a variable (e.g., X).
Then, divide the resulting output by the total volume for that period to calculate your VWAP. To maintain the VWAP sequence throughout the trading day, it is necessary to add the X values obtained from each period to the previous period and divide by the total volume up to that time. It is worth noting that the calculation method is the same for intervals shorter than a day.
The mathematical formula for this VWAP indicator : VWAP = ∑ (Pi×Vi) / ∑ Vi
🔵 How to Use
Traders might consider the VWAP indicator as a tool for predicting trends. For example, they might buy a stock when the price is above the VWAP level and sell it when the price is below the VWAP.
In other words, when the price is above the VWAP, the price is rising, and when it is below the VWAP, the price is falling. Major traders and investment funds also use the VWAP ratio to help enter or exit stocks with the least possible market impact.
It is important to note that one should not rely solely on the VWAP indicator when analyzing symbols. This is because if prices rise quickly, the VWAP indicator may not adequately describe the conditions. This indicator is generally used for daily or shorter time frames because using longer intervals can distort the average.
Since this indicator uses past data in its calculations, it can be considered a lagging indicator. As a result, the more data there is, the greater the delay.
🟣 Difference Between VWAP and Simple Moving Average
On a chart, the VWAP and the simple moving average may look similar, but these two indicators have different calculations. The VWAP calculates the total price considering volume, while the simple moving average does not consider volume.
In simpler terms, the VWAP indicator measures each day's price change relative to the trading volume that occurred that day. In contrast, the simple moving average implicitly assumes that all trading days have the same volume.
🟣 Reasons Why Traders Like the VWAP Indicator
The VWAP Considers Volume: Since VWAP takes volume into account, it can be more reliable than a simple arithmetic average of prices. Theoretically, one person can buy 200,000 shares of a symbol in one transaction at a single price.
However, during the same time frame, 100 other people might place 200 different orders at various prices that do not total 100,000 shares. In this case, if you only consider the average price, you might be mistaken because trading volume is ignored.
The Indicator Can Help Day Traders: While reviewing your trades, you might notice that the shares you bought at market price are trading below the VWAP indicator.
In this case, there's no need to worry because with the help of VWAP, you always get a price below the average. By knowing the volume-weighted average price of a stock, you can easily make an informed decision about paying more or less than other traders for the stock.
VWAP Can Signal Market Trend Changes: Buying low and selling high can be an excellent strategy for individuals. However, you are looking to buy when prices start to rise and sell your shares when prices start to fall.
Since the VWAP indicator simulates a balanced price in the market, when the price crosses above the VWAP line, one can assume that traders are willing to pay more to acquire shares, and as a result, the market will grow. Conversely, when the price crosses below the line, this can be considered a sign of a downward movement.
🔵 Setting
Period : Indicator calculation time frame.
Source : The Price used for calculations.
Market Ultra Data : If you turn on this feature, 26 large brokers will be included in the calculation of the trading volume.
The advantage of this capability is to have more reliable volume data. You should be careful to specify the market you are in, FOREX brokers and Crypto brokers are different.
Multiplier : Coefficient of band lines.

VWAP with RSIVWAP with RSI Indicator
Overview
The VWAP with RSI Indicator is a powerful tool that combines the Volume Weighted Average Price (VWAP) with the Relative Strength Index (RSI) to provide traders with comprehensive insights into price trends, volume-weighted price levels, and market momentum. This dual-indicator setup enhances your trading strategy by offering a clearer understanding of the market conditions, potential entry and exit points, and trend reversals.
Key Features
VWAP (Volume Weighted Average Price):
Calculation: The VWAP is calculated using the high, low, and close prices, weighted by trading volume over a specified period.
Purpose: VWAP provides an average price that reflects the trading volume at different price levels, helping traders identify the true average price over a given period.
Visualization: The VWAP line is plotted in blue on the price chart, indicating the volume-weighted average price.
RSI (Relative Strength Index):
Calculation: RSI is based on the average gains and losses over a specified period (default is 14 periods) and ranges from 0 to 100.
Purpose: RSI measures the speed and change of price movements, identifying overbought or oversold conditions in the market.
Overbought/Oversold Levels:
Overbought: RSI above 70 (red line).
Oversold: RSI below 30 (green line).
Midline: RSI at 50 (gray dashed line).
Visualization: The RSI line changes color based on its value (purple for normal, red for overbought, green for oversold) and is plotted below the price chart.
Background Fill for RSI:
Overbought Area: Shaded red when RSI is above 70.
Oversold Area: Shaded green when RSI is below 30.
Bullish and Bearish Divergence Detection:
Bullish Divergence: Occurs when price forms a lower low, but RSI forms a higher low, indicating potential upward reversal.
Visualization: Bullish divergence points are marked with a green line and labeled "Bull."
Bearish Divergence: Occurs when price forms a higher high, but RSI forms a lower high, indicating potential downward reversal.
Visualization: Bearish divergence points are marked with a red line and labeled "Bear."
Alerts: Conditions for bullish and bearish divergences trigger alerts.
Settings
VWAP Settings:
hideonDWM: Option to hide VWAP on daily or higher timeframes.
src: Source for VWAP calculation (default is hlc3 - (high + low + close)/3).
offset: Offset for plotting the VWAP.
RSI Settings:
rsiLengthInput: Period length for RSI calculation (default is 14).
rsiSourceInput: Source for RSI calculation (default is close price).
maTypeInput: Type of moving average applied to RSI (options: SMA, EMA).
maLengthInput: Length of the moving average applied to RSI.
How to Use
Trend Identification: Use VWAP to identify the average price level and market trend. If the price is above VWAP, it suggests an uptrend, and if below, it suggests a downtrend.
Overbought/Oversold Conditions: Use RSI to identify potential reversal points. RSI above 70 indicates overbought conditions, and below 30 indicates oversold conditions.
Divergence: Look for bullish or bearish divergences between price and RSI to anticipate potential trend reversals.
Conclusion
By combining VWAP and RSI, this indicator provides a robust framework for analyzing market conditions, identifying trends, and making more informed trading decisions. Enhance your trading strategy today with the VWAP with RSI Indicator!

VWAP Bands [UAlgo]The "VWAP Bands " indicator is designed to provide traders with valuable insights into market trends and potential support/resistance levels using Volume Weighted Average Price (VWAP) bands. This indicator integrates the core concepts of VWAP with additional trend analysis features, making it a versatile tool for both range trading and trend-following strategies.
The VWAP bands are plotted based on the standard deviation multipliers, creating upper and lower bands around the VWAP. These bands serve as dynamic support and resistance levels. When the price approaches these bands, traders can anticipate potential reversals or continuations of the current trend. Additionally, the indicator provides visual cues for trend strength and potential trend changes, helping traders make informed decisions in various market conditions.
🔶 Settings
Source (Data Source): The data source for VWAP calculations. The default setting is the typical price (HLC3), which is the average of the high, low, and close prices.
Length: The number of bars used in the VWAP calculation. This determines the lookback period for the indicator.
Standard Deviation Multiplier: The multiplier applied to the standard deviation to create the primary upper and lower VWAP bands. This setting controls the distance of the bands from the VWAP.
Secondary Standard Deviation Multiplier: The multiplier applied to the standard deviation to create the secondary upper and lower VWAP bands, providing additional levels of support and resistance.
Display Trend: A toggle to enable or disable the display of the trend analysis feature. When enabled, the indicator highlights trend strength and potential trend changes.
Display Trend Crossovers: A toggle to enable or disable the display of trend crossover signals. When enabled, the indicator plots shapes to indicate where trend switches are likely occurring.
🔶 Calculations
The calculations behind the "VWAP Bands " indicator begin with determining the Volume Weighted Average Price (VWAP), which provides a comprehensive view of the average price of an asset, weighted by trading volume. This gives a more accurate representation of the asset's true average price over a specified period.
The first step in this process involves summing the trading volume over a chosen period, typically represented by the length parameter. Simultaneously, the product of the price (usually an average of the high, low, and close prices) and the trading volume is calculated and summed. By dividing this cumulative price-volume product by the total volume, we obtain the VWAP value. This VWAP serves as the central anchor around which the price action oscillates.
To enhance the utility of VWAP, we introduce standard deviation calculations. Standard deviation measures the extent of price dispersion from the VWAP, providing insight into price volatility. By calculating the variance (which involves the squared deviations of price) and then taking its square root, we derive the standard deviation. This helps in understanding how far prices typically stray from the VWAP.
With the VWAP and standard deviation in hand, we then establish upper and lower bands by adding and subtracting multiples of the standard deviation from the VWAP. These bands act as dynamic support and resistance levels, adapting to changes in market volatility. The primary bands, set by the first standard deviation multiplier, are augmented by secondary bands defined by a larger multiplier, offering additional layers of potential support and resistance.
It also integrates trend analysis, highlighting areas where the price action suggests a strong or weak trend. This is achieved by overlaying colored zones above and below the bands, indicating the strength and direction of the trend. When the price crosses these bands, it signals potential trend changes, aiding traders in making timely decisions.
🔶 Disclaimer
The "VWAP Bands " indicator is provided for educational and informational purposes only. It is not intended as financial advice and should not be construed as such.
Trading involves significant risk and may not be suitable for all investors. Before using this indicator or making any investment decisions, it is important to conduct thorough research and consider your financial situation.

[MAD] Custom Session VWAP BandsOverview
This indicator helps visualize the Volume Weighted Average Price (VWAP) and its associated standard deviation bands over specified time periods, providing traders with a clear understanding of price trends, volatility, and potential support/resistance levels.
Inputs
Deviation
StDev mult 1: Multiplier for the first standard deviation band (Default: 1.0)
StDev mult 2: Multiplier for the second standard deviation band (Default: 2.0)
StDev mult 3: Multiplier for the third standard deviation band (Default: 3.0)
StDev mult 4: Multiplier for the fourth standard deviation band (Default: 4.0)
Line width: Width of the lines for the bands (Default: 2)
Custom Vwap session reset settings
Many different options are considered when a session is going to be reset.
Plot and Fill Options
Enable Fills: Enable/disable filling between bands.
Plot +4: Enable/disable plotting the +4 standard deviation band.
Plot +3: Enable/disable plotting the +3 standard deviation band.
Plot +2: Enable/disable plotting the +2 standard deviation band.
Plot +1: Enable/disable plotting the +1 standard deviation band.
Plot VWAP: Enable/disable plotting the VWAP line.
Plot -1: Enable/disable plotting the -1 standard deviation band.
Plot -2: Enable/disable plotting the -2 standard deviation band.
Plot -3: Enable/disable plotting the -3 standard deviation band.
Plot -4: Enable/disable plotting the -4 standard deviation band.
How to Use the Indicator
Adding the Indicator
Add the indicator to your chart through your trading platform's indicator menu.
Configuring the VWAP Reset
Specify reset intervals based on time, days of the week, or specific dates.
Adjust the time zone if necessary.
Customizing Standard Deviation Bands
Set the multipliers for the standard deviation bands.
Choose line width for better visualization.
Enabling Plots and Fills
Select which bands to display.
Enable or disable fills between the bands.
Practical Application of VWAP Bands
Understanding VWAP
VWAP is a trading benchmark that calculates the average price a security has traded at throughout the day based on volume and price. It is primarily used for intraday trading but can also offer insights during end-of-day reviews.
Using VWAP for Trading
Intraday Trading
Entry and Exit Points: VWAP can help identify optimal buy and sell points. Buy when the price is above VWAP and sell when it's below.
Support and Resistance: VWAP often acts as a dynamic support/resistance level. Prices tend to revert to VWAP, making it a crucial level for intraday traders.
Trend Confirmation
Uptrends and Downtrends: In an uptrend, the price will generally stay above VWAP. Conversely, in a downtrend, it will stay below. Use this to confirm market direction.
Combining with Other Indicators
Moving Averages and Bollinger Bands: Combining VWAP with these indicators can provide a more robust trading signal, confirming trends and potential reversals.
Setting Stop-Loss and Profit Targets
Conservative Stop Orders: Place stop orders at recent lows for pullback trades.
Profit Targets: Use daily highs or Fibonacci extension levels to set profit targets.
Strategies for Using VWAP
Pullback Strategy
Buy during pullbacks to VWAP in an uptrend, and sell during rallies to VWAP in a downtrend.
Breakout Strategy
Look for breakouts above/below VWAP after the market open to capitalize on new trends.
Momentum Trading
Use VWAP to confirm the strength of a trend. Buy when the price is consistently above VWAP and sell when it's consistently below.
Institutional Strategies
Institutional traders use VWAP to execute large orders without causing significant market impact, ensuring trades are made around the average price.
By incorporating these strategies, traders can better understand market dynamics, make informed trading decisions, and manage their risk effectively.
Some setup possibilities
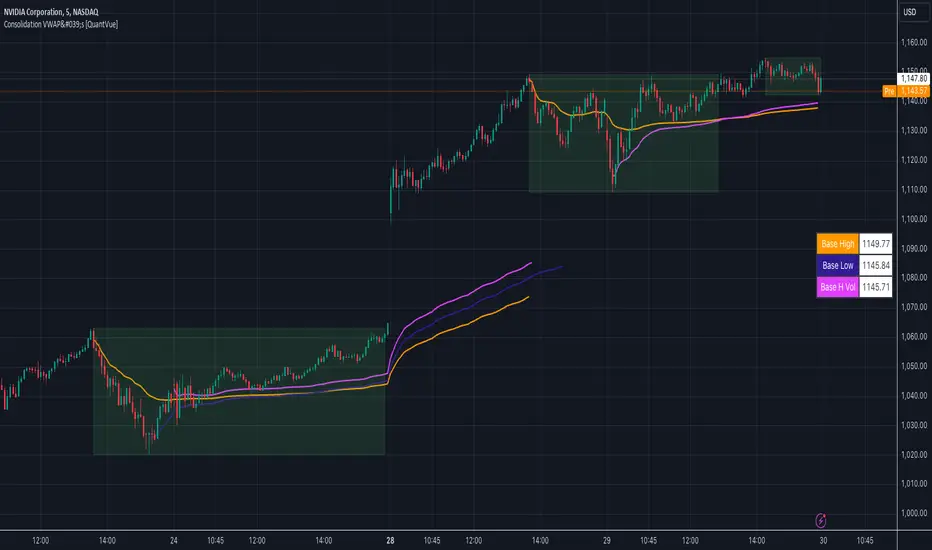
Consolidation VWAP's [QuantVue]Introducing the Consolidation VWAP's Indicator , a powerful tool designed to identify consolidation periods in stock advance and automatically anchor three distinct VWAPs to key points within the consolidation.
Consolidation Period Identification:
The indicator automatically detects periods of consolidation or areas on the chart where a stock's price moves sideways within a defined range. This period can be seen as the market taking a "breather" as it digests the previous gains. Consolidations are important because they often act as a base for the next move, either continuing the previous uptrend or reversing direction.
Consolidation requirements can be customized by the user to match your instrument and timeframe.
Maximum Consolidation Depth
Minimum Consolidation Length
Maximum Consolidation Length
Prior Uptrend Amount
Anchored VWAP, or Anchored Volume-Weighted Average Price, is a technical analysis tool used to determine the average price of a stock weighted by volume, starting from a specific point in time chosen by the analyst.
Unlike traditional VWAP, which starts at the beginning of the trading session, the anchored VWAP allows traders to select any point on the chart, such as a significant event, price low, high, or a breakout, to begin the calculation.
VWAP incorporates price and volume in a weighted average and can be used to identify areas of support and resistance on the chart.
VWAP Anchored to Consolidation High: This VWAP is anchored at the highest price point within the identified consolidation period. It helps traders understand the
average price paid by buyers who entered at the peak of the consolidation.
VWAP Anchored to Consolidation Low: This VWAP is anchored at the lowest price point within the consolidation. It provides insights into the average price paid by
buyers who entered at the lowest point of the consolidation.
VWAP Anchored to Highest Volume in the Consolidation: This VWAP is anchored at the price level with the highest trading volume during the consolidation. It reflects the average price at
which the most trading activity occurred, often indicating a key support or resistance level.
The indicator also allows the trader to see past consolidation areas and previous anchored VWAP's.
Give this indicator a BOOST and COMMENT your thoughts!
We hope you enjoy.
Cheers!
Harmonic Rolling VWAP (Zeiierman)█ Overview
The Harmonic Rolling VWAP (Zeiierman) indicator combines the concept of the Rolling Volume Weighted Average Price (VWAP) with advanced harmonic analysis using Discrete Fourier Transform (DFT). This innovative indicator aims to provide traders with a dynamic view of price action, capturing both the volume-weighted price and underlying harmonic patterns. By leveraging this combination, traders can gain deeper insights into market trends and potential reversal points.
█ How It Works
The Harmonic Rolling VWAP calculates the rolling VWAP over a specified window of bars, giving more weight to periods with higher trading volume. This VWAP is then subjected to harmonic analysis using the Discrete Fourier Transform (DFT), which decomposes the VWAP into its frequency components.
Key Components:
Rolling VWAP (RVWAP): A moving average that gives more weight to higher volume periods, calculated over a user-defined window.
True Range (TR): Measures volatility by comparing the current high and low prices, considering the previous close price.
Discrete Fourier Transform (DFT): Analyzes the harmonic patterns within the RVWAP by decomposing it into its frequency components.
Standard Deviation Bands: These bands provide a visual representation of price volatility around the RVWAP, helping traders identify potential overbought or oversold conditions.
█ How to Use
Identify Trends: The RVWAP line helps in identifying the underlying trend by smoothing out short-term price fluctuations and focusing on volume-weighted prices.
Assess Volatility: The standard deviation bands around the RVWAP give a clear view of price volatility, helping traders identify potential breakout or breakdown points.
Find Entry and Exit Points: Traders can look for entries when the price is near the lower bands in an uptrend or near the upper bands in a downtrend. Exits can be considered when the price approaches the opposite bands or shows harmonic divergence.
█ Settings
VWAP Source: Defines the price data used for VWAP calculations. The source input defines the price data used for calculations. This setting affects the VWAP calculations and the resulting bands.
Window: Sets the number of bars used for the rolling calculations. The window input sets the number of bars used for the rolling calculations. A larger window smooths the VWAP and standard deviation bands, making the indicator less sensitive to short-term price fluctuations. A smaller window makes the indicator more responsive to recent price changes.
-----------------
Disclaimer
The information contained in my Scripts/Indicators/Ideas/Algos/Systems does not constitute financial advice or a solicitation to buy or sell any securities of any type. I will not accept liability for any loss or damage, including without limitation any loss of profit, which may arise directly or indirectly from the use of or reliance on such information.
All investments involve risk, and the past performance of a security, industry, sector, market, financial product, trading strategy, backtest, or individual's trading does not guarantee future results or returns. Investors are fully responsible for any investment decisions they make. Such decisions should be based solely on an evaluation of their financial circumstances, investment objectives, risk tolerance, and liquidity needs.
My Scripts/Indicators/Ideas/Algos/Systems are only for educational purposes!

VWAP Suite, Session Cloud RevOverview
The VWAP Suite with Standard Deviation Strategy is a comprehensive indicator designed to help traders make informed trading decisions based on the Volume Weighted Average Price (VWAP) and its associated standard deviation bands. This indicator provides multiple VWAP calculations for different timeframes (Session, Day, Week, Month) and incorporates standard deviation bands to identify potential trade entry and exit points.
Components
VWAP Calculation:
Session VWAP: VWAP calculated based on the current trading session.
Day VWAP: VWAP calculated for the daily timeframe.
Week VWAP: VWAP calculated for the weekly timeframe.
Month VWAP: VWAP calculated for the monthly timeframe.
Standard Deviation Bands:
The indicator includes three standard deviation bands (StDev 1, StDev 2, and StDev 3) around the VWAP. These bands help identify the dispersion of price from the VWAP, providing insight into potential overbought or oversold conditions.
Additional VWAP Lines:
VWAP 2: An additional VWAP line with a customizable timeframe (Day, Week, Month).
VWAP 3: Another VWAP line for further analysis with a customizable timeframe (Day, Week, Month).
Strategy Description
The primary strategy implemented in this indicator revolves around the second standard deviation band (StDev 2). The key aspects of this strategy include:
Entry Points:
Long Entry: Consider entering a long position when the price moves below the lower StDev 2 band and then starts to revert back towards the VWAP. This indicates a potential oversold condition.
Short Entry: Consider entering a short position when the price moves above the upper StDev 2 band and then starts to revert back towards the VWAP. This indicates a potential overbought condition.
Exit Points:
Long Exit: Exit the long position when the price moves back up to the VWAP or the upper StDev 1 band, indicating a normalization of the price.
Short Exit: Exit the short position when the price moves back down to the VWAP or the lower StDev 1 band, indicating a normalization of the price.
Risk Management:
Set stop-loss levels slightly beyond the StDev 3 bands to protect against significant adverse price movements.
Use trailing stops to lock in profits as the price moves favorably.
Customization
The VWAP Suite allows for extensive customization, enabling traders to adjust the following settings:
VWAP Mode: Select the timeframe for the primary VWAP calculation (Session, Day, Week, Month).
Line Widths and Colors: Customize the line widths and colors for VWAP and standard deviation bands.
Fill Opacity: Adjust the opacity of the fill between standard deviation bands for better visual clarity.
Additional VWAPs: Enable and customize additional VWAP lines (VWAP 2 and VWAP 3) for further analysis.
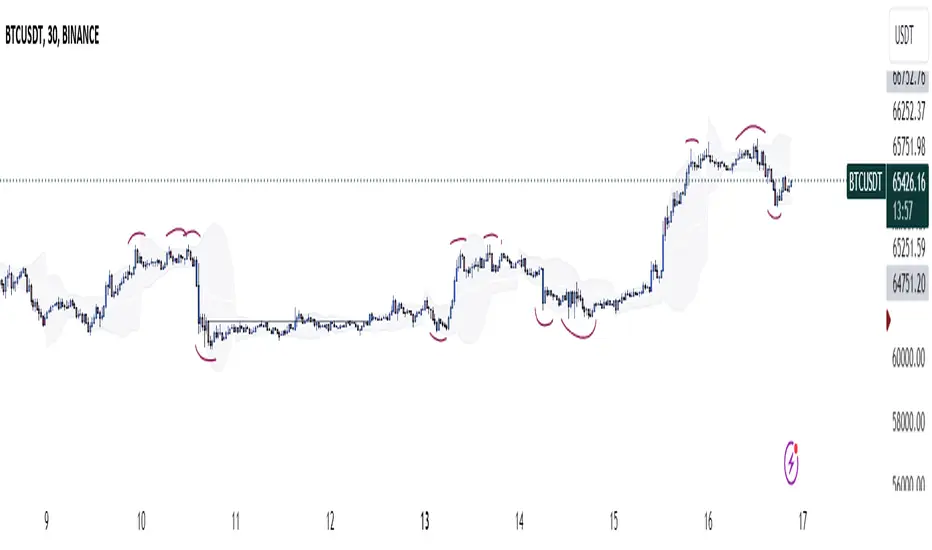
ASFX A2 VWAP [LuxAlgo]The ASFX A2 VWAP is a toolkit based on A2 signals and daily anchored VWAP bands, a methodology proposed by trader & educator Austin Silver (ASFX).
Pre-built alerts are also included.
🔶 USAGE
The A2 strategy involves identifying potential trades using specific signals and confirmation from the 21 EMA (Exponential Moving Average). Below we can see a bullish A2 signal triggering as price is closing below the 21 EMA with less than half of the candles closing price.
Within the settings, we have enabled the stop loss setting to assist us with trade setups generated from A2 signals.
Users can enable multiple layers of StDev multipliers on the AAVWAP to find areas of support & resistance alongside the A2 signals & other features included.
🔶 DETAILS
If 'Filter Based On VWAP' is enabled, bullish signals will only be displayed if located above the anchored VWAP, while bearish signals will only be displayed when located under the VWAP. The image above illustrates this, with transparent signals showing the ones that are supposed to be filtered.
The Stop Loss is based on the most recent A2 signal, and is constructed from the 1.618 Fibonacci retracement using the following points depending on the A2 signal:
Bullish: From candle low to the current daily maximum.
Bearish: From candle high to current daily minimum.
🔶 SETTINGS
🔹 A2
Validation EMA Period : Period of the EMA used to validate triggered A2 signals.
Trigger EMA Period : Period of the EMA used to trigger A2 signals.
Filter Based On VWAP : Filter A2 signals based on their location relative to the VWAP output.
🔹 VWAP
source : Input data for the anchored VWAP calculation
Show Central AVWAP : Display central VWAP on the chart
StDev Multiplier 1 : Display first VWAP bands, using a StDev multiplier of 1 by default.
StDev Multiplier 2 : Display second VWAP bands, using a StDev multiplier of 2 by default.
StDev Multiplier 3 : Display third VWAP bands, using a StDev multiplier of 3 by default.
🔹 Stop Loss
Stop Loss : Display stop loss based on the most recent A2 signal
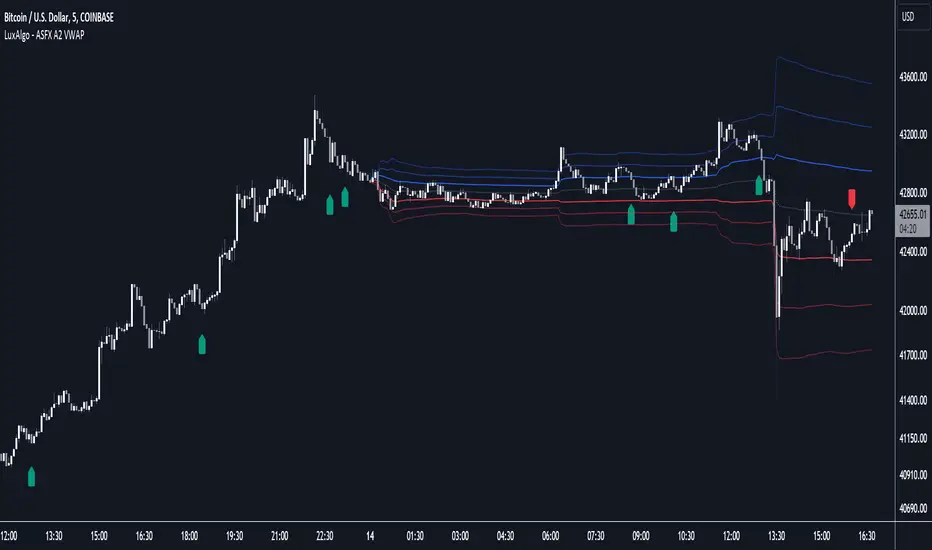
Quantum VWAP ProThe VWAP indicator is another of our suite of volume indicators and one which was first referred to in 1988 when it appeared in an article entitled “The Total Cost Of Transactions On The NYSE” in the March edition of the Journal Of Finance from that year, which went on to explain its importance, particularly from an institutional perspective, which underpins its significance in appreciating the power and importance of this indicator.
In many ways, it is akin to the volume price analysis methodology itself, as we are merely attempting to follow the footprints in the sand left by their passage and described by volume. The same is true here, but in this case, we are following the institutions in much the same way.
Originally, the VWAP indicator was developed as a benchmark to measure whether an institutional customer received a fair execution of their order by the broker buying and selling on their behalf. The difference between the reported price and the VWAP gave the customer a benchmark against which to judge whether they had received a fair price or not. A portfolio manager for example, wants to know how the price they paid compared to the average price of the stock during the time it took to fill the order. If an order is filled at a worse price than the VWAP, it raises questions as to the ability of the broker. If the broker purchased a million shares at $40.50 and the VWAP during this time was at $40.70, the customer is likely to be happy since they paid 20 cents less than ‘fair value’. Equally, if the stock were purchased above, at, say $40.90 per share, the customer would consider this a poor trade, paying well above the fair value price at the VWAP.
The simplicity of this easy-to-understand benchmark, which creates this fair value price concept, has led to its wholehearted adoption amongst the institutions, and moreover, why algorithmic VWAP orders now dominate institutional market activity. A huge percentage of institutional orders are executed as VWAP orders, which raises two key questions. First of all, why, and second, how can we benefit from using the indicator?
If we start with the why, according to reports from the leading market makers, almost 40% of orders are now executed on this basis as they attempt to obtain a buy or sell price close to or better than the VWAP during the time it takes to complete the buy or sell order. These orders, therefore, help to hugely reinforce the importance of the VWAP since it is the guiding principle on which these orders are based. Even Warren Buffet uses VWAP, as evidenced when he sold his entire position in Southwest Airlines over two days, holding 2.3 million shares.
This highlights the key issues for any large institutional investor involving the price. If executed in a single order, an order to buy a large block of shares would almost certainly swamp the market, raising the price exponentially and, in addition, overwhelm the average volume traded in the day.
It is this issue of putting the price up against their own buying or conversely seeing the price fall as a result of their own selling that leads to the parent and child order scenario where significant block orders are broken into a multitude of smaller orders, which are duly executed over days, weeks or months. It is this aspect of institutional order execution that makes the VWAP such a potent indicator.
However, at Quantum Trading, we don’t just build a single indicator and leave it at that! We always take them to another level, and here we have done the same, bundling together a total of five indicators into one amazing value package so you can select your favorite from those on offer. The reason for this is we recognize the different ways the volume-weighted average price is used, which is why we offer a total of FIVE variants to choose from, and these are as follows:
VWAP – Volume Weighted Average Price
MVWAP – Moving Volume Weighted Average Price
AVWAP – Anchored Volume Weighted Average Price
TWAP – Time Weighted Average Price
Interday Volume Weighted Average Price
All five variants include the option to display upper and lower bands that act as envelopes above and below the VWAP based on standard deviation, which you can adjust and set yourself. These price envelopes become essential dynamic support and resistance levels, which can help predict the extremes of price action as it oscillates around the VWAP from the fastest to the slowest timeframes and everything in between.
All five indicators are packaged into one powerful indicator, which we have named the Quantum VWAP Pro indicator for obvious reasons, and as you would expect, it works in all markets and instruments, whether stocks, futures, ETFs, forex or cryptocurrencies.
Finally, as with all our indicators, we recommend you use it in multiple timeframes.

VWAP with CharacterizationThis indicator is a visual representation of the VWAP (Volume Weighted Average Price), it calculates the weighted average price based on trading volume. Essentially, it provides a measure of the average price at which an asset has traded during a given period, but with a particular focus on trading volume. In our case, the indicator calculates the VWAP for the current trading symbol, using a predefined simple moving average (SMA) with a period of 14. This volume-weighted moving average offers a clearer view of the behavior of the VWAP and, of consequence of market dynamics.
One of the distinctive features of this indicator is its ability to provide a more "linear" representation of the data. This means that the data is "smoothed" to remove noise, allowing you to more easily identify the direction of the market trend. This smoother representation is especially useful because the financial market can be subject to significant fluctuations and volatility, and this indicator can help get a more stable view of the trend.
The indicator also offers a visualization of the market trend in a very intuitive way. Using an evaluation of the highs and lows of the last 10 days, determine whether the market is in an uptrend, downtrend, or no trend at all. To make this evaluation even clearer and more immediate, the indicator line is colored dynamically. When the trend is bullish, the line is blue, while in case of a bearish trend, it takes on a distinctive color, such as pink. If the trend is not defined, the line will be colored differently, for example light yellow. This coloration gives traders an immediate visual indication of the prevailing trend, allowing them to make more informed decisions regarding trading operations.
One potential strategy involves watching candles when they cross the VWAP line strongly. If, for example, a candlestick breaks above the VWAP line, we may look for retest areas near key support levels to gauge a potential long entry. In other words, we would consider that the price may have the potential to rise further after breaking above the VWAP line, and we would look to enter a long position to take advantage of this opportunity.
On the other hand, if a candlestick crosses below the VWAP line, we might consider looking for retest areas near the VWAP line itself, which now serves as potential resistance. This could indicate a possible short entry opportunity, as the price may struggle to break above the resistance represented by the VWAP line after breaking it down. In this case, we would look to take advantage of the expected continuation of the downtrend.
In both cases, the idea is to exploit significant movements across the VWAP line as signals of potential reversal or continuation of the trend. This strategy can help identify key entry points based on price behavior relative to the VWAP line.

TTP VWAP BandThis indicator offers 20 VWAP bands and on-chart statistic data about the bands.
Features
- Longs and shorts
- Cherry-pick up to 5 bands for backtesting
- Plots 20 bands
- Step scale to increase deviation percentage on each band
- Period and timeframe selectors
- Band crosses: how many times a band was crossed (also percentage)
- Band bounces: how many times each band was pinched and bounced back (also percentage)
How to use:
1) Set the chart to 15 or 5 minute timeframe for higher backtesting accuracy
2) Select the first band deviation % (MIN Long VWAP % and MIN Short VWAP %), use a small number like 0.3 or 1.0 since the rest of the 20 bands will increase that amount later.
3) Select a step scale or leave it in 1 if you prefer same distance between all bands. Notice that if you use a value below 1 the bands will get closer to each other.
4) Observe the statistics and pay attention to how many times each of the bands are being crossed in percentage. This will later help you make decisions on when to enter and where to potentially put an SL.
Connect with your preferred backtester:
You can backtest a single or multiple bands at once. For example you could use the 7th band to enter a base order and later use crosses of the 4th band to enter safety orders. Any combination is possible!
Let's assume you decide that you will be backtesting only 1 band at the time as your single entry condition for your backtester.
Let's also assume that you want to use the 2nd band for long entries then do follow these steps:
- Set "Band 1 backtesting" to 2 so that it prints 1 every time the price crosses below the 2nd band.
- Leave the other Band backtesting band settings with a 0 so they stay disabled
- Add your backtester to the same chart and select "band 1 long signal"
- This signal will contain 1 every time your conditions are met
