Hybrid Strategy: Trend/ORB/MTFHybrid Strategy: Trend + ORB + Multi-Timeframe Matrix
This script is a comprehensive "Trading Manager" designed to filter out noise and identify high-probability breakout setups. It combines three powerful concepts into a single, clean chart interface: Trend Alignment, Opening Range Breakout (ORB), and Multi-Timeframe (MTF) Analysis.
It is designed to prevent "analysis paralysis" by providing a unified Dashboard that confirms if the trend is aligned across 5 different timeframes before you take a trade.
How it Works
The strategy relies on the "Golden Trio" of confluence:
1. Trend Definition (The Setup) Before looking for entries, the script analyzes the immediate trend. A bullish trend is defined as:
Price is above the Session VWAP.
The fast EMA (9) is above the slow EMA (21). (The inverse applies for bearish trends).
2. The Signal (The Trigger) The script draws the Opening Range (default: first 15 minutes of the session).
Buy Signal: Price breaks above the Opening Range High while the Trend is Bullish.
Sell Signal: Price breaks below the Opening Range Low while the Trend is Bearish.
3. The Confirmation (The Filter) A signal is only valid if the Higher Timeframe (default: 60m) agrees with the direction. If the 1m chart says "Buy" but the 60m chart is bearish, the signal is filtered out to prevent false breakouts.
Key Features
The Matrix Dashboard A zero-lag, real-time table in the corner of your screen that monitors 5 user-defined timeframes (e.g., 5m, 15m, 30m, 60m, 4H).
Trend: Checks if Price > EMA 21.
VWAP: Checks if Price > VWAP.
ORB: Checks if Price is currently above/below the Opening Range of that session.
D H/L: Warns if price is near the Daily High or Low.
PD H/L: Warns if price is near the Previous Daily High or Low.
Visual Order Blocks The script automatically identifies valid Order Blocks (sequences of consecutive candles followed by a strong explosive move).
Chart: Draws Green/Red zones extending to the right, showing where price may react.
Dashboard: Displays the exact High, Low, and Average price of the most recent Order Blocks for precision planning.
Risk Management (Trailing Stop) Once a trade is active, the script plots Chandelier Exit dots (ATR-based trailing stop) to help you manage the trade and lock in profits during trend runs.
Visual Guide (Chart Legend)
⬜ Gray Box: Represents the Opening Range (first 15 minutes). This is your "No Trade Zone." Wait for price to break out of this box.
🟢 Green Line: The Opening Range High. A break above this line signals potential Bullish momentum.
🔴 Red Line: The Opening Range Low. A break below this line signals potential Bearish momentum.
🟢 Green / 🔴 Red Zones (Boxes): These are Order Blocks.
🟢 Green Zone: A Bullish Order Block (Demand). Expect price to potentially bounce up from here.
🔴 Red Zone: A Bearish Order Block (Supply). Expect price to potentially reject down from here.
⚪ Dots (Trailing Stop):
🟢 Green Dots: These appear below price during a Bullish trend. They represent your suggested Stop Loss.
🔴 Red Dots: These appear above price during a Bearish trend.
🏷️ Buy / Sell Labels:
BUY: Triggers when Price breaks the Green Line + Trend is Bullish + HTF is Bullish.
SELL: Triggers when Price breaks the Red Line + Trend is Bearish + HTF is Bearish.
Settings
Session: Customizable RTH (Regular Trading Hours) to filter out pre-market noise.
Matrix Timeframes: 5 fixed slots to choose which timeframes you want to monitor.
Order Blocks: Adjust the sensitivity and lookback period for Order Block detection.
Risk: Customize the ATR multiplier for the trailing stop.
Disclaimer
This tool is for educational purposes only. Past performance does not guarantee future results. Always manage your risk properly.
Vwapstrategy

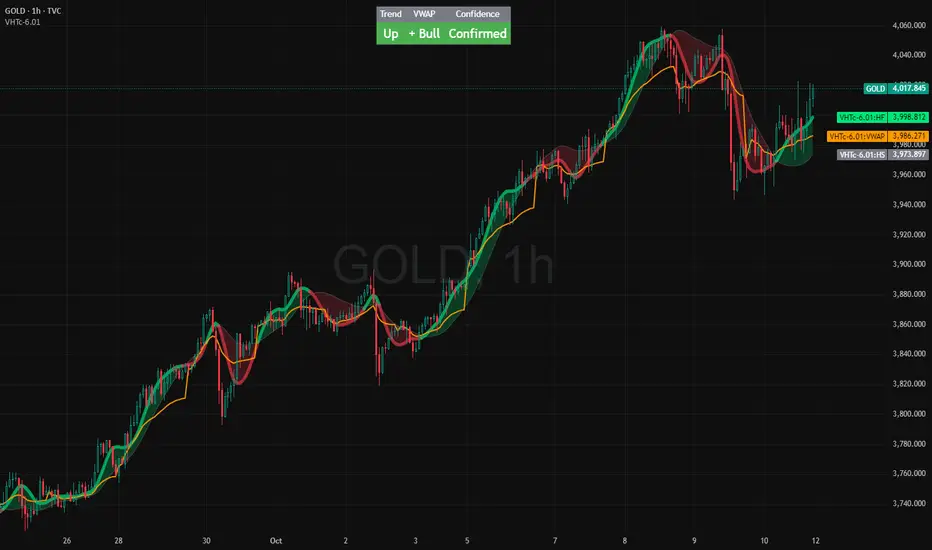
VWAP HMA Trends
It visually syncs Trend, VWAP, and Confidence — giving you instant clarity to trade with calm precision.
⚙️ The Three Core Gauges:
1. 📈 Trend Green for up, Red for down (Trend: Confirms direction)
2. 💰 VWAP Price vs. Volume Weighted Average Price. Institutional Fair Value. (Bull or Bear)
3. 🎯 Confidence Agreement between trend & VWAP. Dont fight the trend.
Bonus Feature: Confidence Turns 🟢 Confident when aligned, 🟡 Cautious when mixed.
Together, these create a clean, visual readout of the market’s health.
🧩 How to Use
Watch the Color Flow:
🟢 Green Cloud → Buyers in control.
🔴 Red Cloud → Sellers in control.
Check VWAP (Orange Line):
Price above VWAP → bullish strength.
Price below VWAP → bearish control.
Hovering at VWAP → indecision. Wait.
---
Act With Discipline:
Trade only when all gauges agree.
Add size only in Confident conditions.
Trim or tighten stops when it shifts to Cautious.
⚡ Quick Reference:
🟢 Green cloud + above VWAP + Confident | Uptrend continuation | Favor long bias
🔴 Red cloud + below VWAP + Confident | Downtrend continuation | Favor short bias
Mixed colors or Cautious: Wait or scale back
Cloud flips color: Possible shift. Reassess bias next bar
⚖️ Disclaimer: Educational and informational use only. Not financial advice. Always use independent judgment and position sizing.
Institutional Session VWAP Bands (Zeiierman)█ Overview
Institutional Session VWAP Bands (Zeiierman) plots a clean, session-aware VWAP that restarts at the “True Close” (end of the first trading hour) for each session you enable (Sydney, Tokyo, London, New York). From that anchor, the script computes a classic volume-weighted average price plus optional standard-deviation bands to frame session fair value and dispersion.
By aligning VWAP to when institutional flows settle (the first hour), you get a reference that matches real execution behavior, yielding more credible pullbacks, retests, and mean-reversion reads inside each session.
█ How It Works
⚪ Session Detection
You choose the sessions (on/off), their UTC-aligned time windows, and colors. The script detects when each session is active on your chart timeframe.
⚪ True-Close Anchoring
At session open the indicator waits. When the first hour completes, it flips the anchor on and starts a fresh VWAP for that session, mirroring how many desks treat the first hour as the real close for the prior day’s positioning.
⚪ VWAP Core
From the true-close anchor, VWAP is calculated in the standard way: cumulative (price × volume) / cumulative volume using your chosen price source (default hlc3).
⚪ VWAP Bands (σ)
Upper/Lower bands are built using a running standard deviation of the price source since the anchor. You control the σ multiplier and line width, and you can optionally fill between the bands.
█ Why Sessions + True-Close Anchoring
⚪ Institutional Timing Matters
A new anchor at the first-hour close reflects where real flows have settled, giving you a session fair-value line that aligns with how many funds evaluate prices intraday.
⚪ Cleaner Session Reads
Because VWAP and σ-bands restart each session, your retests, squeezes, and mean-reversion signals are based on today’s order-flow context, not yesterday’s inertia.
Result: a session-true fair-value with dispersion bands that stay close to the action, improving the quality of pullback entries and risk framing.
█ How to Use
⚪ Session Fair-Value Guide
Treat VWAP as the magnet for intraday value. Impulsive moves away from VWAP that fold back often present retest opportunities.
⚪ σ-Band Reversion & Breaks
Reversion: Tests beyond the upper/lower band that snap back inside can flag exhaustion.
Trend: Price riding the VWAP band in a strong trend
⚪ Session Handoffs
When one session hands to the next, watch how price behaves around the new session’s VWAP Bands after its anchor triggers. Continuation through the new VWAP vs. rejection often sets the tone.
█ Settings
UTC: Choose the timezone used to evaluate session windows (e.g., UTC+2).
Sessions (Sydney, Tokyo, London, New York): Toggle visibility and define each HHMM-HHMM window.
VWAP Price: Source for weighting.
Band Multiplier (σ): Standard deviation multiplier.
█ Related publications
True Close – Institutional Trading Sessions (Zeiierman)
-----------------
Disclaimer
The content provided in my scripts, indicators, ideas, algorithms, and systems is for educational and informational purposes only. It does not constitute financial advice, investment recommendations, or a solicitation to buy or sell any financial instruments. I will not accept liability for any loss or damage, including without limitation any loss of profit, which may arise directly or indirectly from the use of or reliance on such information.
All investments involve risk, and the past performance of a security, industry, sector, market, financial product, trading strategy, backtest, or individual's trading does not guarantee future results or returns. Investors are fully responsible for any investment decisions they make. Such decisions should be based solely on an evaluation of their financial circumstances, investment objectives, risk tolerance, and liquidity needs.

Frozen 4H VWAP – Precision AnchoredFrozen 4H VWAP – Precision Anchored Like Ice
The Frozen 4H VWAP – Precision Anchored delivers a clean, stable, and reliable view of the 4-hour Volume Weighted Average Price, designed for traders who want higher timeframe insights without intrabar noise or repainting.
🔹 Key Features:
Non-Repainting: VWAP value is “frozen” at the close of each 4H candle — no mid-bar updates or flickering.
4H Timeframe Anchoring: Seamlessly pulls 4-hour VWAP values into any timeframe you’re trading on.
Clear Trend Reference: Updates only when a new 4H candle begins, acting as a trustworthy anchor for support/resistance.
Custom Source Option: Choose from different price sources (default: HLC3) to fit your strategy.
Whether you're scalping, day trading, or swing trading, this indicator gives you a powerful edge by grounding your decisions in higher timeframe VWAP data — clear, calm, and frozen in time.

Volume Spikes + Daily VWAP SD BandsVolume Spikes + Daily VWAP SD Bands
This indicator combines volume spike detection to help traders identify potential absorption zones with daily VWAP and standard deviation bands , key price levels, continuation opportunities, and possible institutional bias.
Features:
Volume Spike Detection
Highlights candles with unusually high volume relative to a configurable SMA.
Optional filters:
Local highs/lows only (Only Use Valid Highs & Lows)
Candle shapes: Hammer / Shooter only
Candle color match: bullish spikes on green, bearish on red
Plots small circles above/below bars for bullish and bearish volume spikes.
Alerts available for both bullish and bearish spikes.
Interpretation: Volume spikes at local highs/lows can indicate absorption, where one side absorbs aggressive buying/selling pressure.
Daily VWAP
Calculates volume-weighted average price (VWAP) for the current day.
Optionally shows previous day’s VWAP for reference.
Plot lines are customizable with optional circles on lines for visual clarity.
Labels on the last bar show exact VWAP values.
Institutional Bias Insight: Price above both current and previous VWAPs may indicate bullish positioning; price below both VWAPs may indicate bearish positioning. Many professional traders consider this a clue to institutional bias, but it’s not guaranteed. Always confirm with volume, delta, or orderflow analysis.
Standard Deviation Bands
Optional x1 and x2 SD bands around the daily VWAP.
Visual fill between bands shows price volatility zones.
Can be used to identify potential support/resistance or absorption zones.
Use Case: Price bounces off first SD band may indicate continuation signals, especially when volume spikes occur at those levels.
Customizable Visuals
Colors for bullish and bearish volume spikes
VWAP and SD band colors and thickness
Optional circles and filled bands for better readability
Alerts
Bullish / Bearish Volume Spikes
Supports TradingView alert system for automated notifications
Advanced Use Cases:
Combine with Cumulative Delta or Orderflow tools to confirm true absorption zones.
Identify high-volume rejection candles signaling possible trend continuation.
Use VWAP positioning relative to price to assess potential institutional bias, keeping in mind it is probabilistic, not guaranteed.
Visualize intraday VWAP levels and volatility with SD bands for better trade timing.
Settings: Fully customizable, including volume multiplier, SMA length, session filter, candle shape, color options, and VWAP/SD display preferences.

Dynamic Swing Anchored VWAP (Zeiierman)█ Overview
Dynamic Swing Anchored VWAP (Zeiierman) is a price–volume tool that anchors VWAP at fresh swing highs/lows and then adapts its responsiveness as conditions change. Instead of one static VWAP that drifts away over time, this indicator re-anchors at meaningful structure points (swings). It computes a decayed, volume-weighted average that can speed up in volatile markets and slow down during quiet periods.
Blending swing structure with an adaptive VWAP engine creates a fair-value path that stays aligned with current price behavior, making retests, pullbacks, and mean reversion opportunities easier to spot and trade.
█ How It Works
⚪ Swing Anchor Engine
The script scans for swing highs/lows using your Swing Period.
When market direction flips (new pivot confirmed), the indicator anchors a new VWAP at that pivot and starts tracking from there.
⚪ Adaptive VWAP Core
From each anchor , VWAP is computed using a decay model (recent price×volume matters more; older data matters less).
Adaptive Price Tracking lets you set the base responsiveness in “bars.” Lower = more reactive, higher = smoother.
Volatility Adjustment (ATR vs Avg ATR) can automatically speed up the VWAP during spikes and slow it during compression, so the line stays relevant to live conditions.
█ Why This Adaptive Approach Beats a Simple VWAP
Standard VWAP is cumulative from the anchor point. As time passes and volume accumulates, it often drifts far from current price, especially in prolonged trends or multi-session moves. That drift makes retests rare and unreliable.
Dynamic Swing Anchored VWAP solves this in two ways:
⚪ Event-Driven Anchoring (Swings):
By restarting at fresh swing highs/lows, the VWAP reference reflects today’s structure. You get frequent, meaningful retests because the anchor stays near the action.
⚪ Adaptive Responsiveness (Volatility-Aware):
Markets don’t move at one speed. When volatility expands, a fixed VWAP lags; when volatility contracts, it can overreact to noise. Here, the “tracking speed” can auto-adjust using ATR vs its average.
High Volatility → faster tracking: VWAP hugs price more tightly, preserving retest relevance.
Low Volatility → smoother tracking: VWAP filters chop and stays stable.
Result: A VWAP that follows price more accurately, creating plenty of credible retest opportunities and more trustworthy mean-reversion/continuation reads than a simple, ever-growing VWAP.
█ How to Use
⚪ S wing-Aware Fair Value
Use the VWAP as a dynamic fair-value guide that restarts at key structural pivots. Pullbacks to the VWAP after impulsive moves often provide retest entries.
⚪ Trend Trading
In trends, the adaptive VWAP will ride closer to price, offering continuation pullbacks.
█ Settings
Swing Period: Number of bars to confirm swing highs/lows. Larger = bigger, cleaner pivots (slower); smaller = more frequent pivots (noisier).
Adaptive Price Tracking: Sets the base reaction speed (in bars). Lower = faster, tighter to price; higher = smoother, slower.
Adapt APT by ATR ratio: When ON, the tracking speed auto-adjusts with market volatility (ATR vs its own average). High vol → faster; low vol → calmer.
Volatility Bias: Controls how strongly volatility affects the speed. >1 = stronger effect; <1 = lighter touch.
-----------------
Disclaimer
The content provided in my scripts, indicators, ideas, algorithms, and systems is for educational and informational purposes only. It does not constitute financial advice, investment recommendations, or a solicitation to buy or sell any financial instruments. I will not accept liability for any loss or damage, including without limitation any loss of profit, which may arise directly or indirectly from the use of or reliance on such information.
All investments involve risk, and the past performance of a security, industry, sector, market, financial product, trading strategy, backtest, or individual's trading does not guarantee future results or returns. Investors are fully responsible for any investment decisions they make. Such decisions should be based solely on an evaluation of their financial circumstances, investment objectives, risk tolerance, and liquidity needs.

Swing Anchored Vwap [BigBeluga]🔵 OVERVIEW
Swing Anchored Vwap tracks the market’s directional behavior by anchoring VWAPs (Volume Weighted Average Price) to dynamically detected swing highs and lows. It visually distinguishes the active swing VWAP from historical ones—offering traders a clean view of trend-aligned value zones with clearly marked inflection points.
🔵 CONCEPTS
Swing Anchored VWAPs: VWAPs are initiated from recent swing highs during downtrends and swing lows during uptrends.
Trend Detection: The indicator identifies trend shifts based on the breaking of recent highest or lowest price value.
Trend-Based Coloring:
• Green VWAPs: are drawn from swing lows in uptrends.
• Blue VWAPs: are drawn from swing highs in downtrends.
Sensitivity Control: The Length input defines how far back the script looks to determine swing points—shorter lengths make it more reactive.
🔵 FEATURES
Real-time VWAP projection from the current swing point, updated live.
Historical VWAP traces with slightly faded color to emphasize the current active one.
Swing markers automatically placed on highs/lows where VWAPs are anchored.
Label with price value at the end of each active VWAP line for clarity.
Adaptive color scheme that visually separates uptrend/downtrend zones.
🔵 HOW TO USE
Use active VWAP as a dynamic support/resistance guide during ongoing trends.
Observe breaks or rejections around these VWAPs for trend continuation or reversal clues .
Compare current price position relative to swing VWAPs to assess trend maturity and extension .
Combine with volume analysis or structure to increase conviction at swing points.
🔵 CONCLUSION
Swing Anchored Vwap merges the logic of anchored VWAPs and swing structure into a responsive visual tool. It helps traders stay aligned with the current trend while offering historical context via previous value anchors—ideal for intraday to swing-level analysis.

VWAP Volume Profile [BigBeluga]🔵 OVERVIEW
VWAP Volume Profile is an advanced hybrid of the VWAP and volume profile concepts. It visualizes how volume accumulates relative to VWAP movement—separating rising (+VWAP) and declining (−VWAP) activity into two mirrored horizontal profiles. It highlights the dominant price bins (POCs) where volume peaked during each directional phase, helping traders spot hidden accumulation or distribution zones.
🔵 CONCEPTS
VWAP-Driven Profiling: Unlike standard volume profiles, this tool segments volume based on VWAP movement—accumulating positive or negative volume depending on VWAP slope.
Dual-Sided Profiles: Profiles expand horizontally to the right of price. Separate bins show rising (+) and falling (−) VWAP volume.
Bin Logic: Volume is accumulated into defined horizontal bins based on VWAP’s position relative to price ranges.
Gradient Coloring: Volume bars are colored with a dynamic gradient to emphasize intensity and direction.
POC Highlighting: The highest-volume bin in each profile type (+/-) is marked with a transparent box and label.
Contextual VWAP Line: VWAP is plotted and dynamically colored (green = rising, orange = falling) for instant trend context.
Candle Overlay: Price candles are recolored to match the VWAP slope for full visual integration.
🔵 FEATURES
Dual-sided horizontal volume profiles based on VWAP slope.
Supports rising VWAP , falling VWAP , or both simultaneously.
Customizable number of bins and lookback period.
Dynamically colored VWAP line to show rising/falling bias.
POC detection and labeling with volume values for +VWAP and −VWAP.
Candlesticks are recolored to match VWAP bias for intuitive momentum tracking.
Optional background boxes with customizable styling.
Adaptive volume scaling to normalize bar length across markets.
🔵 HOW TO USE
Use POC zones to identify high-volume consolidation areas and potential support/resistance levels.
Watch for shifts in VWAP direction and observe how volume builds differently during uptrends and downtrends.
Use the gradient profile shape to detect accumulation (widening volume below price) or distribution (above price).
Use candle coloring for real-time confirmation of VWAP bias.
Adjust the profile period or bin count to fit your trading style (e.g., intraday scalping or swing trading).
🔵 CONCLUSION
VWAP Volume Profile merges two essential concepts—volume and VWAP—into a single, high-precision tool. By visualizing how volume behaves in relation to VWAP movement, it uncovers hidden dynamics often missed by traditional profiles. Perfect for intraday and swing traders who want a more nuanced read on market structure, trend strength, and volume flow.

Sniper Mini VWAPThis script plots dynamic, session-based VWAPs for key intraday timeframes:
1H (green), 4H (orange), 8H (purple), and Daily (red).
Each VWAP resets at the start of its own session, giving traders a real-time view of price relative to average volume-weighted value. These lines often act as intraday support, resistance, or liquidity magnets — great for scalping, fade setups, and sniper-style entries.
You can toggle each VWAP on or off for a cleaner chart.
This version does not use anchored VWAPs — it’s designed for traders who need fast feedback as price develops within active sessions.

2-Day Volume Weighted Average Price (VWAP)This indicator extends TradingView’s built-in VWAP by calculating a volume-weighted average price over a continuous two-day window (yesterday + today), anchoring VWAP at the start of yesterday’s session and carrying it through to today’s close, but only plotting the segment that falls within the current trading session—yesterday’s data feeds into the calculation to ensure today’s VWAP reflects the prior session’s volume and price action, while the line drawn on your chart always begins at today’s session open.
Standard Deviation Bands: Optional ±1σ, ±2σ, and ±3σ envelopes, exactly as in the default VWAP, but based on the rolling two-day data.

ZenAlgo - LevelsThis script combines multiple anchored Volume-Weighted Average Price (VWAP) calculations into a single tool, providing a continuous record of past VWAP levels and highlighting when price has tested them. Typically, VWAP indicators show only the current VWAP for a single anchor period, requiring you to either keep re-anchoring manually or juggle multiple instances of different VWAP tools for each timeframe. By contrast, this script automatically tracks both the ongoing VWAP and previously completed VWAP values, along with real-time detection of “tests” (when price crosses a particular VWAP level). It’s especially valuable for traders who want to see how price has interacted with VWAP over several sessions, weeks, or months—without switching between separate indicators or manually setting anchors.
Below is a comprehensive explanation of each component, why multiple VWAP lines working together can be more informative than a single line, and how to adjust the script for various markets and trading styles:
Primary VWAP vs. Historical VWAP Lines - Standard VWAP indicators typically focus on the current line only. This script also calculates a primary VWAP, but it “locks in” each completed VWAP value when a new time anchor is detected (e.g., new weekly bar, new monthly bar, new session). As a result, you retain an ongoing history of VWAP lines for every completed anchored period. This is more powerful than manually setting up multiple VWAP tools—one for each desired timeframe—because everything is handled in a single script. You avoid chart clutter and the risk of forgetting to reset your manual VWAP at the correct bar.
Why Combine Multiple Anchored VWAP Lines in One Script? - Viewing several anchored VWAP lines together offers synergy . You see not only the current VWAP but also previous ones from different sessions or months, all within the same chart pane. This synergy becomes apparent if multiple historical VWAP lines cluster near the same price level, indicating a potentially significant zone of volume-based support or resistance. Handling this manually would involve repeatedly setting separate VWAP indicators, each reset at specific points, which is time-consuming and prone to error. In this script, the process is automated: as soon as the anchor changes, a completed VWAP line is stored so you can observe how price eventually reacts to it, repeatedly or not at all.
Automated “Test” Detection - Once a historical VWAP line is set, the script tracks when price crosses it in subsequent bars. If the high and low of a bar span that line, the script marks it in red (both the line and its label). It also keeps a counter of how many times each line has been tested. This method goes beyond a simple visual approach by quantifying the retests. Because all these lines are created and managed in one place, you don’t have to manually label the lines or check them one by one.
Advantages Over Manually Setting Multiple VWAPs
You save screen space: Instead of layering several VWAP indicators, each with unique settings, this single script plots them all on one overlay.
Automation: When a new anchor period begins, the script “closes out” the old VWAP and starts a new one. You never need to remember to reset it manually.
Retest Visualization: The script not only draws each line but also changes color and updates the label automatically if a line gets tested. Doing this by hand would be labor-intensive.
Unified Parameters: All settings (e.g., array size, max distance, test count limit) apply uniformly. You can manage them from one place, instead of configuring multiple separate tools.
Extended Insight with Multiple VWAP Lines
Since VWAP reflects the volume-weighted average price for each chosen period, historical lines can show zones where the market had a fair-value consensus in previous intervals. When the script preserves these lines, you see potential support/resistance areas more distinctly. If, for instance, price continually pivots around an old VWAP line, that may reveal a strong volume-based level. With several older VWAP lines on the chart, you gain an immediate sense of where these volume-derived averages have appeared and how price reacted over time. This wider perspective often proves more revealing than a single “current” VWAP line that does not reflect previous anchor sessions.
Handling of Illiquid Markets and Volume Limitations
VWAP is inherently tied to volume data, so its reliability decreases if volume reporting is missing or if the asset trades with very low liquidity. In such cases, a single large trade might momentarily skew the VWAP, resulting in “false” test signals when the high/low range intersects an abnormal price swing. If you suspect the data is incomplete or the market is unusually thin, it’s wise to confirm the validity of these VWAP lines before using them for any decision-making. Additionally, unusual market conditions—like after-hours trading or sudden high-volatility events—may cause VWAP to shift quickly, setting up multiple lines in a short time.
Key User-Configurable Settings
Hide VWAP on Day timeframe and above : Lets you disable the primary VWAP plot on daily or higher timeframes for a cleaner view.
Anchor Period : Select from Session, Week, Month, Quarter, Year, Decade or Century. Controls how frequently the script resets and preserves the VWAP line.
Offset : Moves the current VWAP line by a specified number of bars if you need a shifted perspective.
Max Array Size : Caps how many past VWAP lines the script will remember. Prevents clutter if you’re charting very long histories.
Max Distance : Defines how far back (in bar index units) a line is kept. If a line’s start bar is older than this threshold, it’s removed, keeping the chart uncluttered.
Max Red Labels : Limits the number of tested (red) VWAP lines that appear. If price tests a large number of old lines, only the newest red labels remain once you hit the set limit.
Workflow Overview
As soon as a new anchor period begins (e.g., a new weekly candle if “Week” is chosen), the script ends the current VWAP and stores that final value in its internal arrays.
It creates a dotted line and label representing the completed VWAP, and keeps track of whether it has been tested or not.
Subsequent bars may then cross that line. If a bar’s high/low includes the line’s value, it’s flagged as tested, labeled red, and a test counter increases.
As new anchored periods come, old lines remain visible—unless they fall outside your maxDistance or you exceed the maximum stored line count.
Real-World Benefits
Combining multiple VWAP lines—ranging, for example, from session-based lines for intraday perspectives to monthly or quarterly lines for broader context—provides a layered view of the volume-based fair price. This can help you quickly spot zones where price repeatedly intersects old VWAPs, potentially highlighting where bulls or bears took action historically. Because this script automates the management of all these lines and flags their retests, it removes a great deal of repetitive manual work that would typically accompany multiple, separate VWAP indicators set to different anchors.
Limitations & Practical Use
As with any volume-related tool, the script depends on reliable volume data. Assets trading on smaller venues or during illiquid periods may produce spurious signals. The script does not signal buy or sell decisions; rather, it helps visually map out where volume-weighted averages from previous periods might still be relevant to market behavior. Always combine the insight from these historical VWAP lines with your existing analytical approach or other technical and fundamental tools you use.
Conclusion
This script unifies past and present VWAP lines into one overlay, automatically detecting new anchor resets, storing the final VWAP values, and indicating whenever old lines are retested by price. It offers synergy through the simultaneous display of multiple historical VWAP lines, making it quicker and easier to detect potential support/resistance zones and better reflect changing market volumes over time. You no longer need to manually create, configure, or reset multiple VWAP indicators. Instead, the script handles all aspects of line creation, retest detection, and clutter management, giving you a robust framework to observe how historical VWAP data aligns with current price action.
By understanding the significance of multiple anchored VWAP lines, you can assess market structure from multiple angles in a single view. As always, ensure you confirm the reliability of the volume data for your particular asset and use these lines in conjunction with other analyses to form a well-rounded perspective on current market behavior.

Multi-Timeframe VWAP Master ProThe Multi-Timeframe VWAP Suite is a comprehensive and highly customizable indicator designed for traders who rely on Volume-Weighted Average Price (VWAP) across multiple timeframes and periods. This tool provides a complete suite of VWAP calculations, including daily, weekly, monthly, quarterly, yearly, and custom VWAPs, allowing traders to analyze price action and volume trends with precision. Whether you're a day trader, swing trader, or long-term investor, this indicator offers unparalleled flexibility and depth for your trading strategy.
Multi-Timeframe VWAPs:
Daily, Weekly, Monthly, Quarterly, and Yearly VWAPs: Track VWAP across various timeframes to identify key support and resistance levels.
Customizable Timeframes: Use the SMA timeframe input to adjust the period for moving averages and other calculations.
Previous Period VWAPs:
Previous Daily, Weekly, Monthly, and Quarterly VWAPs: Analyze historical VWAP levels to understand past price behavior and identify potential reversal zones.
Previous Year Quarterly VWAPs: Compare current price action to VWAP levels from specific quarters of the previous year.
Custom VWAPs:
Custom Start Date and Timeframe: Define your own VWAP periods by specifying a start date and timeframe, allowing for tailored analysis.
Dynamic Custom VWAP Calculation: Automatically calculates VWAP based on your custom inputs, ensuring flexibility for unique trading strategies.
Seasonal and Yearly VWAPs:
April, July, and October VWAPs: Analyze seasonal trends by tracking VWAP levels for specific months.
Yearly VWAP: Get a broader perspective on long-term price trends with the yearly VWAP.
SMA Integration:
SMA Overlay: Combine VWAP analysis with a Simple Moving Average (SMA) for additional confirmation of trends and reversals.
Customizable SMA Length and Timeframe: Adjust the SMA settings to match your trading style and preferences.
User-Friendly Customization:
Toggle Visibility and Labels: Easily enable or disable the display of specific VWAPs and their labels to keep your chart clean and focused.
Color Customization: Each VWAP line and label is color-coded for easy identification and can be customized to suit your preferences.
Dynamic Labeling:
Automatic Labels: Labels are dynamically placed on the last bar, providing clear and concise information about each VWAP level.
Customizable Label Text: Labels include detailed information, such as the timeframe or custom period, for quick reference.
Flexible Timeframe Detection:
Automatic Timeframe Detection: The indicator automatically detects new days, weeks, months, and quarters, ensuring accurate VWAP calculations.
Support for Intraday and Higher Timeframes: Works seamlessly on all chart timeframes, from 1-minute to monthly charts.
Previous Year Quarterly VWAPs:
Q1, Q2, Q3, Q4 VWAPs: Compare current price action to VWAP levels from specific quarters of the previous year.
User-Selectable Year: Choose the year for which you want to calculate previous quarterly VWAPs.
Persistent Monthly VWAPs:
Option to Persist Monthly VWAPs Year-Round: Keep monthly VWAP levels visible even after the month ends for ongoing analysis.
Comprehensive Analysis: Combines multiple VWAP timeframes and periods into a single tool, eliminating the need for multiple indicators.
Customizable and Flexible: Tailor the indicator to your specific trading strategy with customizable timeframes, periods, and settings.
Enhanced Decision-Making: Gain deeper insights into price action and volume trends across different timeframes, helping you make more informed trading decisions.
Clean and Organized Charts: Toggle visibility and labels to keep your chart clutter-free while still accessing all the information you need.
Ideal For:
Day Traders: Use daily and intraday VWAPs to identify intraday support and resistance levels.
Swing Traders: Analyze weekly and monthly VWAPs to spot medium-term trends and reversals.
Long-Term Investors: Leverage quarterly and yearly VWAPs to understand long-term price behavior and key levels.
Seasonal Traders: Track April, July, and October VWAPs to capitalize on seasonal trends.
The Multi-Timeframe VWAP Suite is a powerful and versatile tool for traders of all styles and timeframes. With its comprehensive suite of VWAP calculations, customizable settings, and user-friendly design, it provides everything you need to analyze price action and volume trends with precision and confidence. Whether you're looking to fine-tune your intraday strategy or gain a broader perspective on long-term trends, this indicator has you covered.

VWAP with RSIVWAP with RSI Indicator
Overview
The VWAP with RSI Indicator is a powerful tool that combines the Volume Weighted Average Price (VWAP) with the Relative Strength Index (RSI) to provide traders with comprehensive insights into price trends, volume-weighted price levels, and market momentum. This dual-indicator setup enhances your trading strategy by offering a clearer understanding of the market conditions, potential entry and exit points, and trend reversals.
Key Features
VWAP (Volume Weighted Average Price):
Calculation: The VWAP is calculated using the high, low, and close prices, weighted by trading volume over a specified period.
Purpose: VWAP provides an average price that reflects the trading volume at different price levels, helping traders identify the true average price over a given period.
Visualization: The VWAP line is plotted in blue on the price chart, indicating the volume-weighted average price.
RSI (Relative Strength Index):
Calculation: RSI is based on the average gains and losses over a specified period (default is 14 periods) and ranges from 0 to 100.
Purpose: RSI measures the speed and change of price movements, identifying overbought or oversold conditions in the market.
Overbought/Oversold Levels:
Overbought: RSI above 70 (red line).
Oversold: RSI below 30 (green line).
Midline: RSI at 50 (gray dashed line).
Visualization: The RSI line changes color based on its value (purple for normal, red for overbought, green for oversold) and is plotted below the price chart.
Background Fill for RSI:
Overbought Area: Shaded red when RSI is above 70.
Oversold Area: Shaded green when RSI is below 30.
Bullish and Bearish Divergence Detection:
Bullish Divergence: Occurs when price forms a lower low, but RSI forms a higher low, indicating potential upward reversal.
Visualization: Bullish divergence points are marked with a green line and labeled "Bull."
Bearish Divergence: Occurs when price forms a higher high, but RSI forms a lower high, indicating potential downward reversal.
Visualization: Bearish divergence points are marked with a red line and labeled "Bear."
Alerts: Conditions for bullish and bearish divergences trigger alerts.
Settings
VWAP Settings:
hideonDWM: Option to hide VWAP on daily or higher timeframes.
src: Source for VWAP calculation (default is hlc3 - (high + low + close)/3).
offset: Offset for plotting the VWAP.
RSI Settings:
rsiLengthInput: Period length for RSI calculation (default is 14).
rsiSourceInput: Source for RSI calculation (default is close price).
maTypeInput: Type of moving average applied to RSI (options: SMA, EMA).
maLengthInput: Length of the moving average applied to RSI.
How to Use
Trend Identification: Use VWAP to identify the average price level and market trend. If the price is above VWAP, it suggests an uptrend, and if below, it suggests a downtrend.
Overbought/Oversold Conditions: Use RSI to identify potential reversal points. RSI above 70 indicates overbought conditions, and below 30 indicates oversold conditions.
Divergence: Look for bullish or bearish divergences between price and RSI to anticipate potential trend reversals.
Conclusion
By combining VWAP and RSI, this indicator provides a robust framework for analyzing market conditions, identifying trends, and making more informed trading decisions. Enhance your trading strategy today with the VWAP with RSI Indicator!

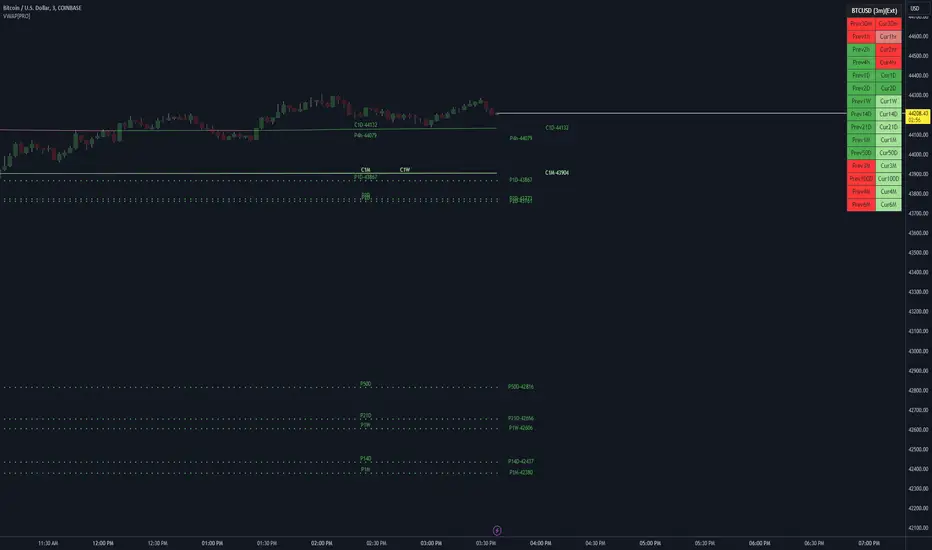
VWAP LEVELS [PRO]32 VWAP levels with labels and a table to help you identify quickly where current price is in relation to your favorite VWAP pivot levels. To help reduce cognitive load, 4 colors are used to show you where price is in relation to a VWAP level as well as the strength of that respective level. Ultimately, VWAP can be an invaluable source of support and resistance; in other words you'll often see price bounce off of a level (whether price is increasing or decreasing) once or multiple times and that could be an indication of a price's direction. Another way that you could utilize this indicator is to use it in confluence with other popular signals, such as an EMA crossover. Many traders will wait till a bar's close on the 5m or 10m time frame above a VWAP level (developing 1D VWAP would be a popular choice) before making a decision on a potential trade especially if price is rising above the 1D VWAP *and* there's been a recent 100 EMA cross UP of the 200 EMA. These are 2 bullish signals that you could look for before possibly entering in to a trade.
I've made this indicator extremely customizable:
⚡Each VWAP level has 2 labels: 1 "at level" and 1 "at right", each label and price can be disabled
⚡Each VWAP label has its own input for label padding. The "at right" label padding input allows you to zoom in and out of a chart without the labels moving along their respective axis. However, the "at level" label padding input doesn't work the same way once you move the label out of the "0" input. The label will move slightly when you zoom in and out
⚡Both "current" and "previous" VWAP levels have their own plot style that can be changed from circles, crosses and lines
⚡Significant figures input allows you to round a price up or down
⚡A price line that allows you to identify where price is in relation to a VWAP level
⚡A table that's color coded the same way as the labels. The labels and table cells change to 1 of 4 colors when "OC Check Mode" is enabled. This theory examines if the VWAP from the Open is above or below the VWAP from Close and if price is above or below normal VWAP (HLC3). This way we have 4 states:
Red = Strong Downtrend
Light Red = Weak Downtrend
Light = Weak Uptrend
Green = Strong Uptrend
Something to keep in mind: At the start of a new year, week or month, some levels will converge and they'll eventually diverge slowly or quickly depending on the level and/or time frame. You could add a few labels "at level" to show which levels are converging at the time. Since we're at the beginning of a new year, you'll see current month, 2 month, 3 month etc converge in to one level.
🙏Thanks to (c)MartinWeb for the inspiration behind this indicator.
🙏Thanks to (c)SimpleCryptoLife for the libraries and code to help create the labels.