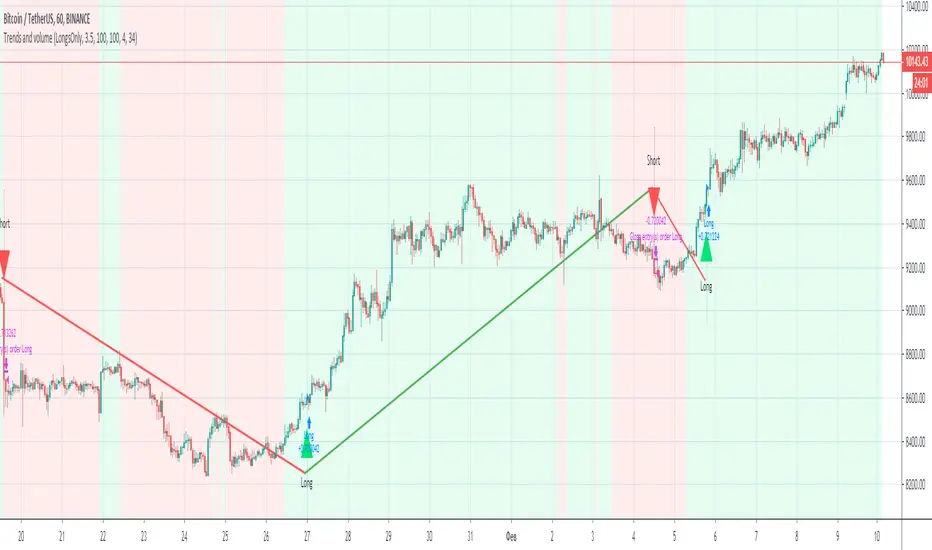
Trends and volume“Trends and volume” is a pair of ZigZag and Volume indicators. If in the ZigZag indicator a trend has changed from descending to ascending, and in the Volume indicator the volume of purchases (accumulation) exceeds the volume of sales (distribution), a signal to open a long position occurs.
Accordingly, the opening of a short position occurs with opposite indicators of trend and volume. The strategy has Volume smoothing settings and a ZigZag filter for selecting optimal settings on other instruments.
With default settings, the strategy allows you to make 2-4 successful trades per month, ideally shows the direction of the trades on the BINANCE:BTCUSDT , timeframe 1 hour.
Together with the “Trends and volume” backtest, you get the “Trends and volume alerts” indicator in which the alert function is built-in, you can set an alert for events: long entry and short entry.
Pay attention when you set alerts in the tradingview in the indicator, the true signal comes at the close of the hourly candle.
I can open demo access to the Trends and volume strategy for 15 days, for this write me.
Analyse basée sur les vagues
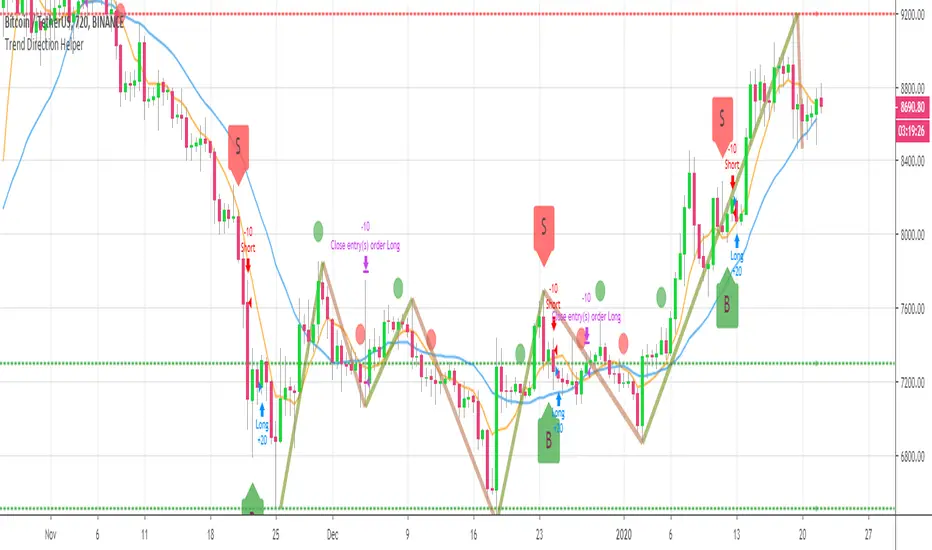
BEST Trend Direction Helper (Strategy Edition)Hello traders
A follower asked me to convert my Trend Direction Helper into a strategy
So blessed this indicator reached the 1400+ likes milestone - I can't believe how many people are trading with it
I based the setup as follow:
- Entries on those green/red labels
- exit whenever a Simple Moving Averages cross in the opposite direction happen
- possibility to filter only Longs/Shorts or both
Also...
The strategy includes the Zig Zag/Pivots high/low and other options from the indicator version. I only added a quick strategy component with a hard exit concept based on SMA cross
All the best fam and... HAPPY NEW YEAR !!!!!!!!!!!
Dave

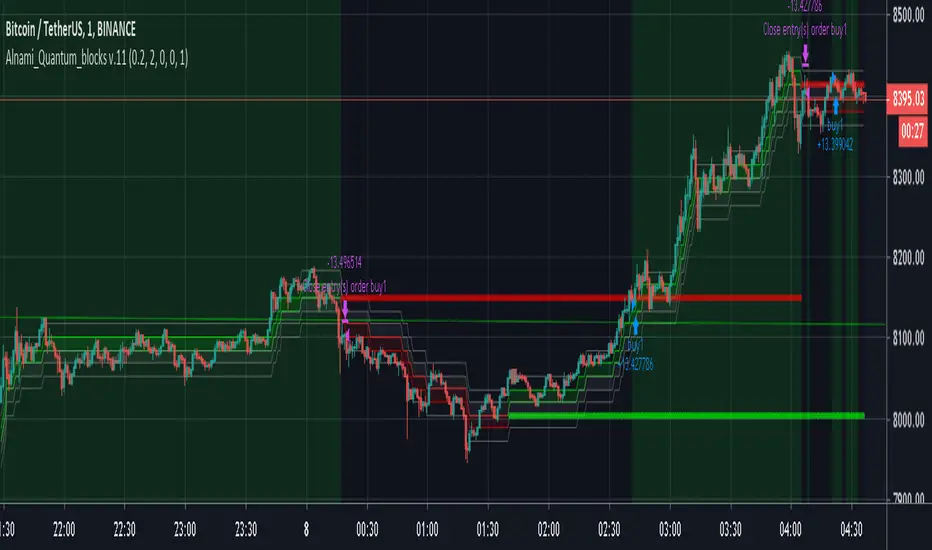
Alnami_Quantum_blocks v.11The (Al Nami Quantum Blocks v.11) script is based on Renko chart that is based on % move of the selected symbol. This is different from the traditional or ATR based Renko charts..
box size = user selected percentage x current price
Alnami Quantum Blocks Channel is composed of 5 levels that are calculated based on the box size:
1- Base
2- Green Box High (GBH) = Base + box size
3- Next Green Box trigger (GBN) = base + (box size x 2)
4- Red Box Low ( RBL ) = Base - box size
5- Next Red Box trigger ( RBN ) = base - (box size x 2)
Those levels will appear in the chart with the following order:
------GBN-------
------GBH-------
------BASE------
------RBL-------
------RBN-------
Usually when prices are trending up, the price will stay above the base for most of the time,, when it trending downwards, price stays below base most of the time..
Now how to time your entries based on the channel?
This strategy draws two levels, breakout level (top red line) and stop level (bottom green line).
If the price is above red line, place a buy order
If the price is below the green line, place a sell order
In version 11 of the Quantum blocks, you can choose to make the those two lines drawn using:
recent/near term price actions (less accurate) and fast - set the number of Legs to low value
or
wider term price actions (more accurate) and slow - set the number of Legs to high value
This version also tracks the last three changes for the red and green lines as following:
1- Above, Above, Above = 3
2- Above, Above, Below = 2
3- Above, Below, Below = 1
4- Below, Below, Below = 0
I did run full optimization for the settings of this strategy on Bitcoin (Binance:BTCUSDT) for the following multiple time frames using Amibroker scrips and data downloaded from Binance through a REST API call. The TFs were for 1min, 15min, 30min, 45min, 90min, 120min, 180min, and 240min.
pair Input Settings
btc TF Profit% Sys DD% Trade DD% sharpe% # Trades Win% Wave% # of Legs up lo
1 204 40.16 15.04 1.33 132 40.15 1.5 4 3 3
15 249 35 14.3 2.96 35 51.43 1.8 3 1 3
30 469 28.95 14.04 3.82 34 67.65 1.4 3 1 3
45 712 54.48 23.3 2.49 46 54.35 1.7 3 3 3
90 1114 40.51 21.41 3.3 48 54.17 1.4 2 3 3
120 602 25.32 16.8 2.82 51 43.14 1.2 2 3 3
180 960 35.9 20.09 3.33 42 52.38 0.9 2 2 3
240 819 46.84 28.27 3.48 46 65.22 0.6 2 3 3
I spent a lot of time and resource in providing the above, If this script/back tests helped in making some profits, then kindly express your appreciation and support to this work by sending some altcoins to any of the following wallets, this will encourage me sharing more stuff with the public:
BTC : 15VLCLZRkEhhZn6E4gNjMLVYnmCcUzKvWU
LTC : LN6mE6aZhEqVVfssmaQ3kk8PPspWQ5wToy
ETH : 0x7901035f2b6f334fa404d0ceb187d7bfcfdb72ce
Peaks ReversalThis is a script request by trader @liquidentourage
This script analyses the market at high or low peaks and uses price action to enter the trade
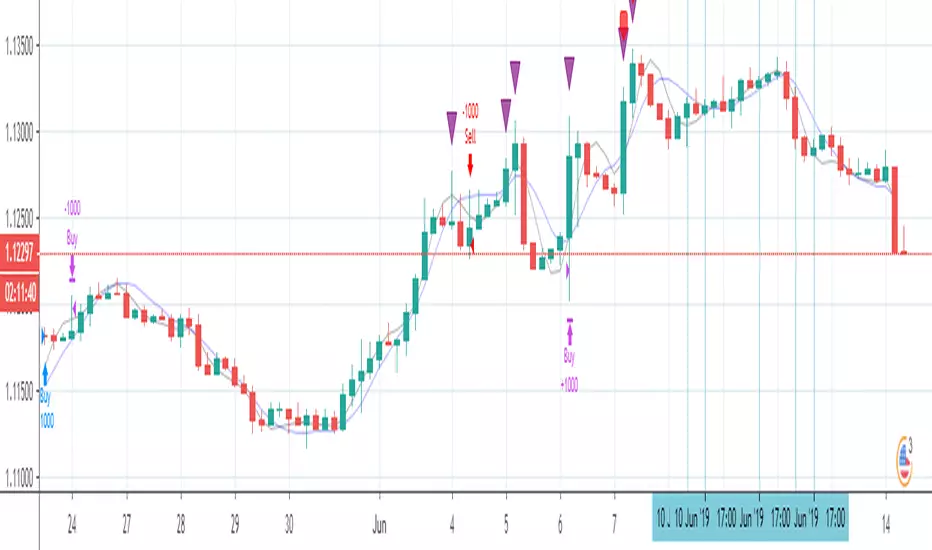
Elliott strategyIt uses Elliott teory to shift two moving averages 8 positions (based on 5-3 fractal), and the crossing is close to reversions. And it keeps an eye on RSI level to be sure it is on hot level to sell/buy

Elliott wave strategy (lirshah)Elliott wave strategy has been written based on Elliott oscillator.
the strategy has good results on crypto pair at H1 time frame..

[STRATEGY][RS]ZigZag PA Strategy V4.1EXPERIMENTAL:
WARNING: this strategy repaints after reloading and results are heavily curve fitted, use at your own discretion.
UPDATE: (AleksanderThor) add option for a 2nd target, to use you need to activate pyramiding with a setting of 1 manually (not possible to change programatically) .
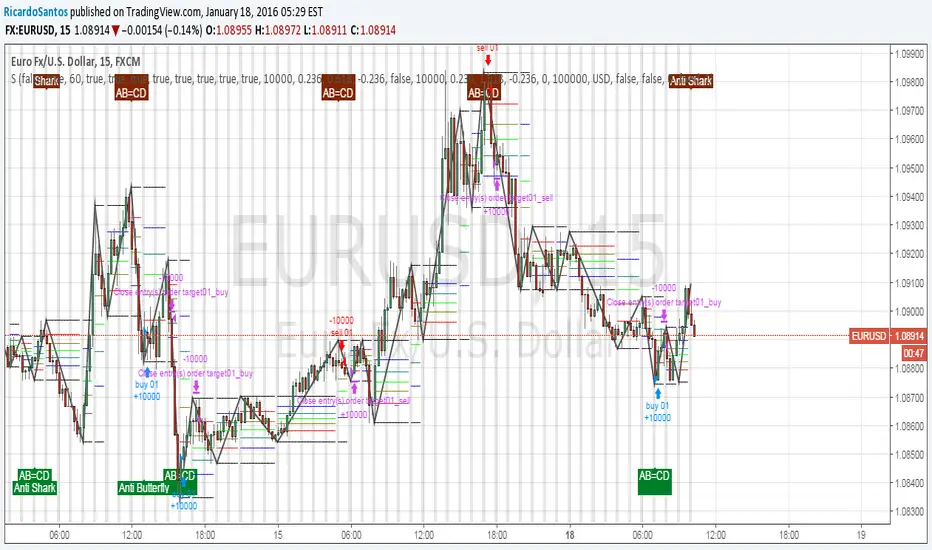
[STRATEGY][RS]ZigZag PA Strategy V4EXPERIMENTAL:
WARNING: highly curve fitted results, if you dont know whats going on stay away.
