XAUUSD Fisher Transform Dashboard — Trend & Momentum InsightsThe script offers an educational visualization of trend and momentum on XAUUSD by combining the Fisher Transform with EMA direction. It plots momentum shifts, trend alignment, and includes a concise dashboard showing trend bias, the latest crossover event, and customizable percentage-based reference markers.
This tool is for market analysis and study purposes only and does not provide trading advice.
Xauusdanalysis

Indian Gold Festival Dates HistoricalIndian Gold Festival Dates (1975-2025)
Marks 8 major Indian festivals associated with gold buying over 50 years of historical data. Essential for analyzing seasonal patterns and cultural demand cycles in gold markets.
Festivals Included:
Dhanteras (Gold) - Most auspicious gold buying day
Diwali (Orange) - Festival of Lights
Akshaya Tritiya (Green) - "Never-ending" prosperity
Dussehra (Red) - Victory and success
Makar Sankranti (Cyan) - Solar new year
Gudi Padwa (Magenta) - Hindu New Year (Maharashtra)
Ugadi (Purple) - Hindu New Year (South India)
Navratri (Yellow) - 9-day festival
Features:
✓ 408 exact historical dates (1975-2025)
✓ Color-coded vertical lines for easy identification
✓ Toggle individual festivals on/off
✓ Adjustable line width and labels
✓ Works on all timeframes (best on daily/weekly)
Perfect for traders analyzing gold seasonality, Indian market sentiment, and cultural demand patterns. Use on XAUUSD, GC1!, or Indian gold futures.

AutoFib Breakout Strategy for Uptrend AssetsThis trading strategy is designed to help you catch powerful upward moves on assets that are in a long-term uptrend, such as Gold (XAUUSD). It uses a popular technical tool called the Fibonacci Extension, combined with a trend filter and a risk-managed exit system.
✅ When to Use This Strategy
• Works best on higher timeframes: Daily (1D), 3-Day (3D), or Weekly (W).
• Best used on uptrending assets like Gold.
• Designed for swing trading – holding trades from a few days to weeks.
📊 How It Works
1. Find the Trend
We only want to trade in the direction of the trend.
• The strategy uses the 200-period EMA (Exponential Moving Average) to identify if the market is in an uptrend.
• If the price is above the 200 EMA, we consider it an uptrend and allow long trades.
2. Identify Breakout Levels
• The strategy detects recent high and low pivot points to draw Fibonacci extension levels.
• It focuses on the 1.618 Fibonacci level, which is often a target in strong trends.
• When the price breaks above this level in an uptrend, it signals a potential momentum breakout – a good time to buy.
3. Enter a Trade
• The strategy enters a long (buy) position when the price closes above the 1.618 Fibonacci level and the market is in an uptrend (above the 200 EMA).
4. Manage Risk Automatically
• The trade includes a stop-loss set to 1x the ATR (Average True Range) below the entry price – this protects against sudden drops.
• It sets a take-profit at 3x the ATR above the entry – aiming for higher rewards than risks.
⚠️ Important Notes
• 📈 Higher Timeframes Preferred: This strategy works best on Daily (D), 3-Day (3D), and Weekly (W) charts, especially on Gold (XAUUSD).
• 🧪 Not for Deep Backtesting: Due to the nature of how pivot points and Fib levels are calculated, this strategy may not perform well in backtesting simulations (because the historical calculations can shift). It is better used for live analysis and forward testing.

CANX MA Crossover© CanxStixTrader
Moving average crossover systems measure drift in the market. They are great strategies for time-limited traders. KEEP IT SIMPLE
This strategy works both for buys and sells using the reaction line to guide your position against the reactions.
HOW TO USE THE INDICATOR
1) Choose your market and timeframe.
2) Choose the length.
3) Choose the multiplier.
4) Choose if the strategy is long-only or bidirectional (longs & shorts).
TIPS
The strategy works best in bullish markets as that is the primary direction that market such as stocks, indexes and metals like to move.
- Increase the multiplier to reduce whipsaws
- Increase the length to take fewer trades
- Decrease the length to take more trades
- Try a Long-Only strategy to see if that performs better.
The base set up when you load the indicator is for the 1 minute chart on gold. We found that it also works well on the US Indexes. For other markets you may need to change the length and multiplier to suit the market and back test its results.

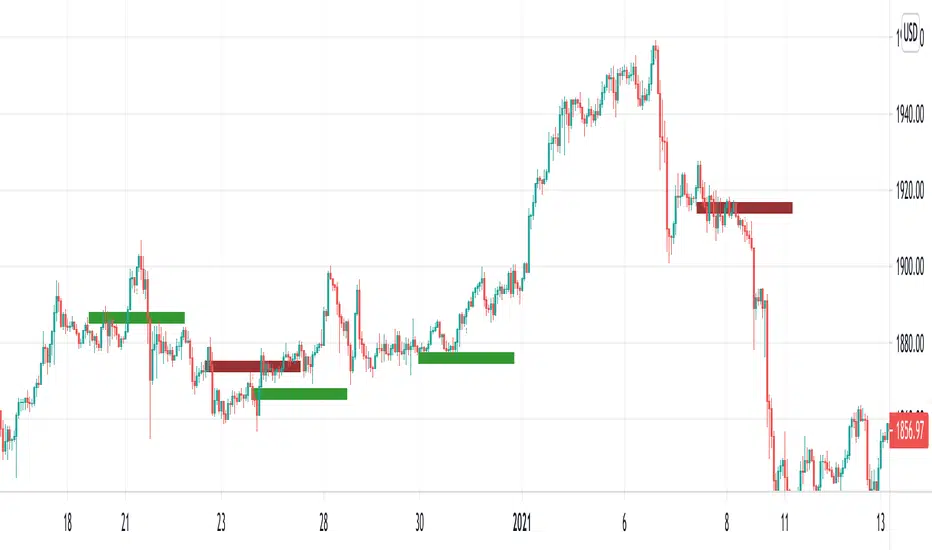
XAUUSD Weekly Gap Indicator (oberlunar)The XAUUSD Weekly Gap Indicator is a technical tool designed specifically for tracking weekly price gaps in the XAUUSD (gold) market. It identifies and visualizes the price difference between the Friday close and the Monday open, providing valuable insights into market dynamics over the weekend.
Gap Detection:
Measures the price difference between Friday's closing price and Monday's opening price.
Highlights whether the gap is bullish (Monday opens above Friday’s close) or bearish (Monday opens below Friday’s close).
Visualization:
Draws a line or rectangle to connect the Friday close and the Monday open, clearly marking the gap on the chart.
Displays an indicator label with the gap value, often in pips or points, to quantify the gap size.
Color Coding:
Green: Bullish gap (positive price movement).
Red: Bearish gap (negative price movement).
Market Sentiment:
Large gaps can indicate significant market sentiment shifts due to weekend events, such as economic reports or geopolitical news.
Support and Resistance:
Weekly gaps often act as temporary support or resistance levels, as the market may attempt to revisit or "fill" the gap.
Trading Strategies:
Gap Filling: XAUUSD often tends to "fill" these gaps, providing trading opportunities.
Continuation or Reversal: The reaction to the gap can signal whether the trend is likely to continue or reverse.

T3 Gold Sniper [RickAtw]Gold Sniper based on support and resistance looks for a sniper entry for trades. Used together with EMA
Key signal
Buy ------> Green Line
Sell ------> Red Line
Functional
The system was made for gold and everything is tuned for it.
I am a professional investor and I test each system for how long. If the system makes an income, it gets to my page. Use it for gold, cryptocurrencies and pairs AUD/USD GBP/USD
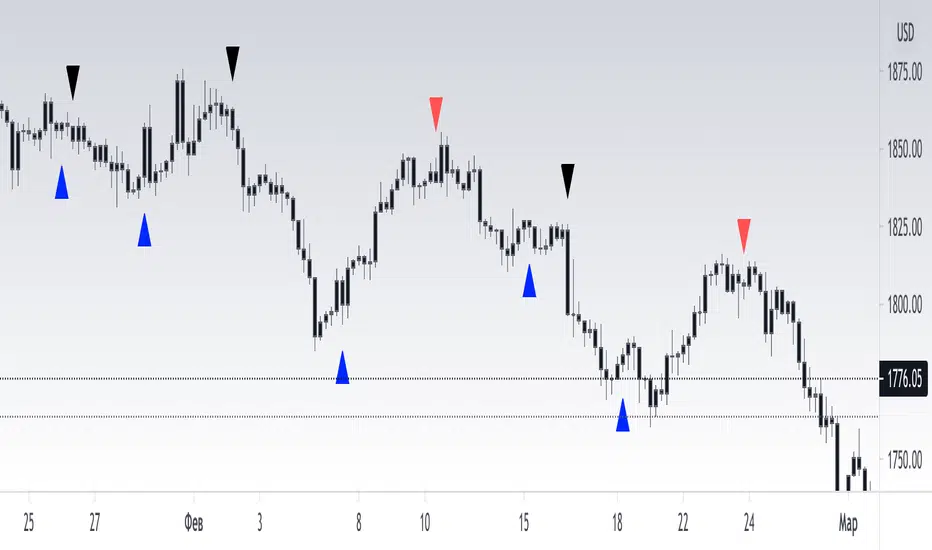
[RickAtw] T2 Trend Signal GOLDTrend gold signal Ema strategy
The system finds the best entries for a trade. Use in gold, all numbers have been customized for it.
Functional
T2 trend gold is the second version of my trading system. Be sure to check out the first part! This system gives a signal earlier.
Key signals
Buy -----> Blue triangle to buy
Sell -----> Red triangle to sell
Remarks
I personally tested this system on my own trading and it helps me find entries for deals. The main thing is, if consolidation has begun, turn off the system, because the trading range is small at this moment, use oscillators
Thanks to everyone who supports me. Good luck to you friends