Wolfe Strategy [Trendoscope]Hello Everyone,
Wish you all Merry X-Mas and happy new year. Lets start 2023 with fresh new strategy built on Wolfe Indicator. Details of the indicator can be found here
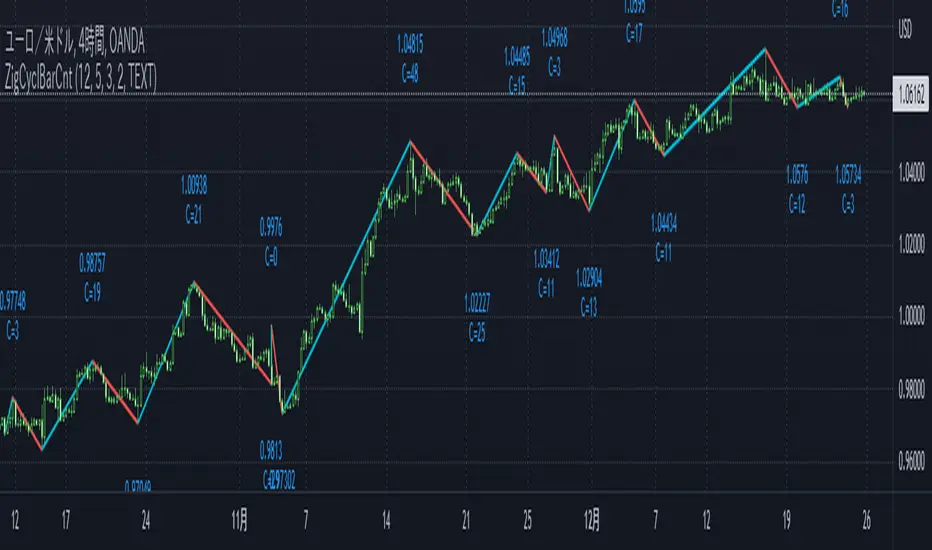
🎲 Wolfe Concept
Wolfe concept is simple. Whenever a wedge is formed, draw a line joining pivot 1 and 4 as shown in the chart below:
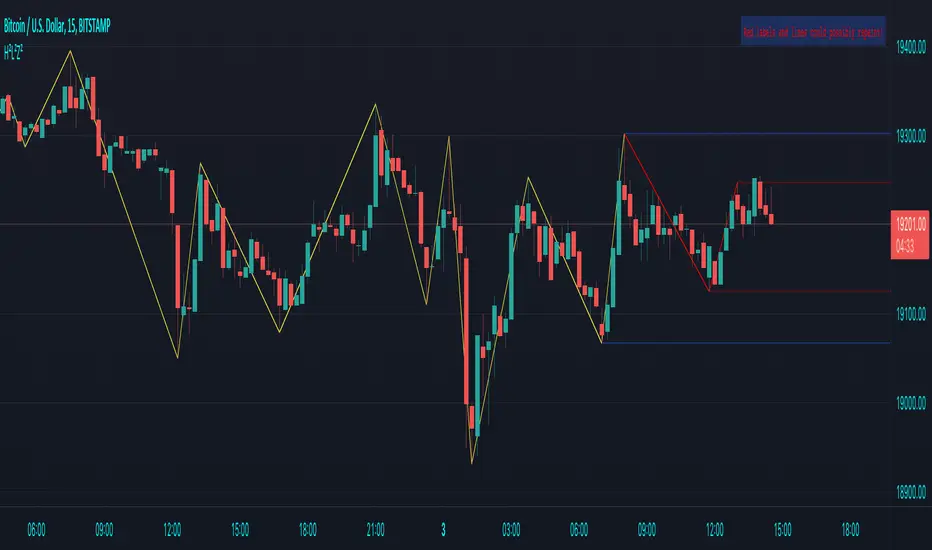
For simplicity, we will only consider static value for Target and Stop. But, entry is done based on breaking the triangle. Revised strategy looks something like this:
🎲 Settings
Settings are simple and details of each are provided via tooltips.
Out of these, the most important one is minimum risk reward ratio. If you set lower risk reward threshold then losing few trades may generate more losses than more winning trades. Similarly higher value will filter out most of the trades and may not work efficiently. Default value set to 1 to make sure optimal risk reward is present before placing trade. Also make note that since the entry bar is always moving towards stop, as and when pattern progress, the RR will also increase. Hence, a pattern which is below RR threshold may become good to trade at certain point of time in future.
🎲 Strategy Parameters
Default strategy parameters are initialised via definition. Margins are set to 100 to disable leveraged trades. Appropriate values are chosen for other parameters. These can be altered based on individual strategy and trading plan.
As the strategy concentrates on the single pattern, number of trades generated are comparatively less. But, there is chance to increase the algorithm further to catch more such patterns on larger scale. Will try to work on them in next versions.
🎲 Pine Strategy limitations
Backtest can only be done on one direction as pine strategy cannot have both long and short open trades together. Hence, it is mandatory to chose either long/short trades in settings.
Since pyramiding is limited to 1, there is possibility of a pattern not generating trade even though the entry conditions are met. They are just based on pine limitations and not necessarily mean patterns are not good for placing trades.
Stratégie Pine Script®