Analyse: Dividendes
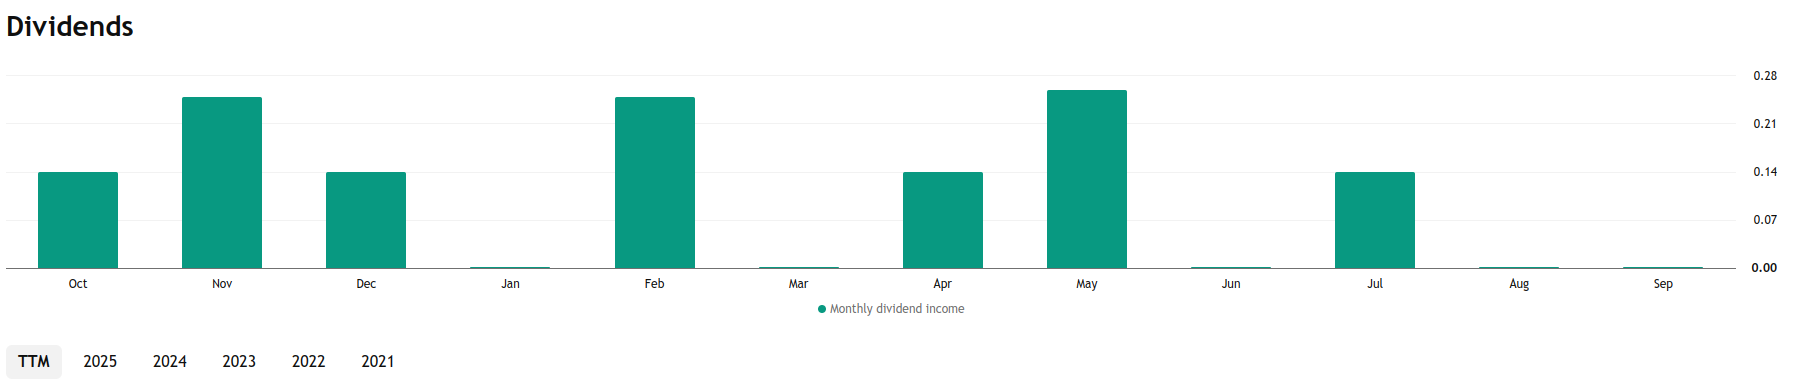
Ce graphique montre les revenus mensuels provenant des dividendes de votre portefeuille. Chaque barre représente le total des dividendes reçus au cours d'un mois donné.
Vous pouvez consulter les données des douze derniers mois (TTM) ou sélectionner une année spécifique parmi les options situées sous le graphique.
- Revenus mensuels de dividendes — montant total des dividendes reçus au cours du mois sélectionné.
- Utilisez les onglets annuels (TTM, 2025, 2024, 2023, etc.) pour naviguer rapidement entre les différentes périodes.
Cette visualisation vous permet de suivre l'évolution des dividendes au fil du temps et vous aide à analyser la saisonnalité et la régularité de vos revenus de dividendes.