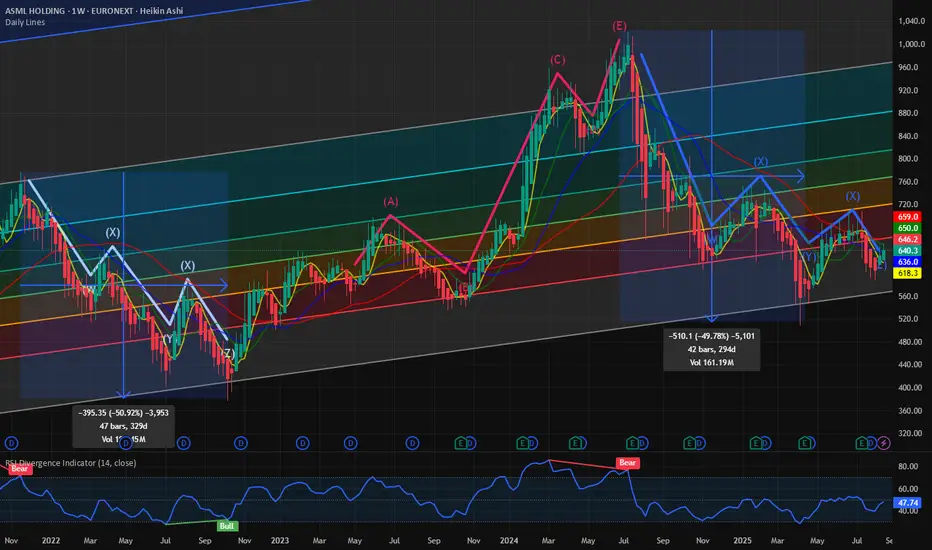
IN this chart below we are following a combination of various technical indicators to see the path of least resistance for the stock. The stock every time bounces back from the lower bound of the upward slopping fib retracement channel. During the 2022 bear market the stock made lower lows and after 5th leg of the bearish pattern on the Elliot’s wave the stock finally made its lows after 329 days of trading and down almost 50%. From its lows it also perfectly followed a textbook rally in 5 legs perfectly matching a bullish Eliots wave pattern before reaching ATH of 1030 $. The recent drawdown on the stock also happened when the stock went above the channel and was slammed back into penalty box by the sellers.
Surprisingly the stock also followed the same Eliots wave bearish pattern downwards and the price bottomed at the lows of the channel now almost 2 times in the weekly chart shown below. Each time the stock had a drawdown of almost 50% in 2 instances. As the stock is going sideways for quite a few weeks we can expect some bullish price action with 980 $ in the upper limit.
Verdict:
Publications connexes
Clause de non-responsabilité
Les informations et publications ne sont pas destinées à être, et ne constituent pas, des conseils ou recommandations financiers, d'investissement, de trading ou autres fournis ou approuvés par TradingView. Pour en savoir plus, consultez les Conditions d'utilisation.