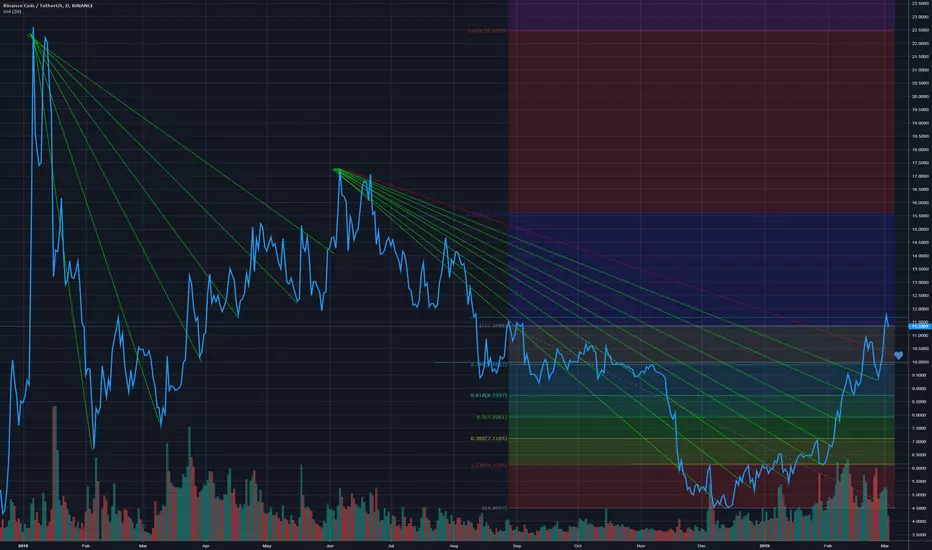
- Volumes are not enough to break the previous resistance, that's why in the past three days we have seen two strong resistances at 11.6$ which were not broken.
- If you look at green candlestick (1D timeframe), you will see that always, after 4/5 candlesticks the price recorrects itself by dropping. We are now at 4th.
- By looking at the green lines on the graphs, the uptrend follows a logic, which suggests a drop
- The main trend-line is almost in the "blu zone" with Fibonacci.
For these reasons I do not think it will go up now, but will drop and reach the heart point (about 10.5$), to recover after some day.
Be carefull guys.
Clause de non-responsabilité
Les informations et publications ne sont pas destinées à être, et ne constituent pas, des conseils ou recommandations financiers, d'investissement, de trading ou autres fournis ou approuvés par TradingView. Pour en savoir plus, consultez les Conditions d'utilisation.
Clause de non-responsabilité
Les informations et publications ne sont pas destinées à être, et ne constituent pas, des conseils ou recommandations financiers, d'investissement, de trading ou autres fournis ou approuvés par TradingView. Pour en savoir plus, consultez les Conditions d'utilisation.