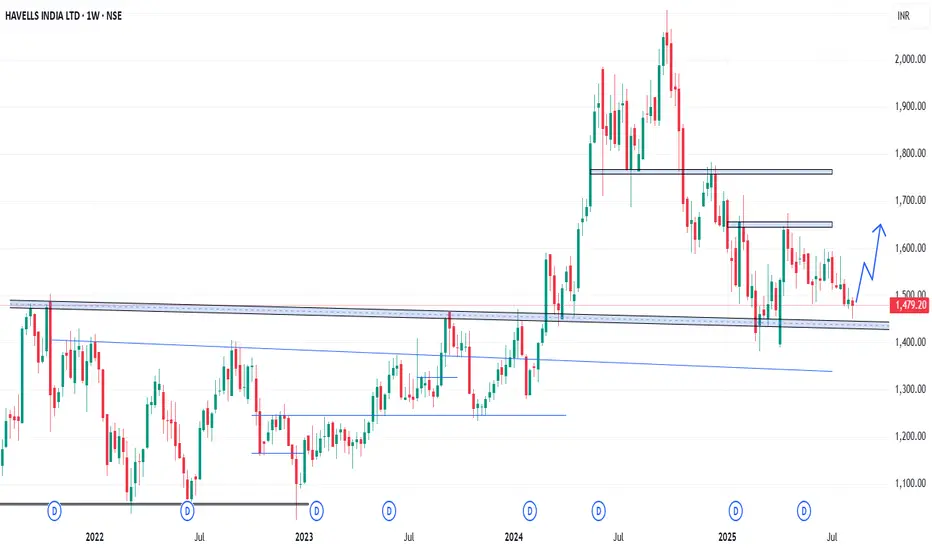
In the Weekly Chart of HAVELLS ,
we can see that, it has created a Hammer candle on support.
We can see a bounce back from here.
Expected momentum is shown in chart.
we can see that, it has created a Hammer candle on support.
We can see a bounce back from here.
Expected momentum is shown in chart.
Clause de non-responsabilité
Les informations et publications ne sont pas destinées à être, et ne constituent pas, des conseils ou recommandations financiers, d'investissement, de trading ou autres fournis ou approuvés par TradingView. Pour en savoir plus, consultez les Conditions d'utilisation.
Clause de non-responsabilité
Les informations et publications ne sont pas destinées à être, et ne constituent pas, des conseils ou recommandations financiers, d'investissement, de trading ou autres fournis ou approuvés par TradingView. Pour en savoir plus, consultez les Conditions d'utilisation.