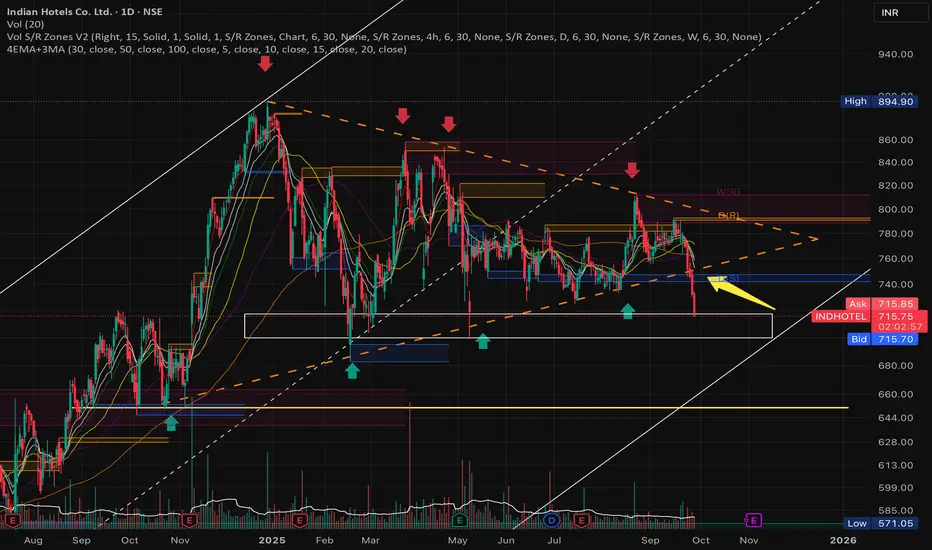
The chart has formed a symmetrical triangle pattern, which has taken shape over approximately 270 days. This pattern was recently broken, and a new support level has emerged around 713.
If the 713 support fails to hold, the next potential downside targets are 703, 695, and 685.
However, it's important to note that the stock remains in a broader upward trend, as illustrated by the ascending channel. As long as the price stays within this channel, any pullback toward the lower boundary could present a potential buying opportunity, suggesting a continuation of the uptrend.
Caution:
If the stock breaks below the channel, the current trend structure would be invalidated, and a fresh analysis would be required to reassess the setup.
Clause de non-responsabilité
Les informations et les publications ne sont pas destinées à être, et ne constituent pas, des conseils ou des recommandations en matière de finance, d'investissement, de trading ou d'autres types de conseils fournis ou approuvés par TradingView. Pour en savoir plus, consultez les Conditions d'utilisation.