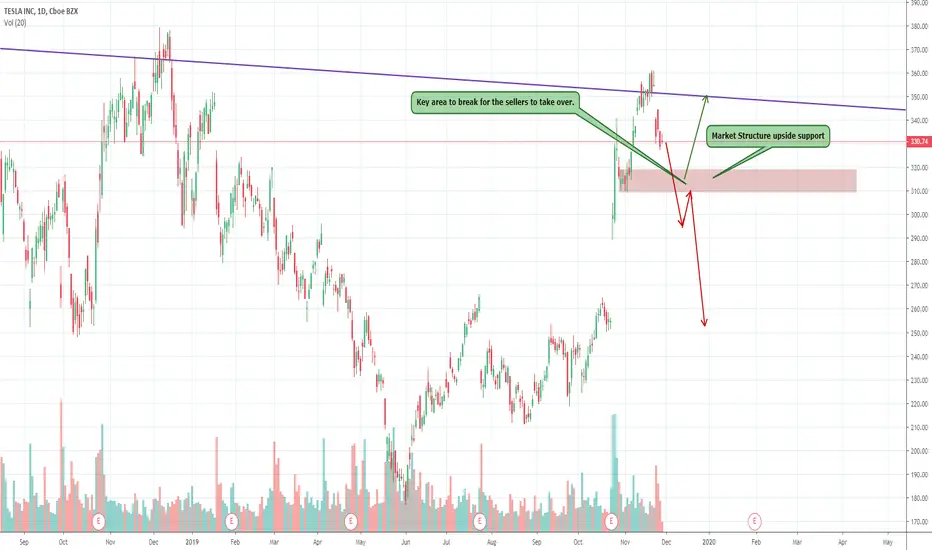
On an overall trend, TSLA has been forming lower highs if you extend the view on a weekly chart. The new low at $360 based on the previous high on a larger timeframe suggests another impulse move lower. The pop above $300 was due to the earnings report that managed to beat finally on a positive note which got investors extremely excited. We suspect some more downside to erase some of the earnings euphoria after the release of the new Tesla truck. There is a level at $310 that may hold support based on market structure. The move is very overextended from the Fib extension hitting the 161.8% extended level before showing signs of resistance. A break of $310 will open the downside and a potential gap fill into $260.
Note
Disclaimer: This trade idea is for educational purposes exclusively, this does not constitute investment or trading advice. TRADEPRO Academy is not responsible for any market activity.Join a community of active traders, both swing and day traders. Education & Live trading.
Free Trading Strategy Webinar: bit.ly/2DVb7Zi
Free Trading Strategy Webinar: bit.ly/2DVb7Zi
Clause de non-responsabilité
Les informations et les publications ne sont pas destinées à être, et ne constituent pas, des conseils ou des recommandations en matière de finance, d'investissement, de trading ou d'autres types de conseils fournis ou approuvés par TradingView. Pour en savoir plus, consultez les Conditions d'utilisation.
Join a community of active traders, both swing and day traders. Education & Live trading.
Free Trading Strategy Webinar: bit.ly/2DVb7Zi
Free Trading Strategy Webinar: bit.ly/2DVb7Zi
Clause de non-responsabilité
Les informations et les publications ne sont pas destinées à être, et ne constituent pas, des conseils ou des recommandations en matière de finance, d'investissement, de trading ou d'autres types de conseils fournis ou approuvés par TradingView. Pour en savoir plus, consultez les Conditions d'utilisation.