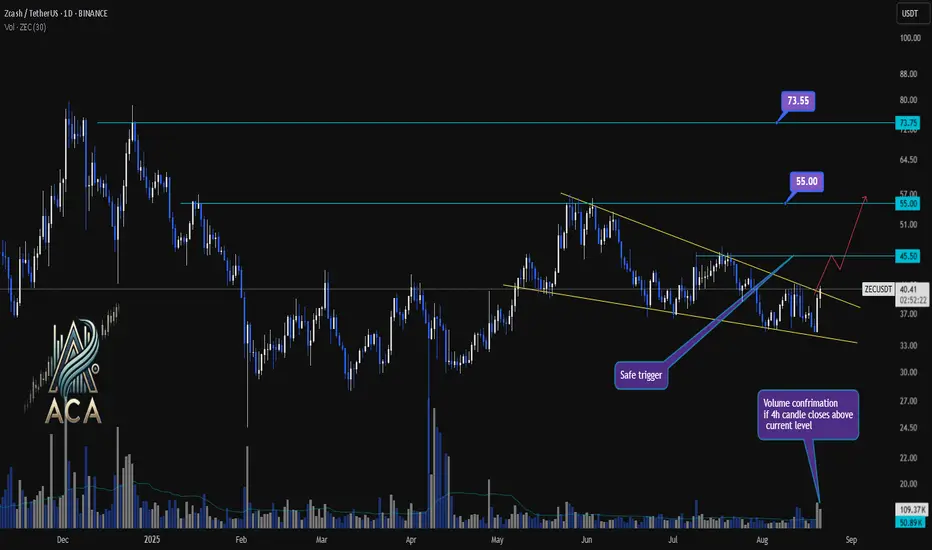
ZECUSDT Daily Chart Analysis | Symmetrical Triangle Breakout Watch
🔍 Let’s dissect the ZEC/USDT daily chart, where price action is nearing a pivotal breakout from a symmetrical triangle—often a precursor to major moves when combined with rising volume.
⏳ Daily Chart Overview
Zcash has been consolidating over recent weeks, forming a clear symmetrical triangle pattern bounded by converging trendlines. This pattern, characterized by lower highs and higher lows, signals that volatility is being compressed and a decisive breakout may be imminent.
🔺 Long Setup:
A daily close above the $45.50 resistance, especially with strong volume, will act as a “safe trigger” and confirm breakout validity. If bulls take charge here, the next upside objectives are $55.00 followed by $73.55. Watch for volume confirmation, ideally on a 4H candle close above resistance, to further add confidence to the breakout.
📊 Key Highlights:
- Symmetrical triangle pattern shows growing pressure for a directional move.
- Recent price tested triangle resistance; a close above $45.50 is the bullish trigger.
- Upside targets post-breakout are $55.00 and $73.55, provided volume supports the move.
- Volume spike serves as crucial confirmation—don’t chase without it.
🚨 Conclusion:
ZEC is coiling within a symmetrical triangle, setting the stage for potential breakout action. Bulls are watching $45.50 for a clean breakout trigger, eyeing $55 and $73.55 as next targets. Always wait for strong volume and confirmed closes before acting—symmetrical triangles can break both ways if conviction is lacking.
Clause de non-responsabilité
Les informations et publications ne sont pas destinées à être, et ne constituent pas, des conseils ou recommandations financiers, d'investissement, de trading ou autres fournis ou approuvés par TradingView. Pour en savoir plus, consultez les Conditions d'utilisation.
Clause de non-responsabilité
Les informations et publications ne sont pas destinées à être, et ne constituent pas, des conseils ou recommandations financiers, d'investissement, de trading ou autres fournis ou approuvés par TradingView. Pour en savoir plus, consultez les Conditions d'utilisation.